Market Update Los Angeles
Note: You can find the charts & graphs for the Big Story at the end of the following section.
*National Association of REALTORS® data is released two months behind, so we estimate the most recent month’s data when possible and appropriate.
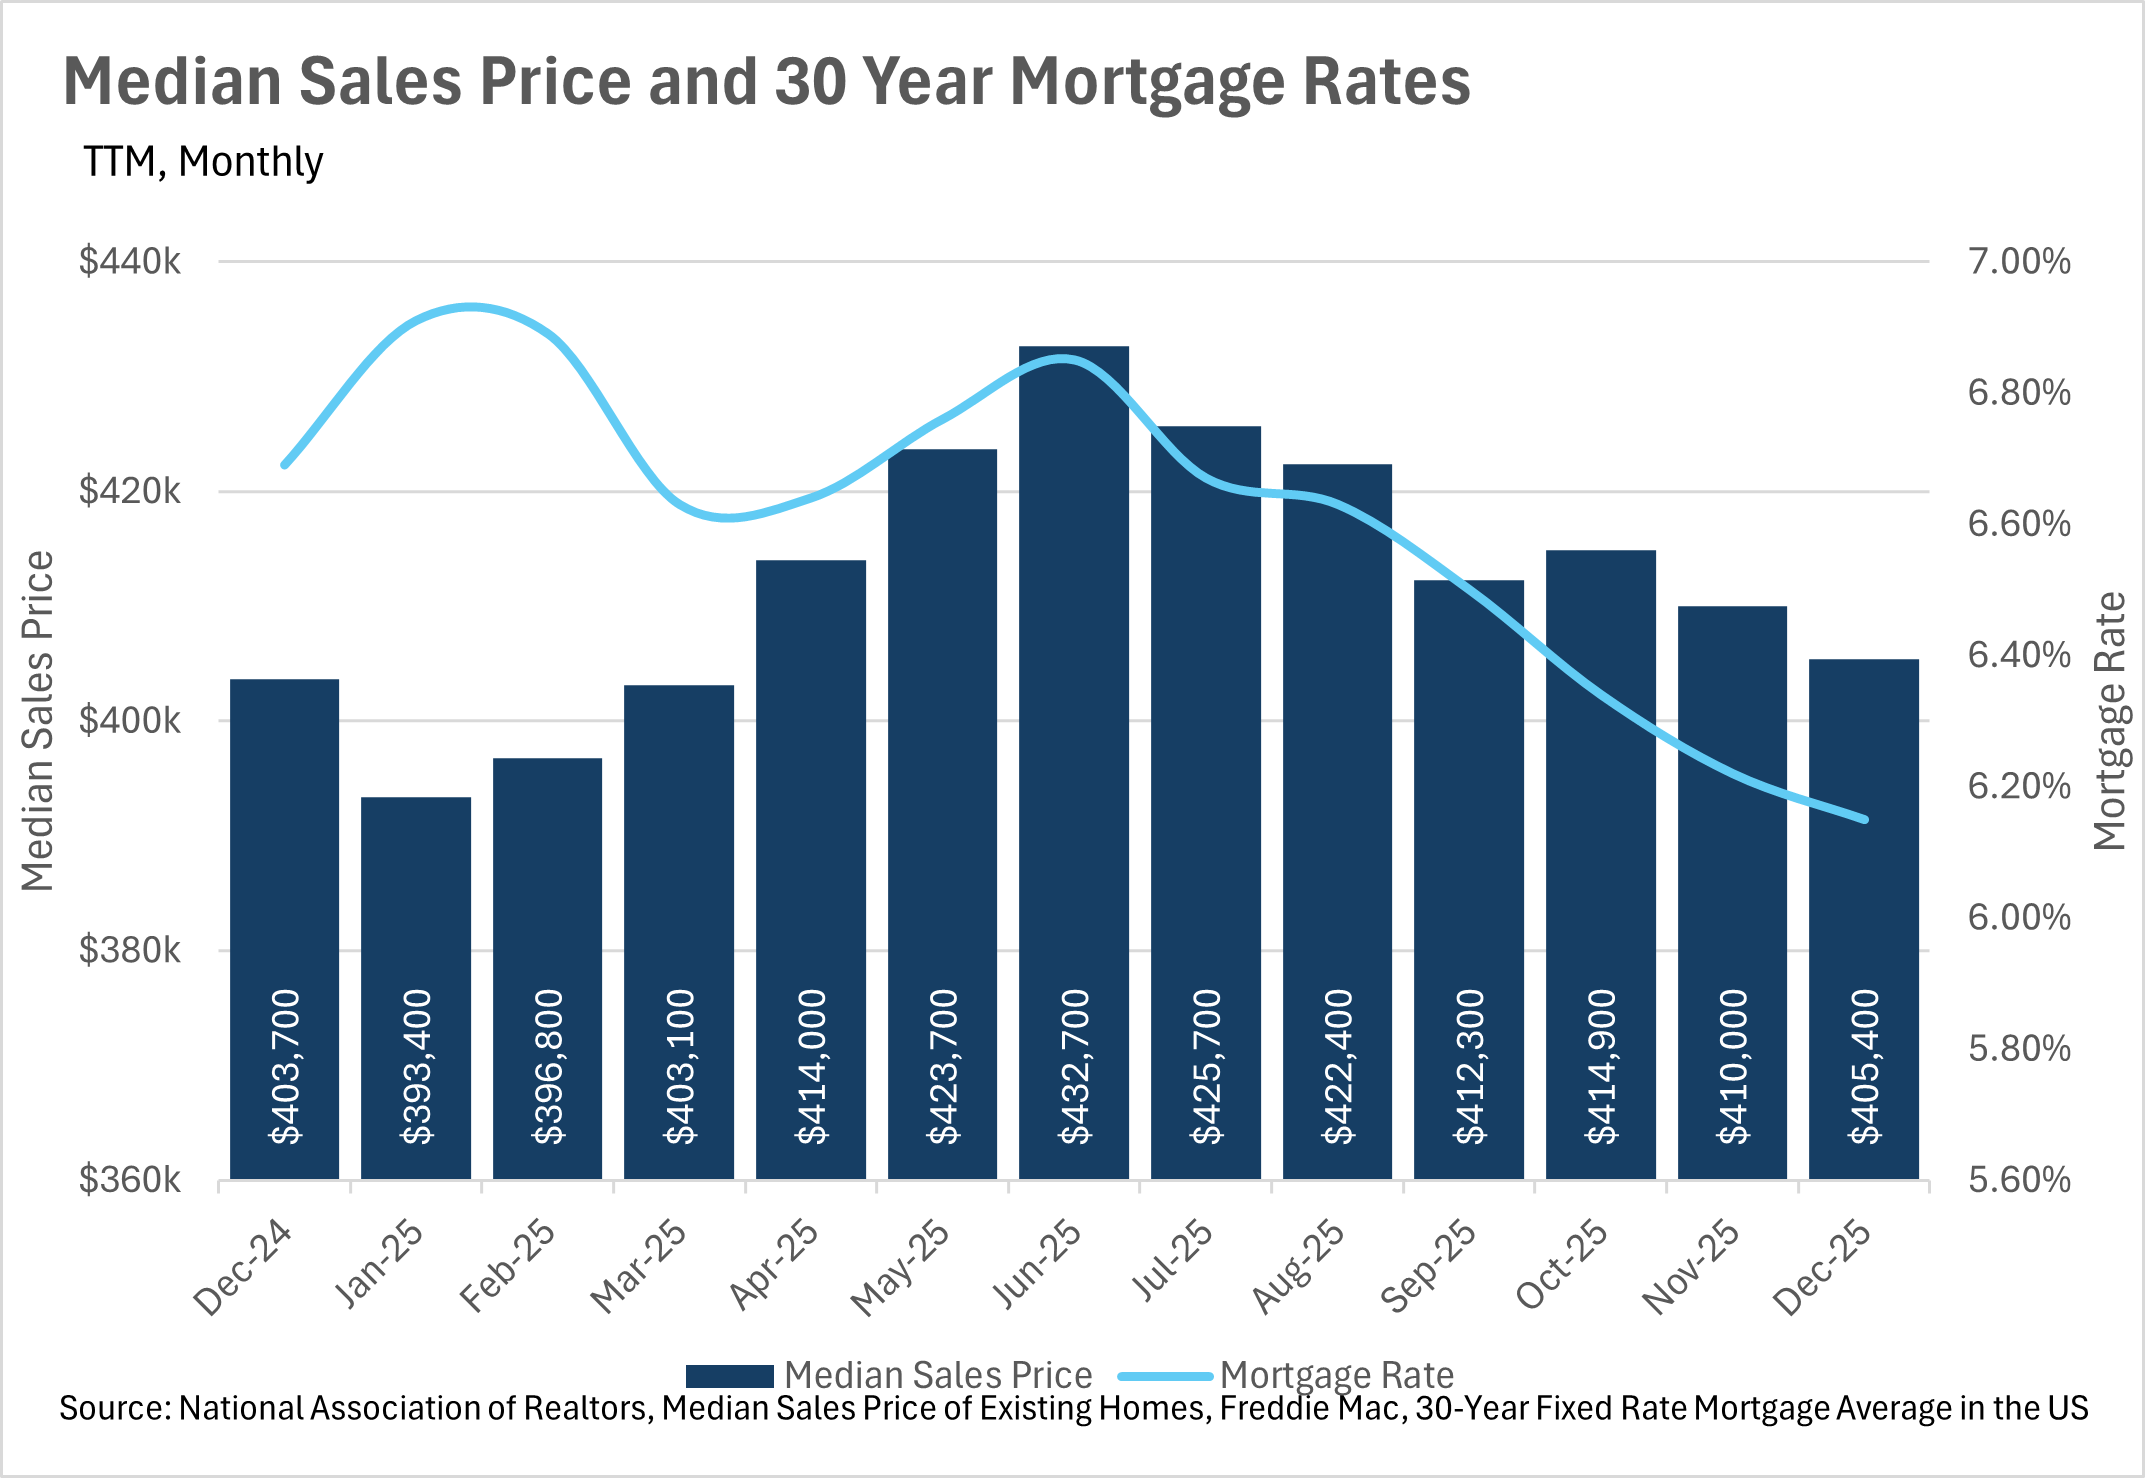
Fortunately for home buyers and sellers, the lending markets are beginning to believe that interest rates will remain low in the near and medium term future. This has led interest rates to continue inching down almost every month. In the past few weeks, we’ve seen the average 30-year mortgage rate at the lowest level it’s been in the past three years, which is tremendous news for the housing market. Unfortunately though, it doesn’t seem like the Fed will lower rates during the next FOMC meeting, as CME FedWatch currently has the probability of a March rate cut at just 7.9% at the time this was written. However, if you extend your time horizon out a bit, it does seem like there’s a good chance we see a rate cut or two throughout the rest of the year.
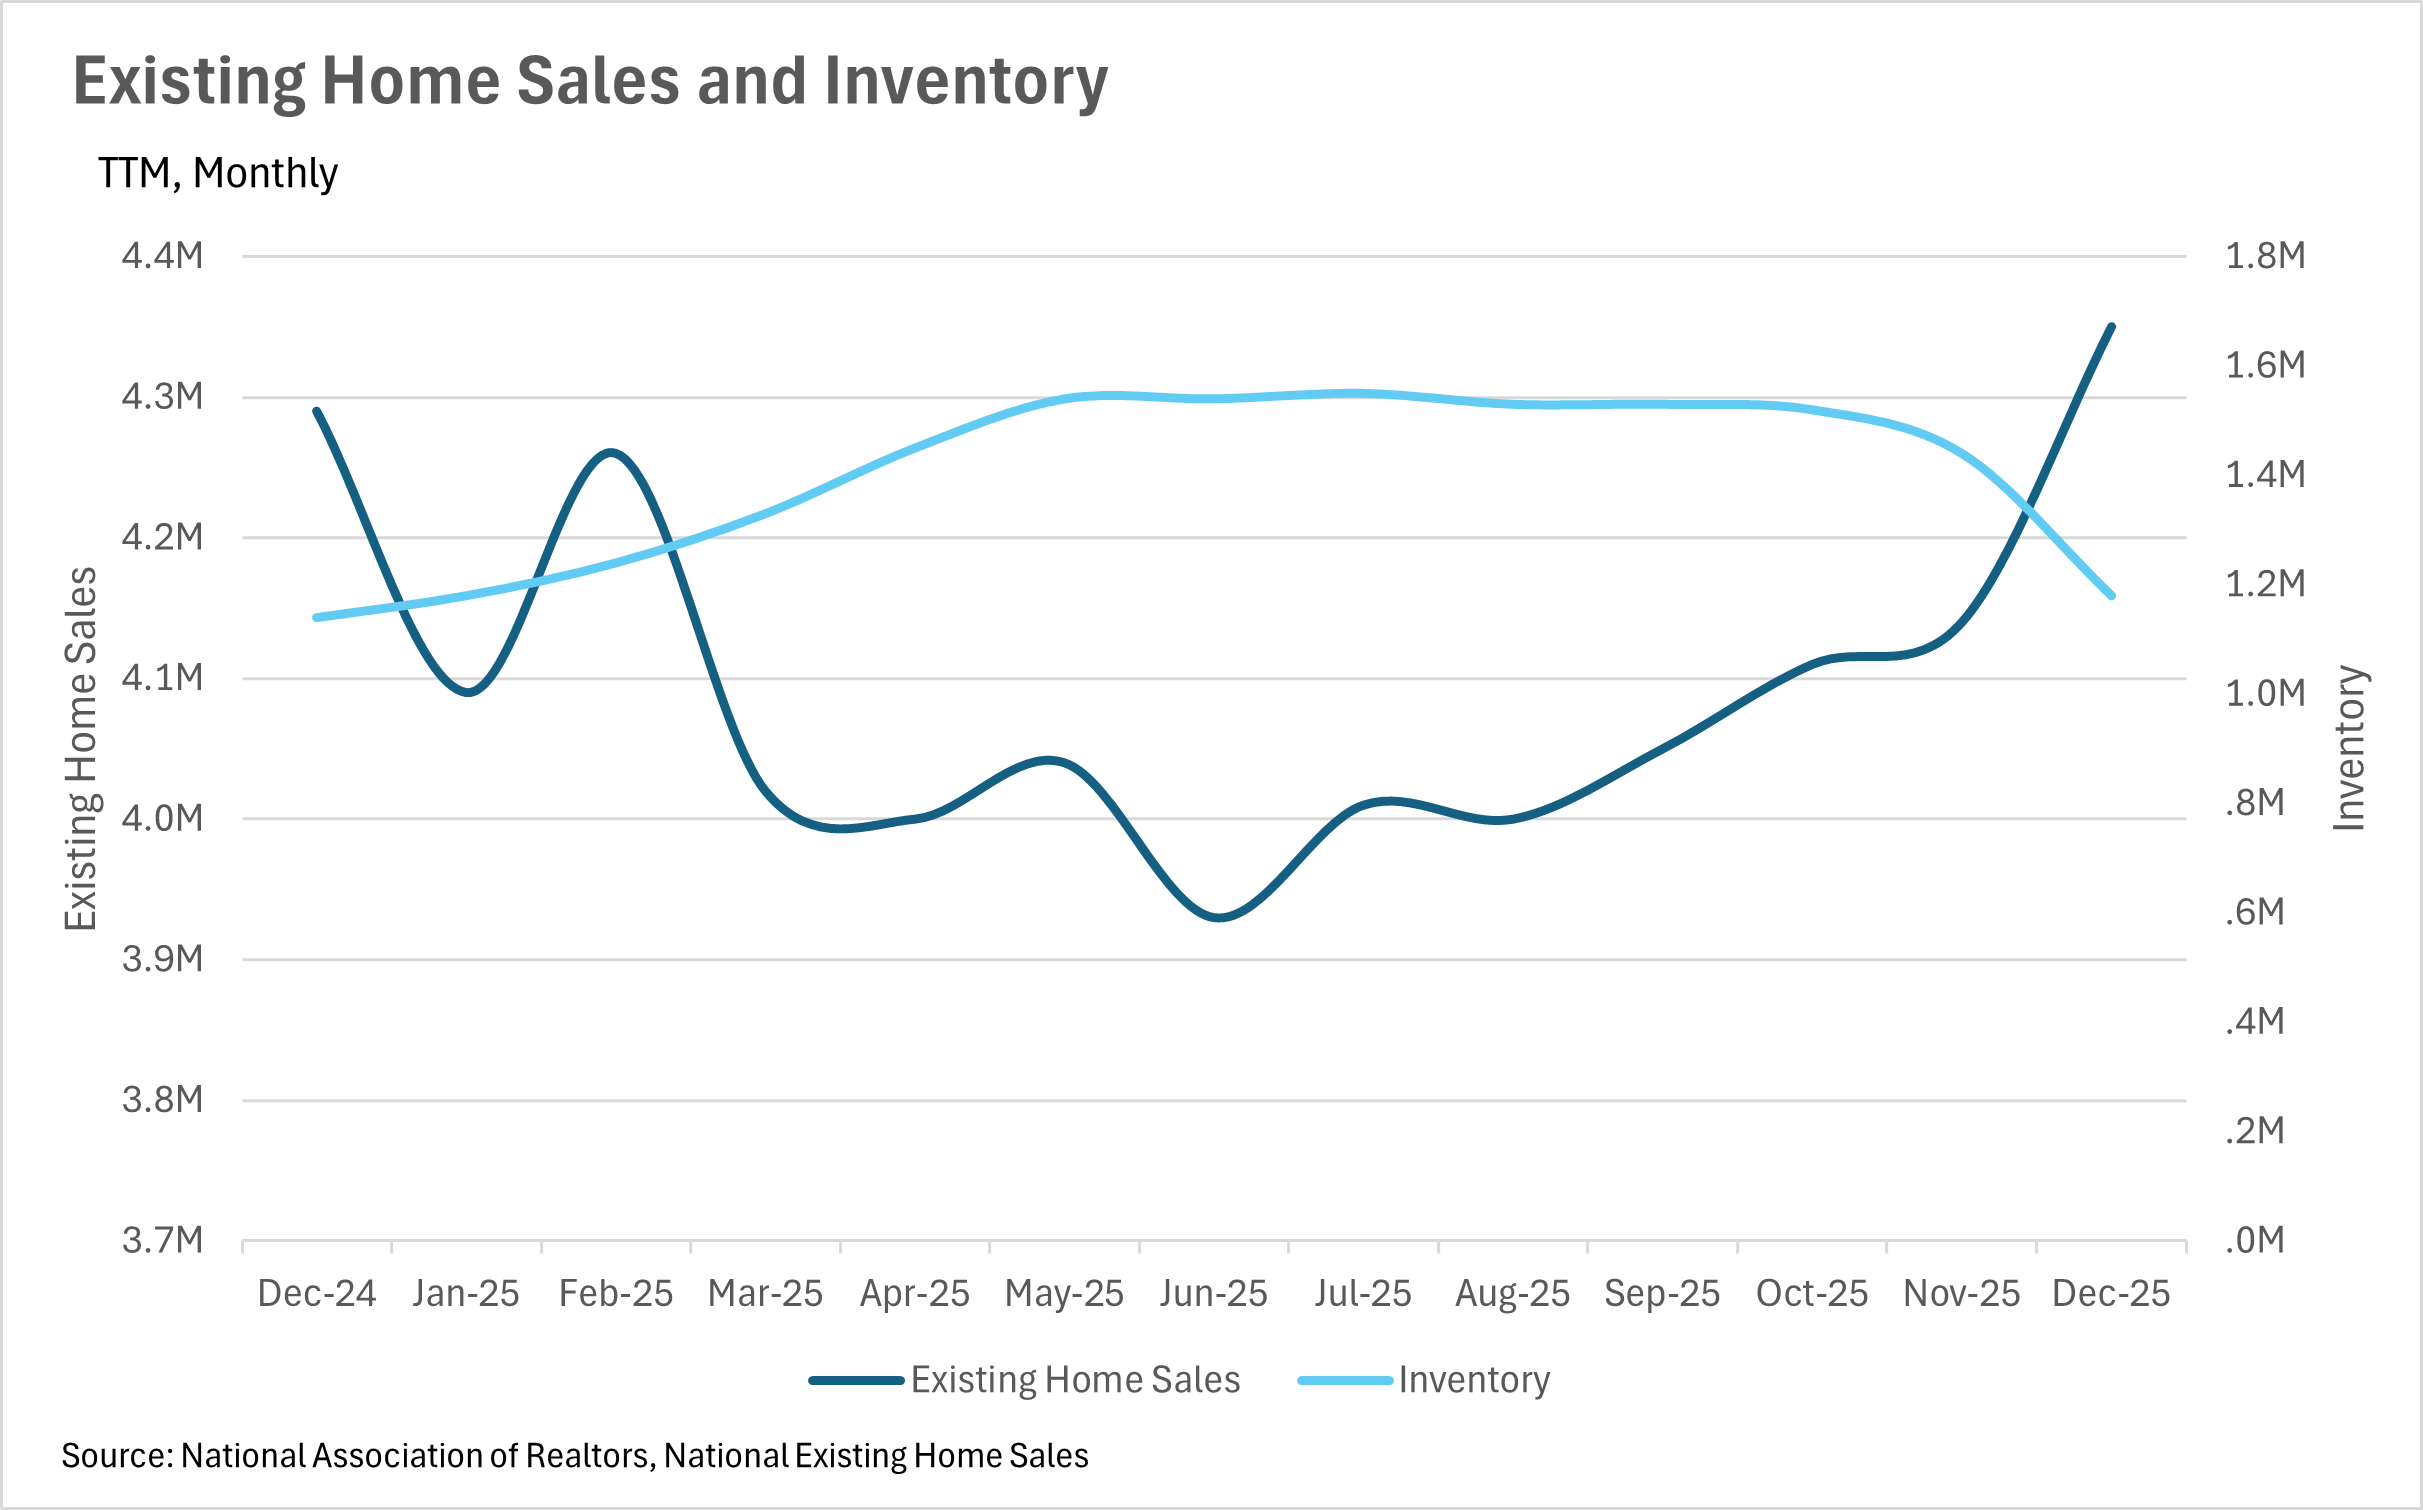
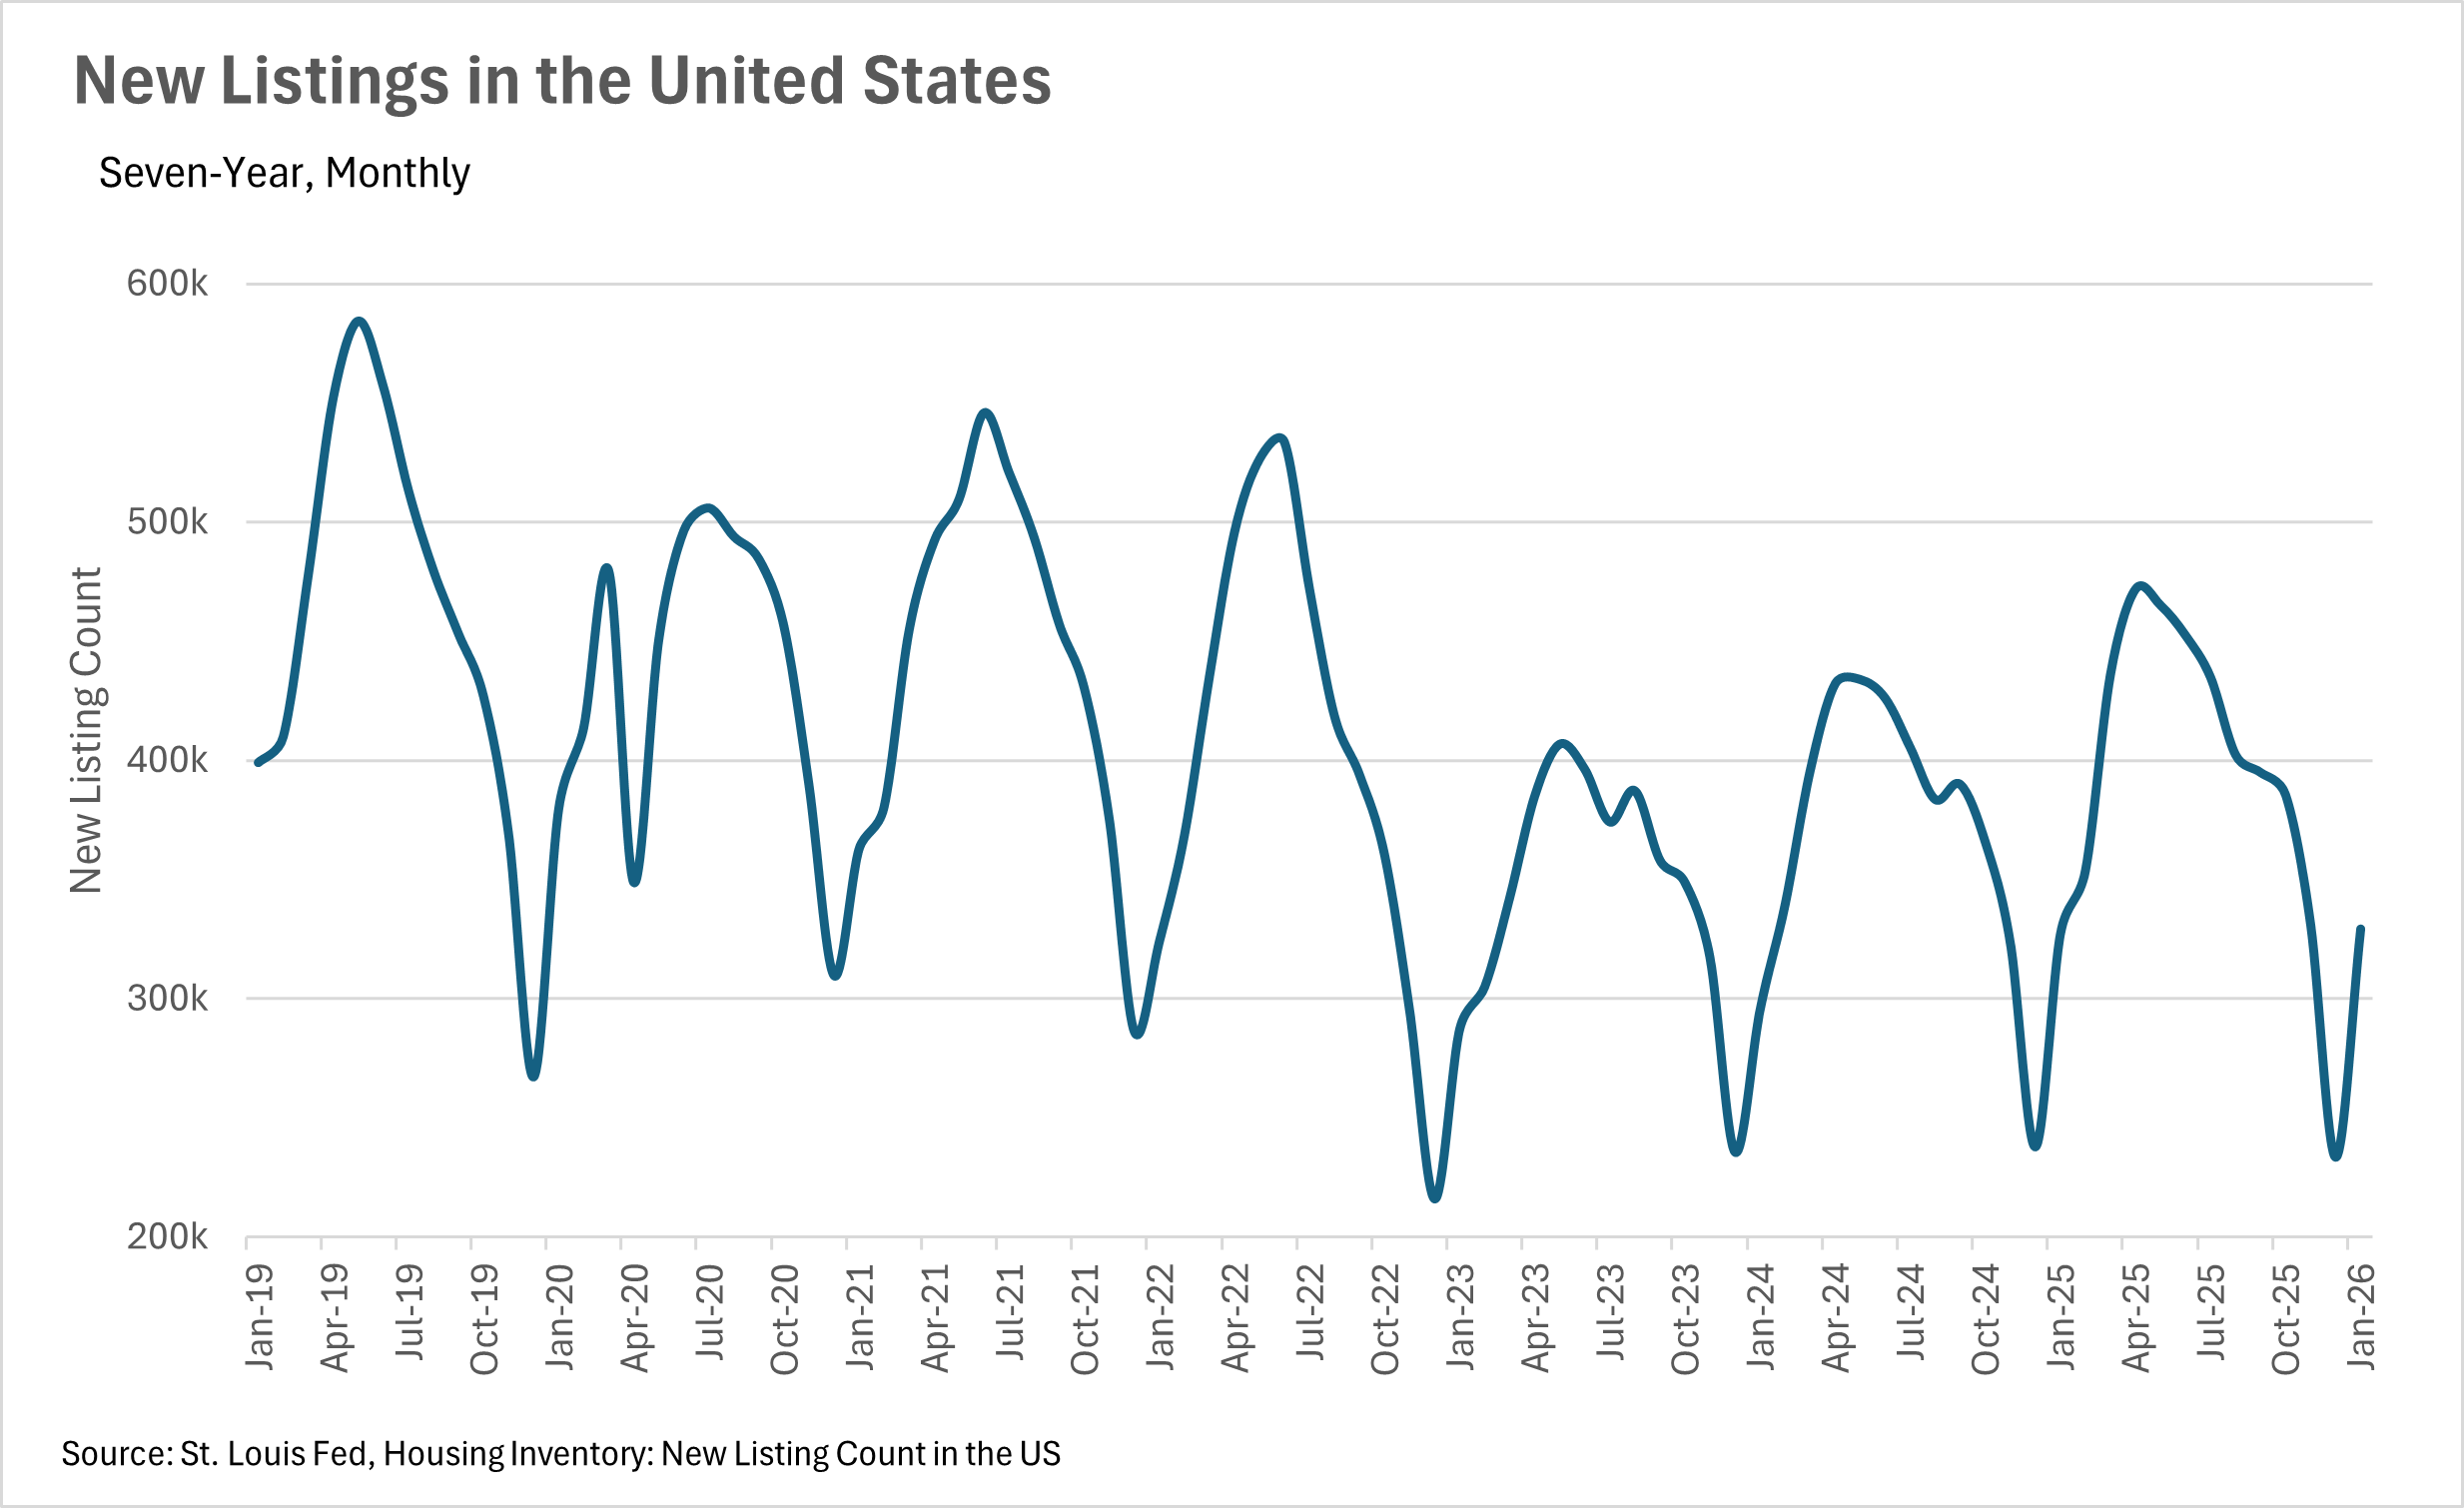
Although interest rates are coming down, and housing is becoming more affordable, we’re not seeing much change in terms of inventories, new listings, or existing home sales. Existing home sales and inventories are up 1.40% and 3.51% on a year-over-year basis, respectively. At the same time, new home listings are up just 0.68% on a year-over-year basis. This suggests that there are still a lot of buyers waiting on the sidelines for rates to come down even more before they pounce on their next home. It’ll be worth paying attention to all of the metrics we track as we move through the seasonally slow winter and into the spring and summer when the market really heats up. If we see a rate cut or two prior to the first heat wave of the year, we could see some bidding wars throughout the summer!
As we mentioned above, we are likely to see rates stay where they are at least in the next FOMC meeting or two. While there was some speculation that the next appointed Fed Chair would create a Fed that is less autonomous in it’s decisions, the market does not believe that future Chairman Warsh will be the wildcard that many were anticipating. This can largely be supported by the fact that we’ve seen precious metals sell off precipitously recently, as these are typically considered a hedge when the dollar is less-than-stable. However, only time will tell, which means it’ll be more important than ever to pay attention to Fed commentary!
It’s important to note though, that all of this is what we’re seeing at a national level. As we all know, real estate is a highly localized asset, which is why you should check out what’s going on in your local market below in the Local Lowdown!
Note: You can find the charts/graphs for the Local Lowdown at the end of this section.
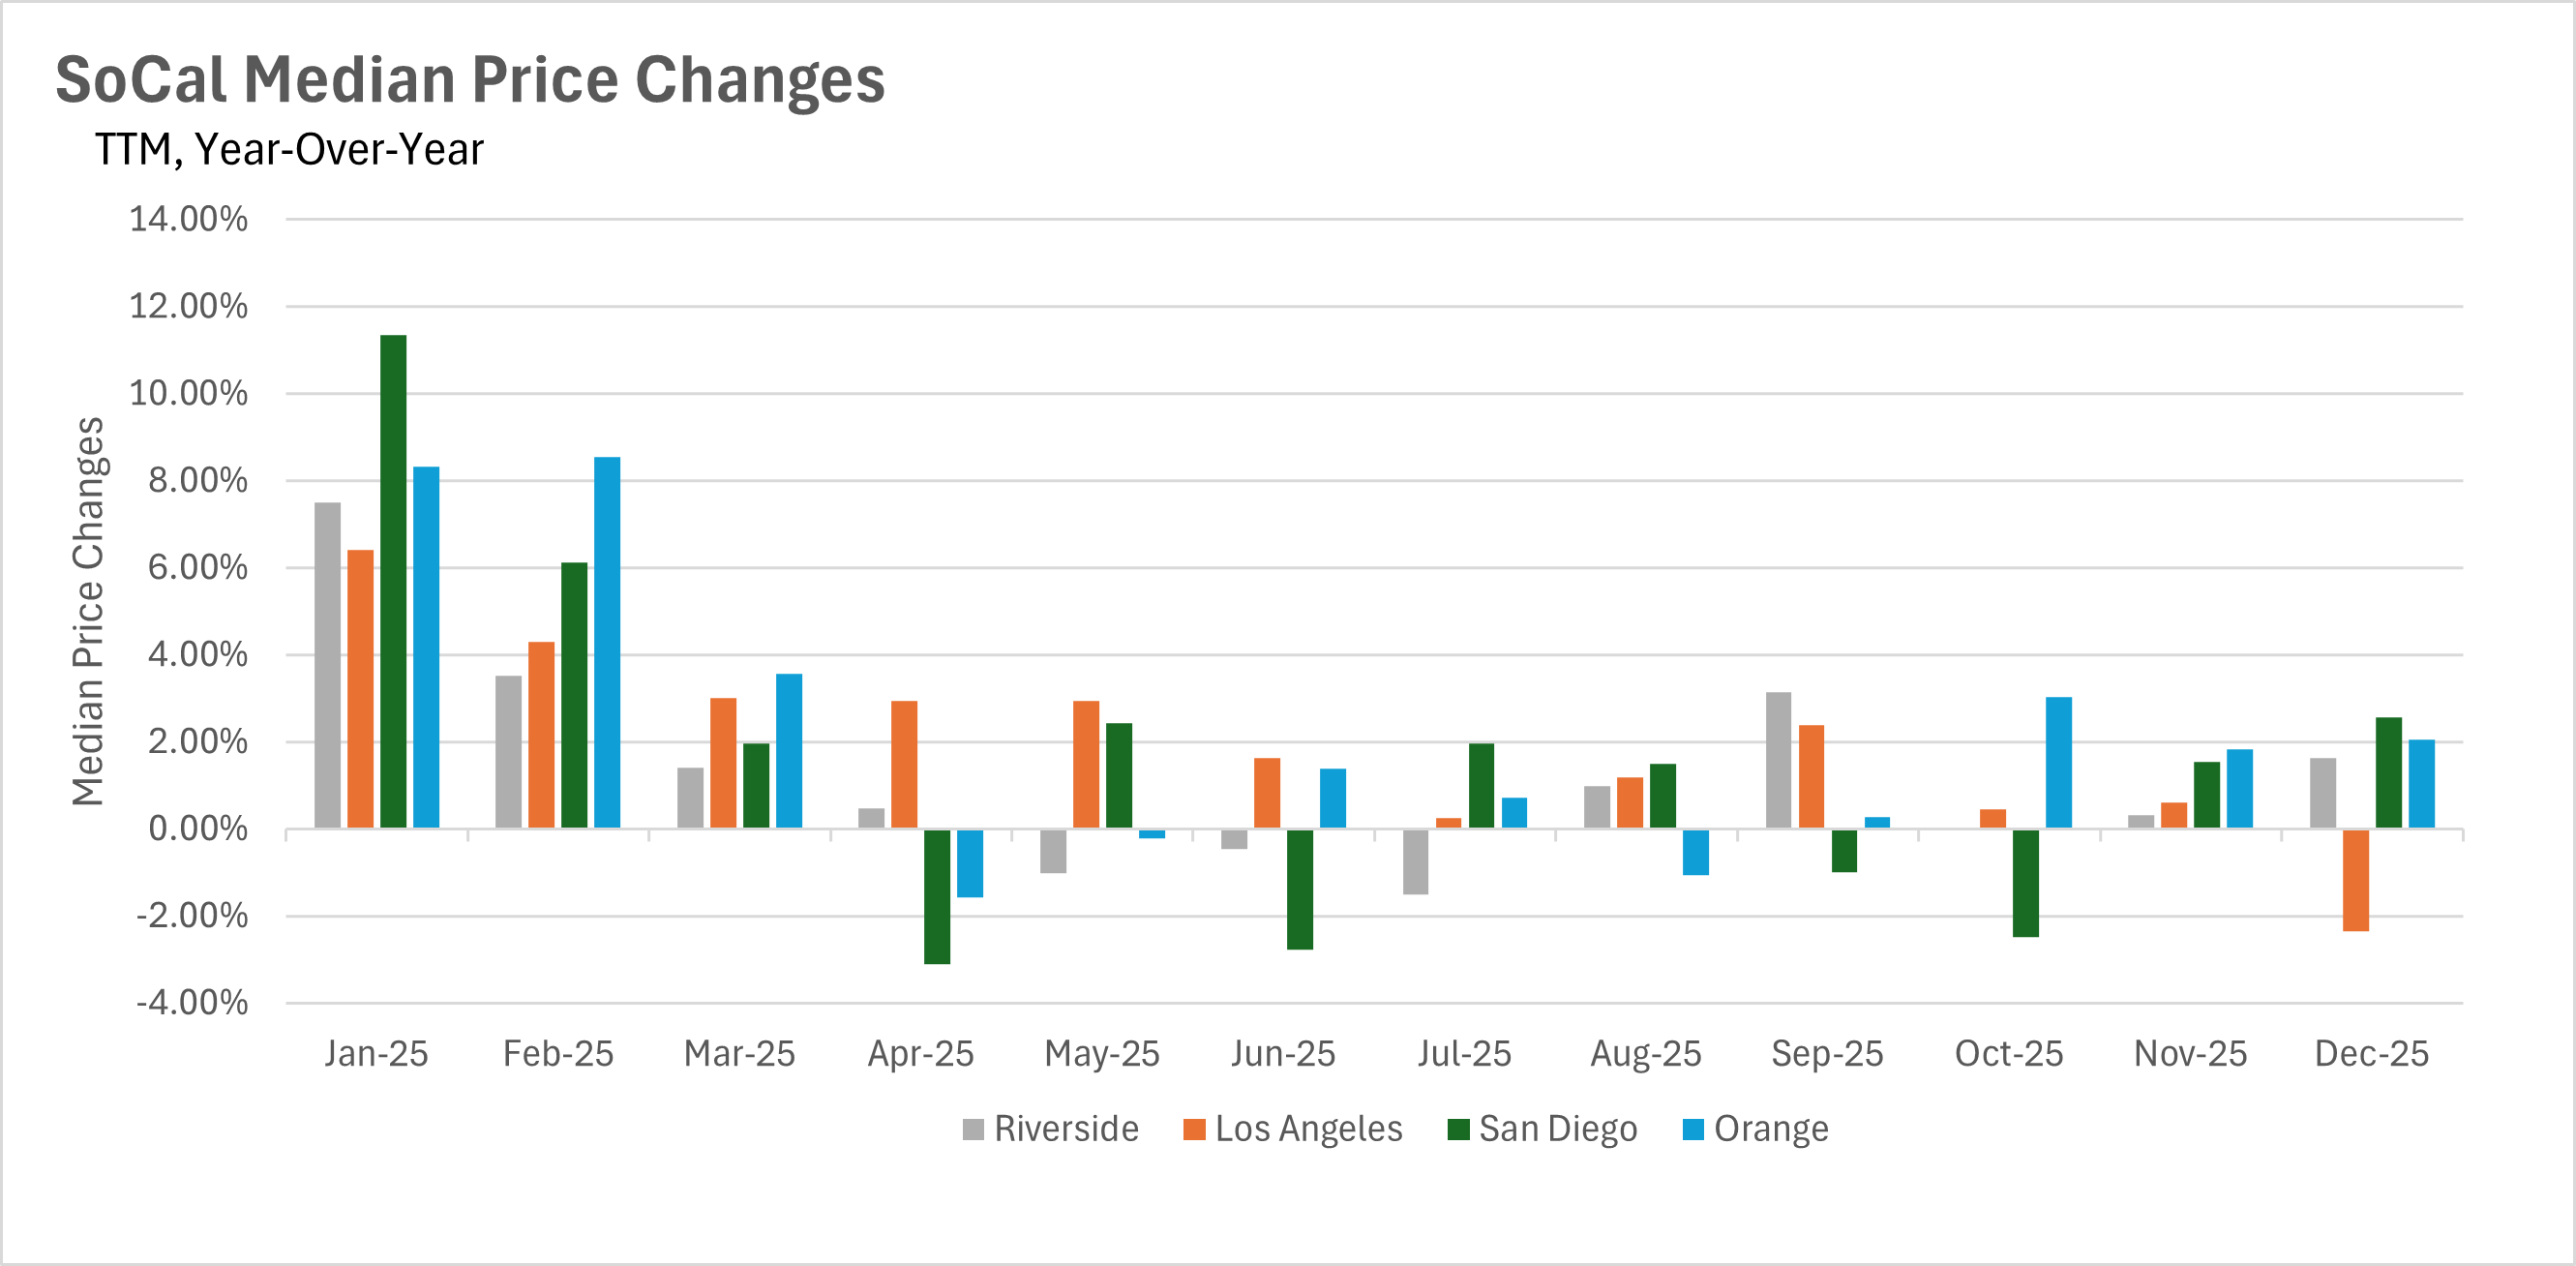
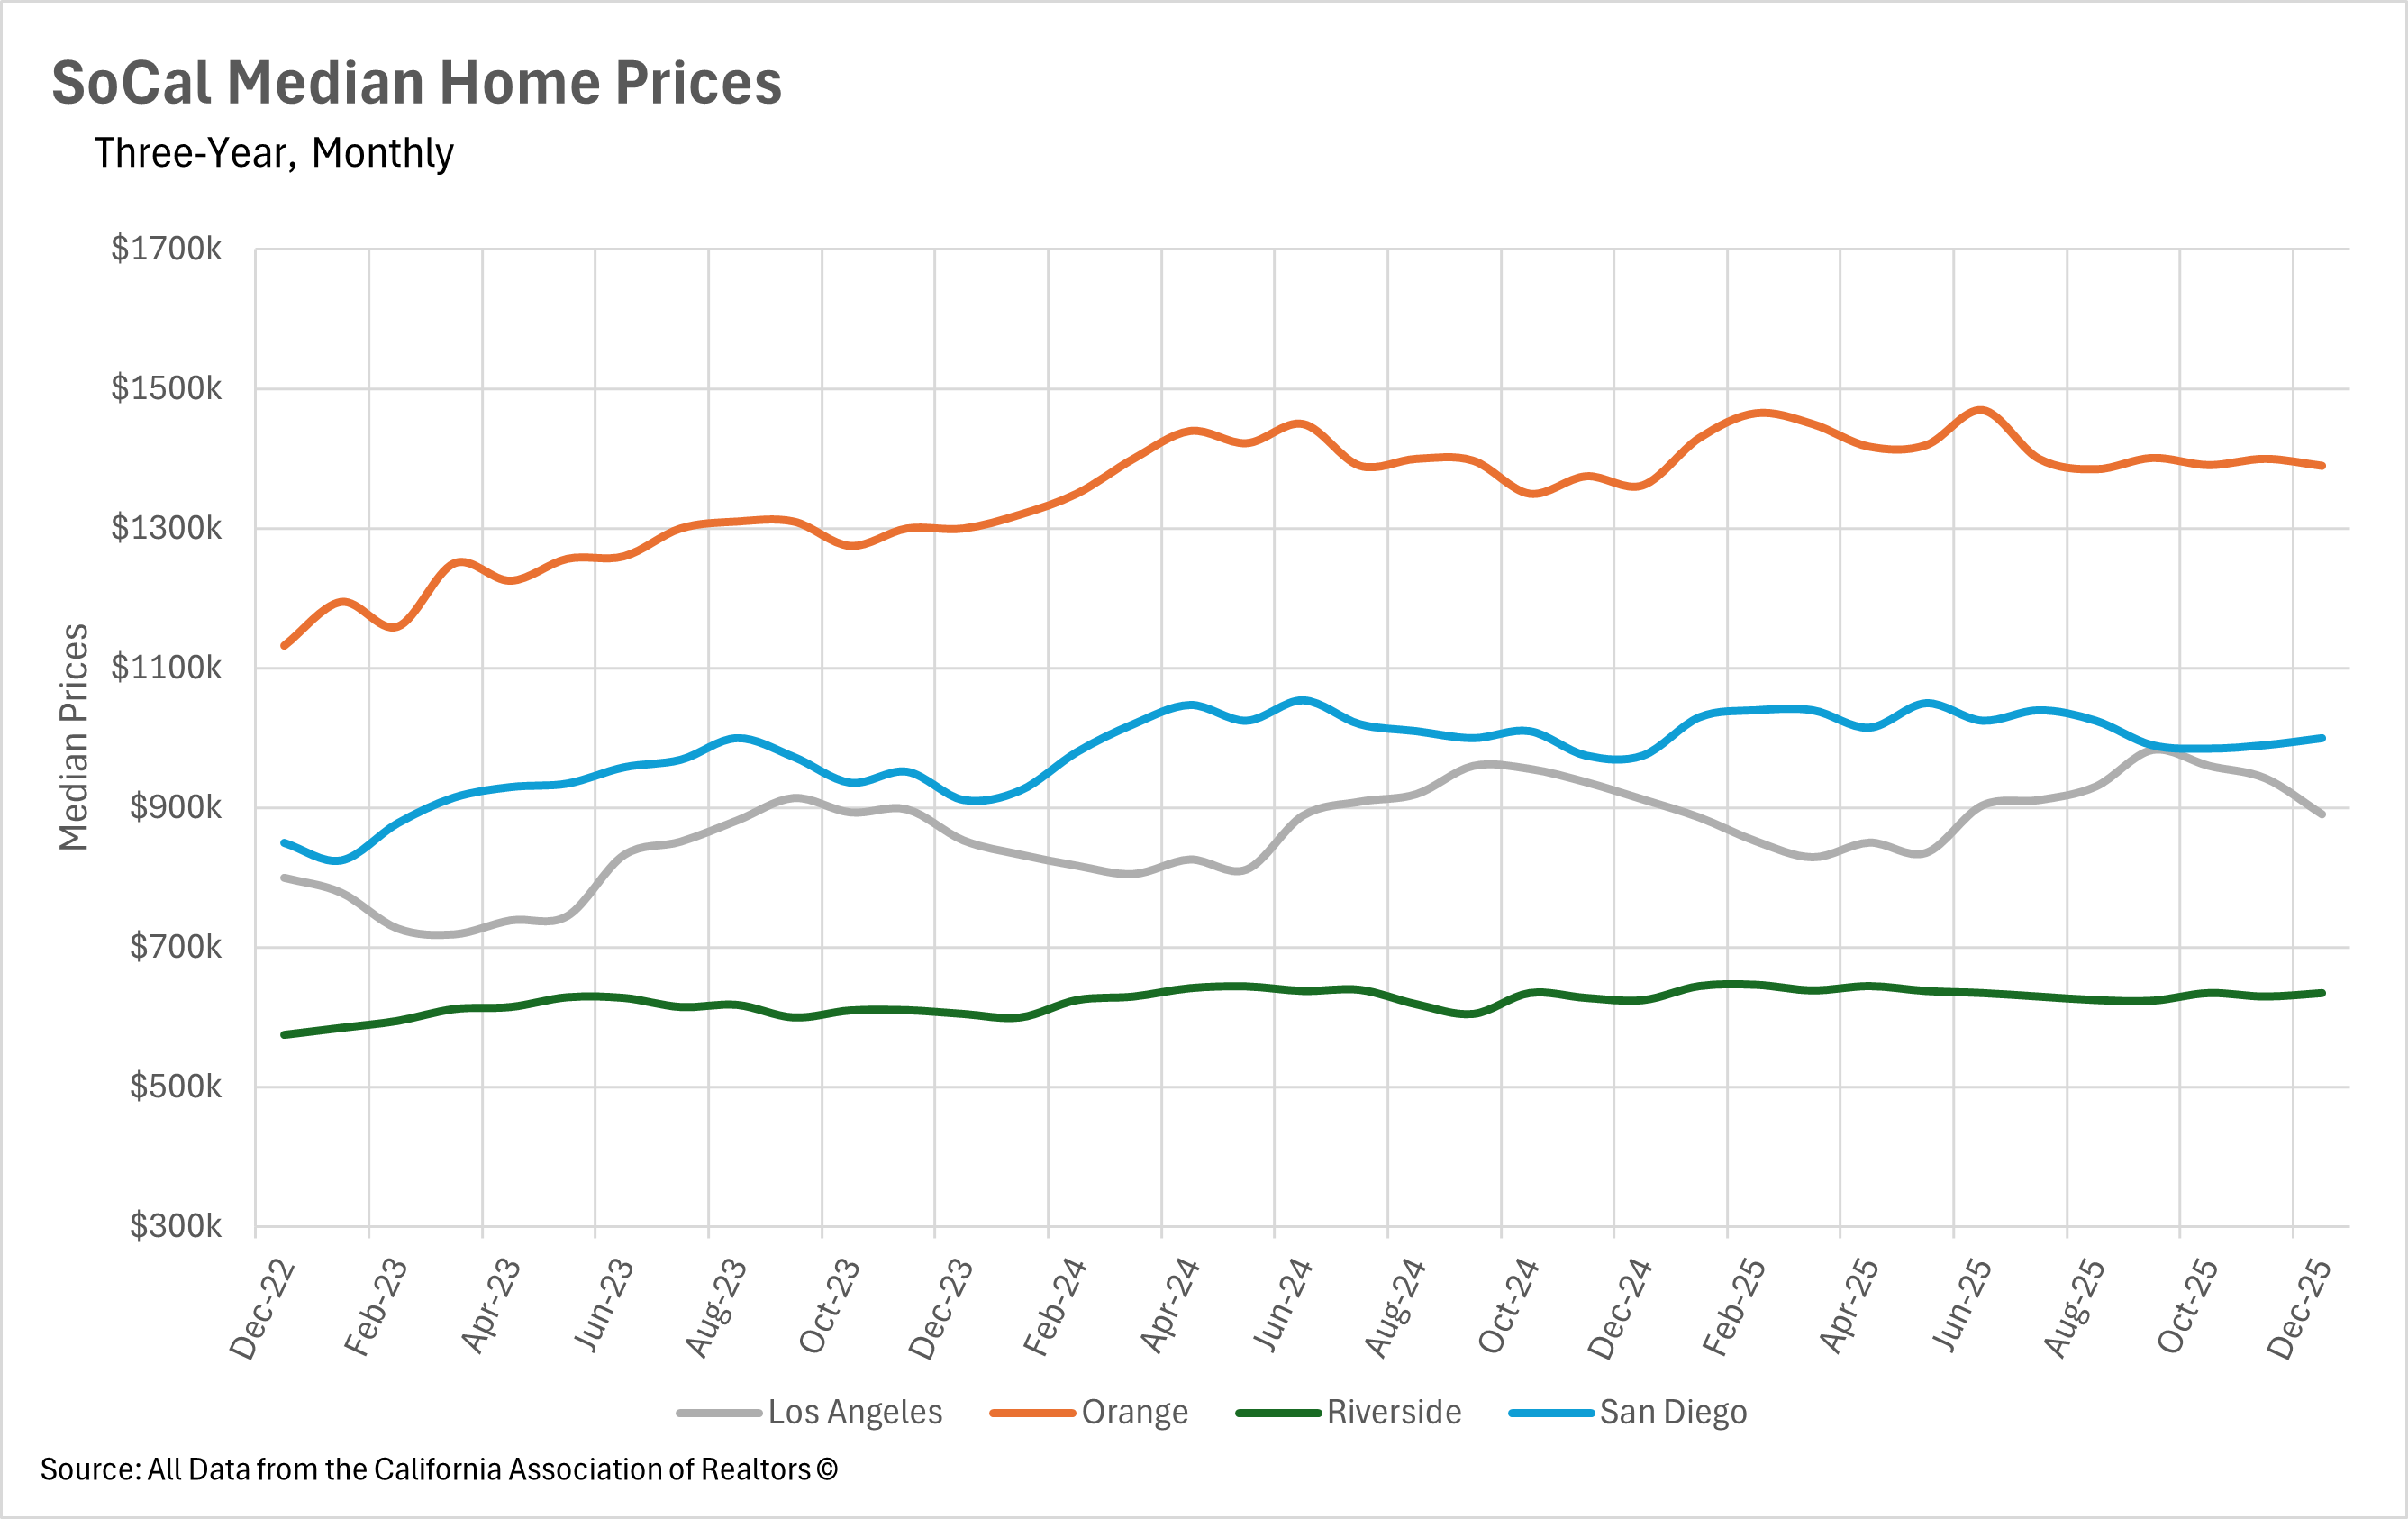
Southern California's housing markets finished 2025 on a largely positive note, with three of the four major markets posting year-over-year gains in December. San Diego led the way with a 2.56% increase, pushing the median sale price back above the $1,000,000 threshold to close at exactly $1,000,000. Orange County followed closely behind with a 2.06% gain, bringing its median to $1,390,000. Riverside also saw modest appreciation, with the median single-family home selling for $635,000, representing a 1.63% year-over-year increase. The one exception was Los Angeles, which saw its first year-over-year decline in over a year, with the median sale price dropping 2.35% to $890,910. It's worth noting that this decline comes on the heels of a strong fall in Los Angeles, where the median sale price hit $983,230 in September before pulling back through the end of the year. While one month of decline doesn't necessarily signal a trend reversal, it's certainly something to keep an eye on as we head into 2026.
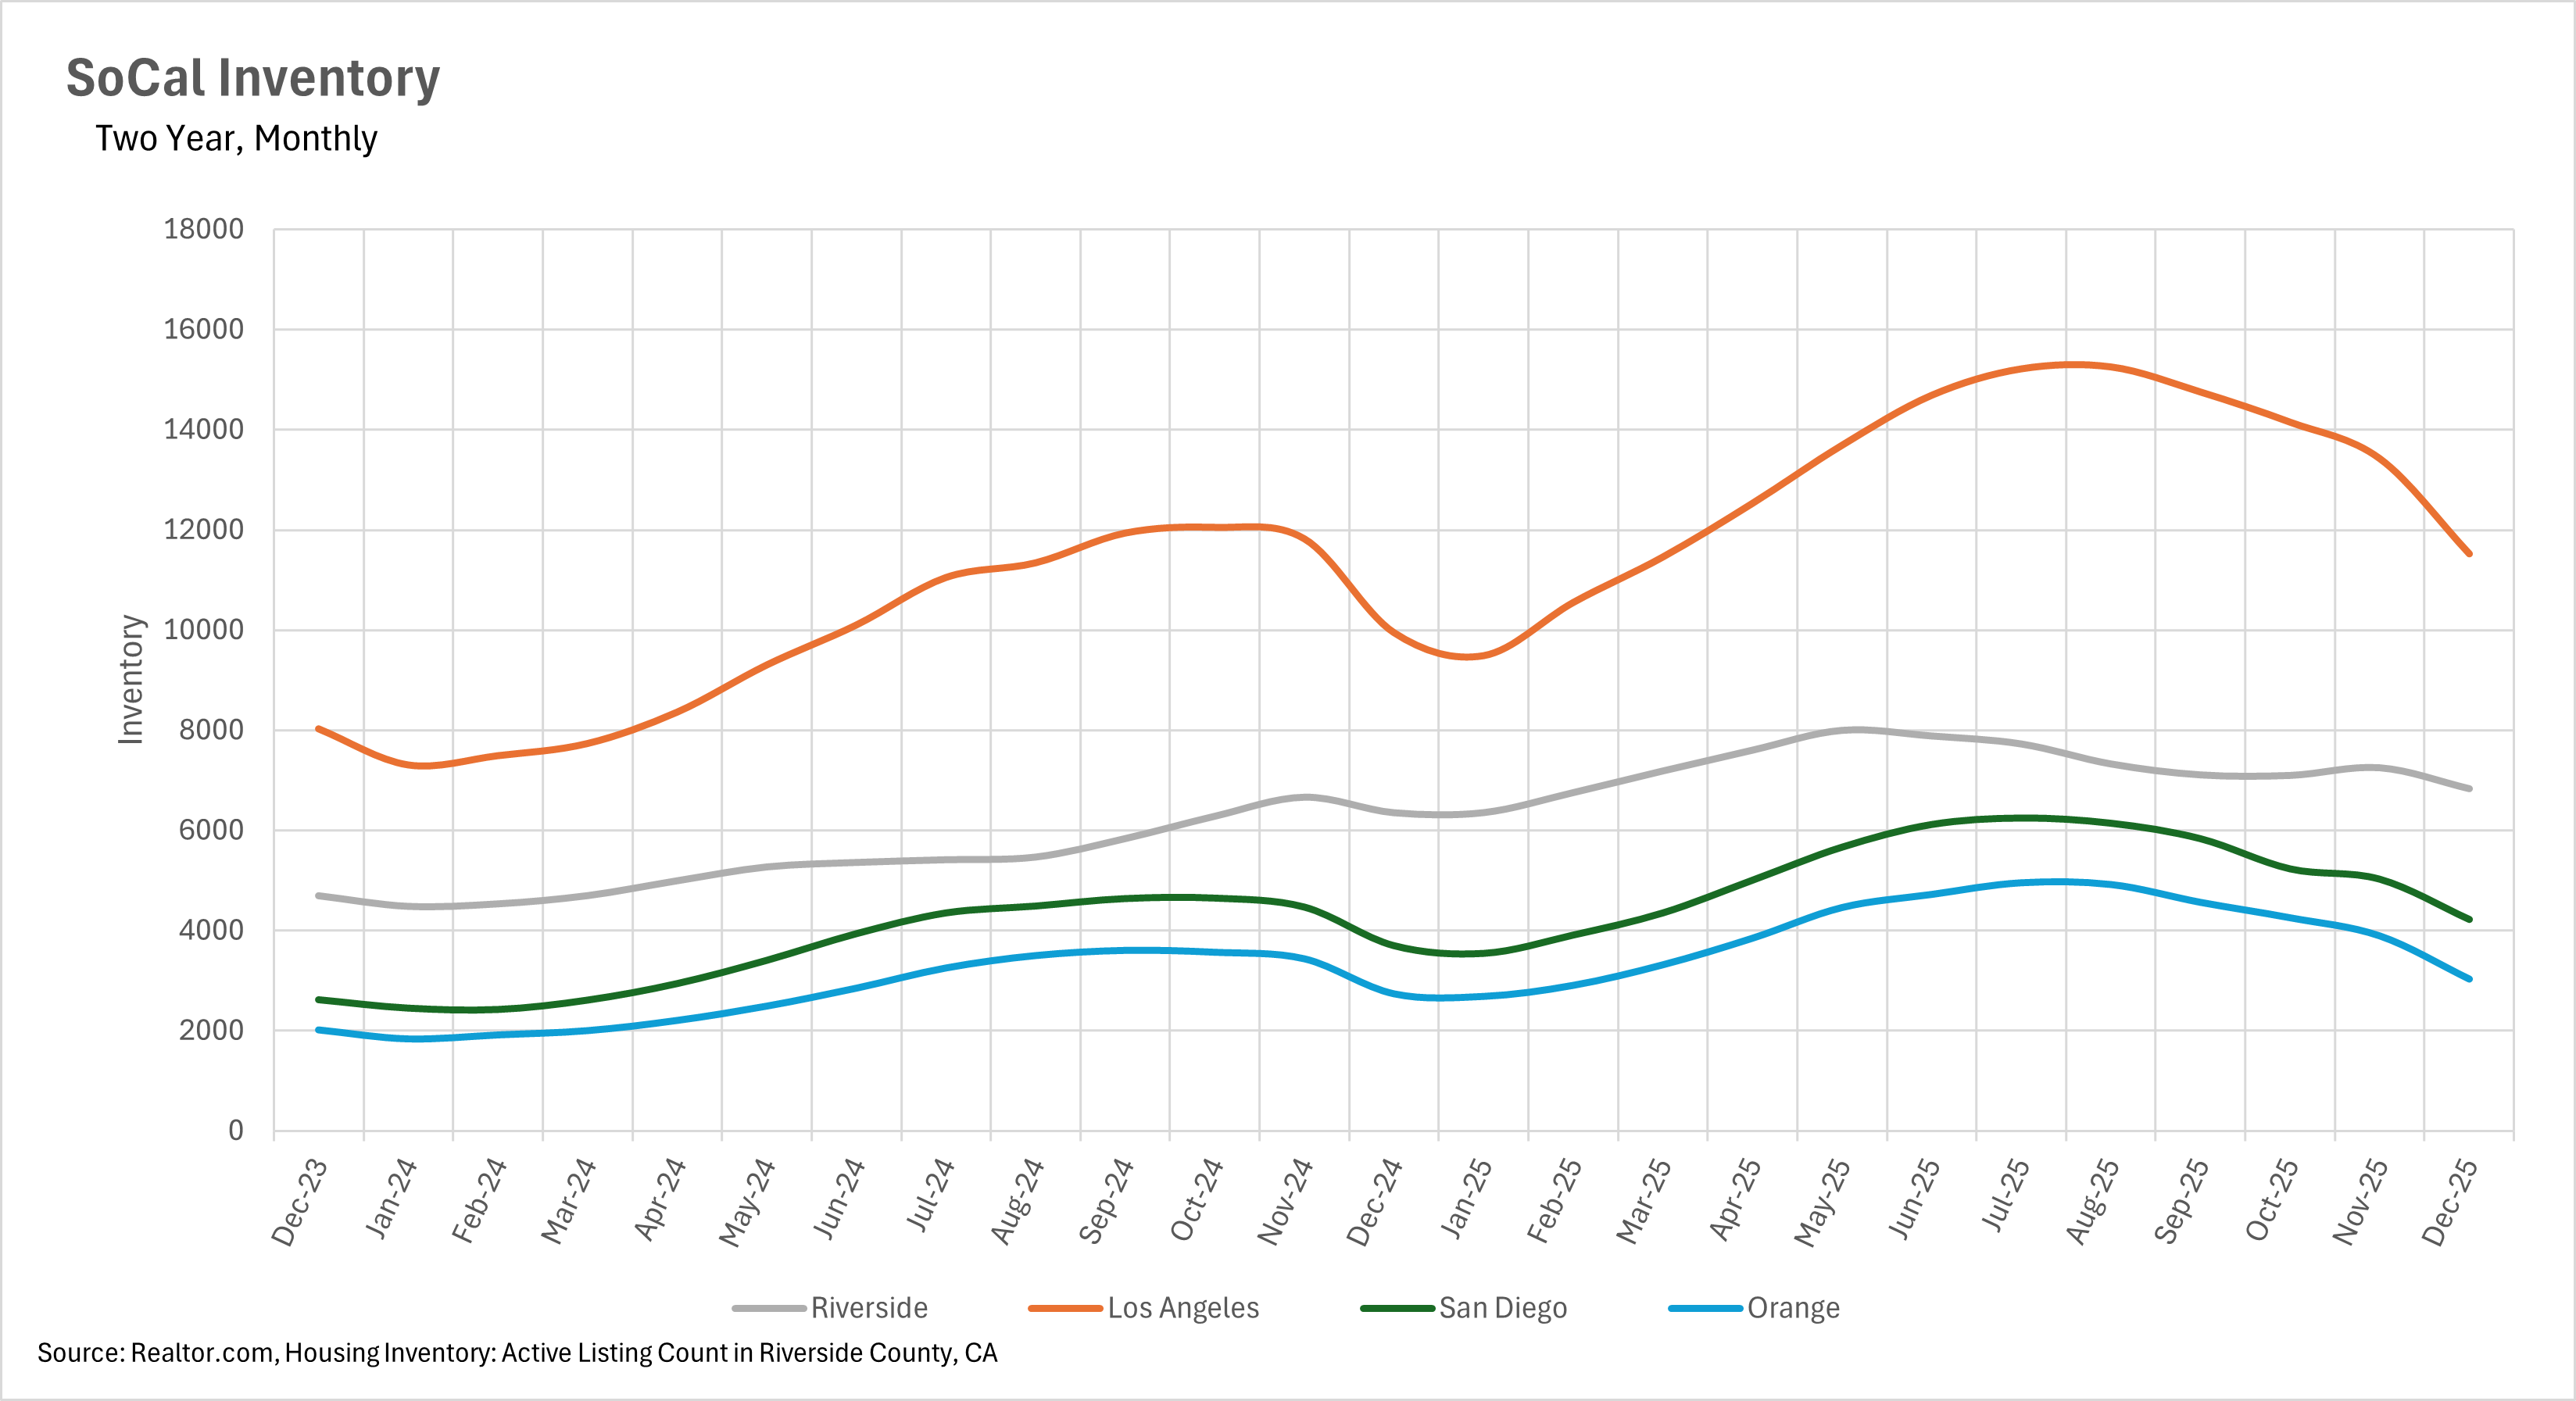
Throughout 2025, we saw inventory levels build substantially across Southern California, peaking over the summer months. However, as is typical heading into the winter, we've started to see that inventory pull back across the region. Orange County saw the most dramatic month-over-month decline at 22.19%, bringing active listings down to 3,027. San Diego and Los Angeles followed with declines of 15.98% and 14.16%, respectively. That said, inventory remains elevated on a year-over-year basis across all four markets. Los Angeles still has 15.79% more listings than this time last year, followed by San Diego at 14.17%, Riverside at 12.94%, and Orange County at 10.80%. This means that while the seasonal contraction is well underway, buyers still have considerably more options than they did at this point in 2024.
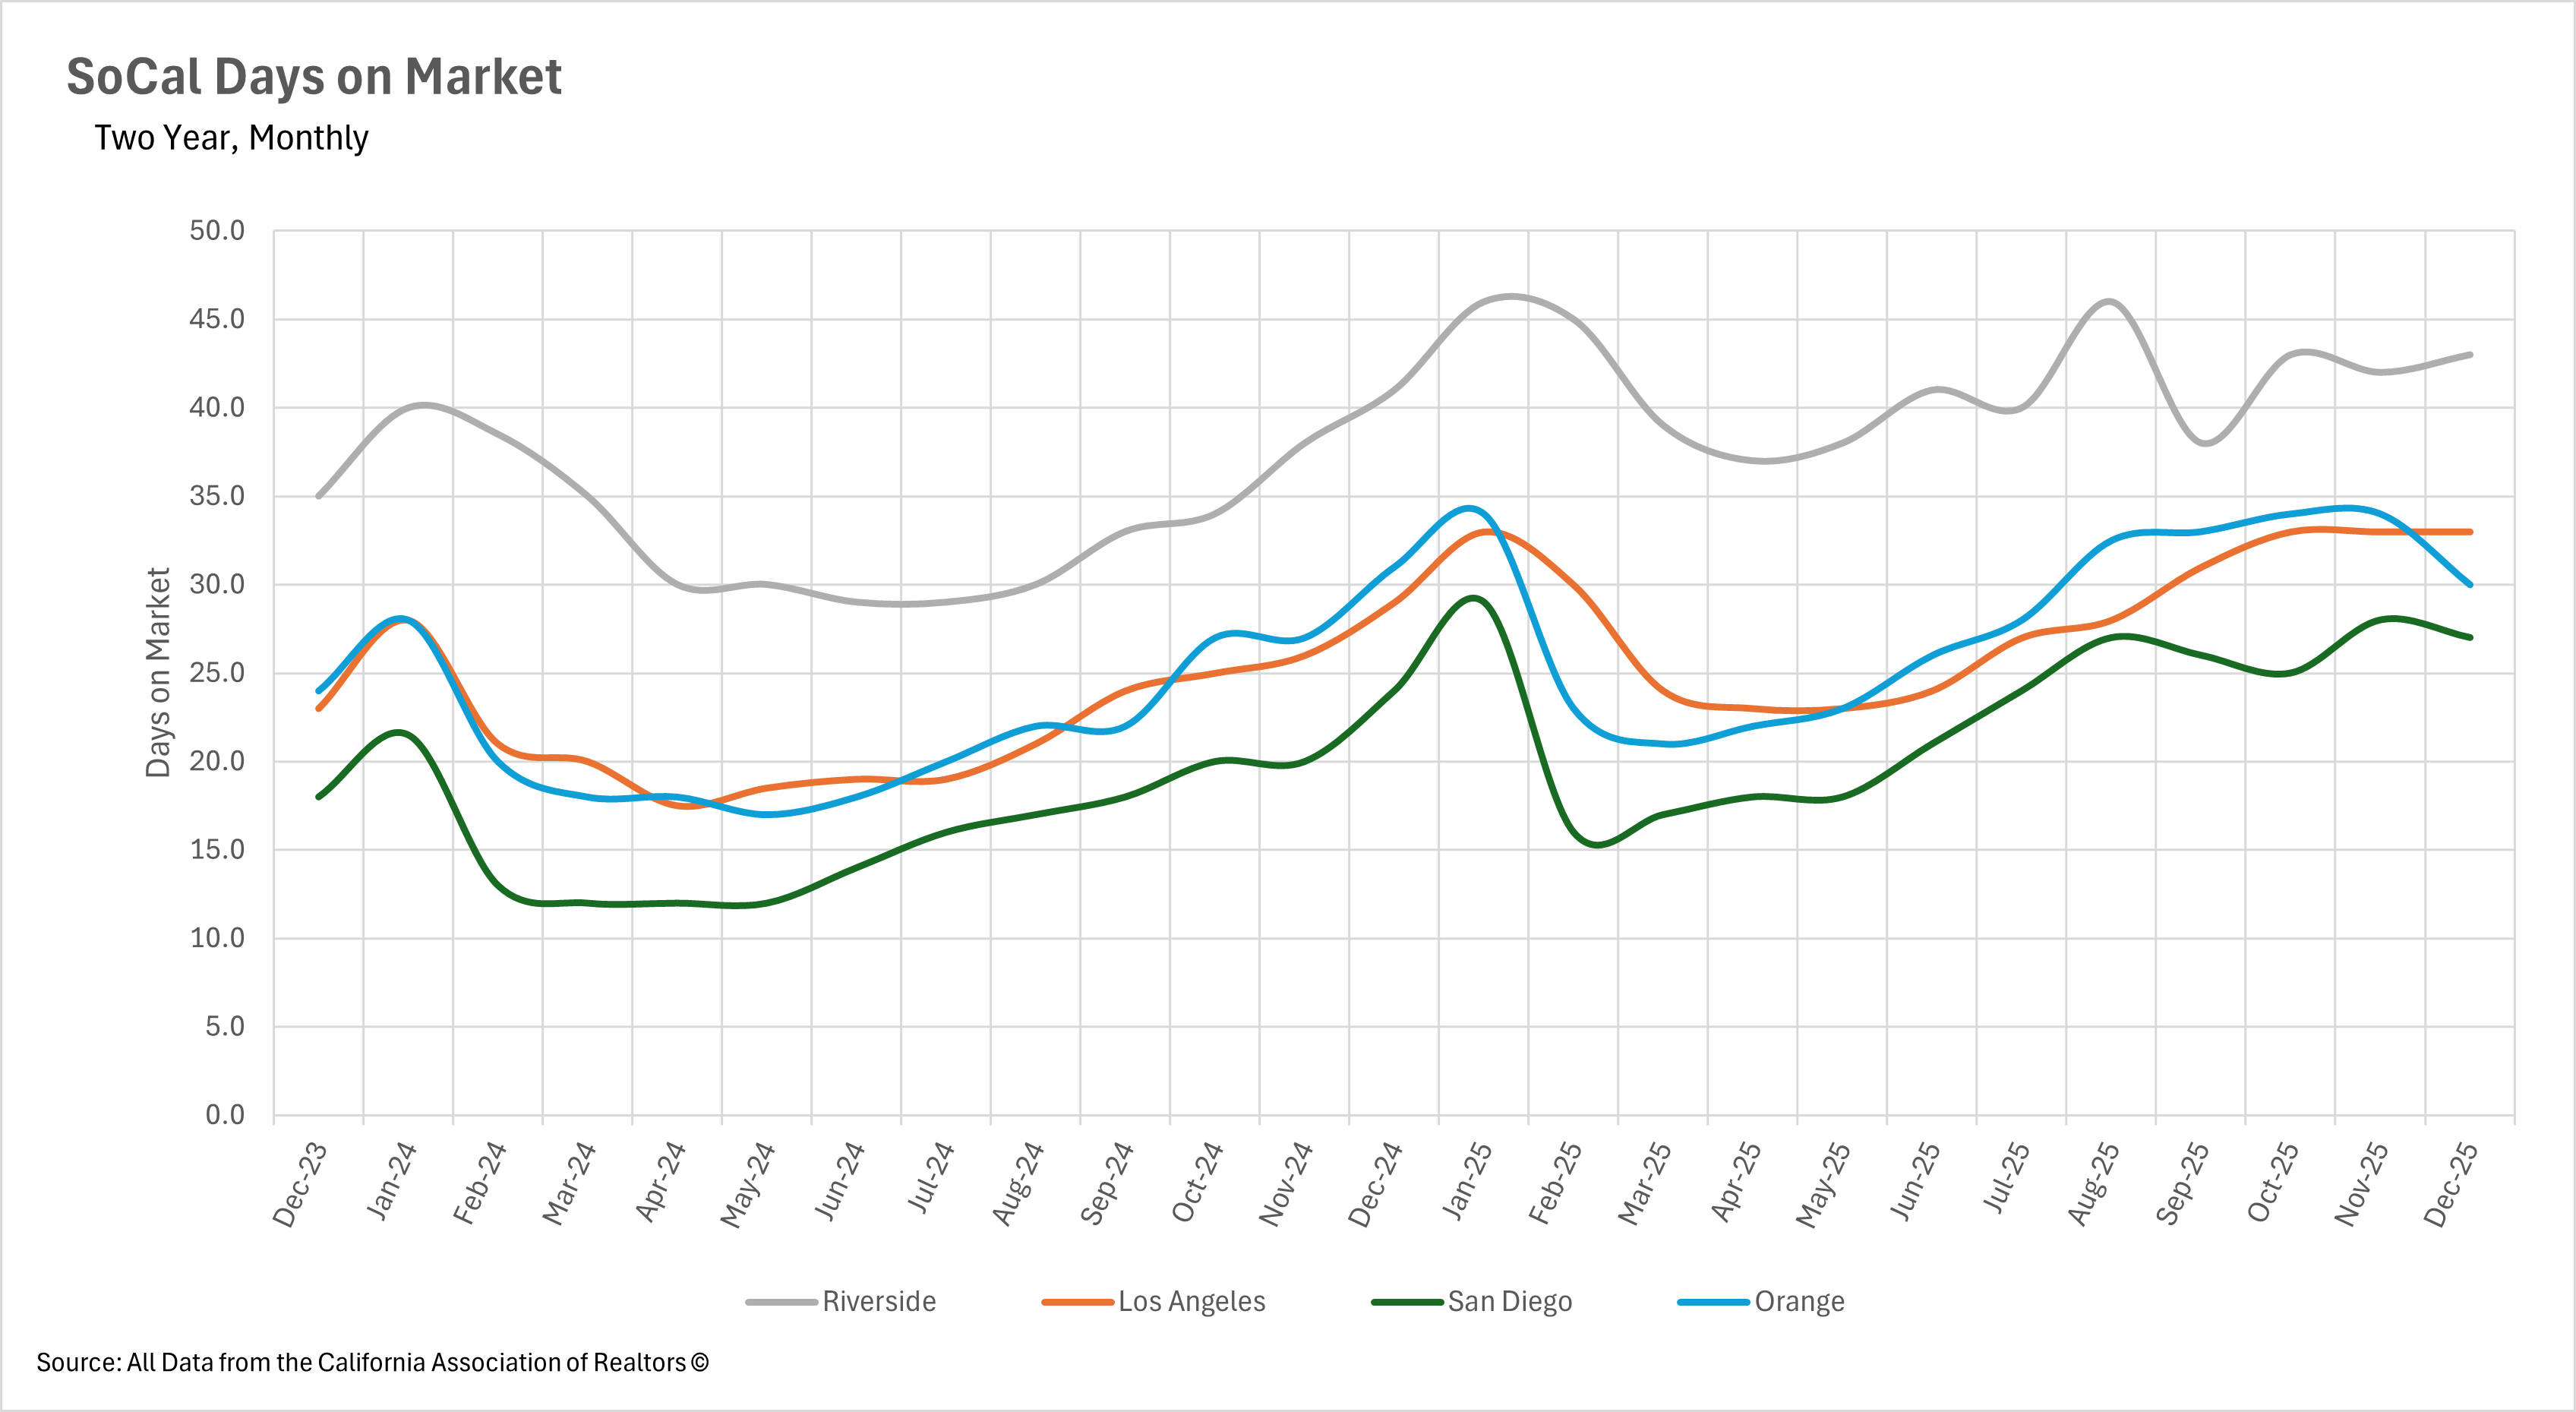
The amount of time listings are spending on the market varies quite a bit depending on where you look in Southern California. Riverside continues to see the longest selling times, with the median listing sitting for 43 days, representing a 26.47% increase on a year-over-year basis. Los Angeles is also seeing elevated market times at 33 days, up 13.79% from last year, though this figure has held steady for the past three months, suggesting the market may have found a near-term equilibrium. San Diego saw some improvement, with listings spending 27 days on the market, up 12.50% year-over-year but down 3.57% from November. In a somewhat surprising development given elevated inventory levels, Orange County actually saw days on market decrease slightly on a year-over-year basis, with listings spending just 30 days on the market, a 3.23% improvement compared to December 2024.
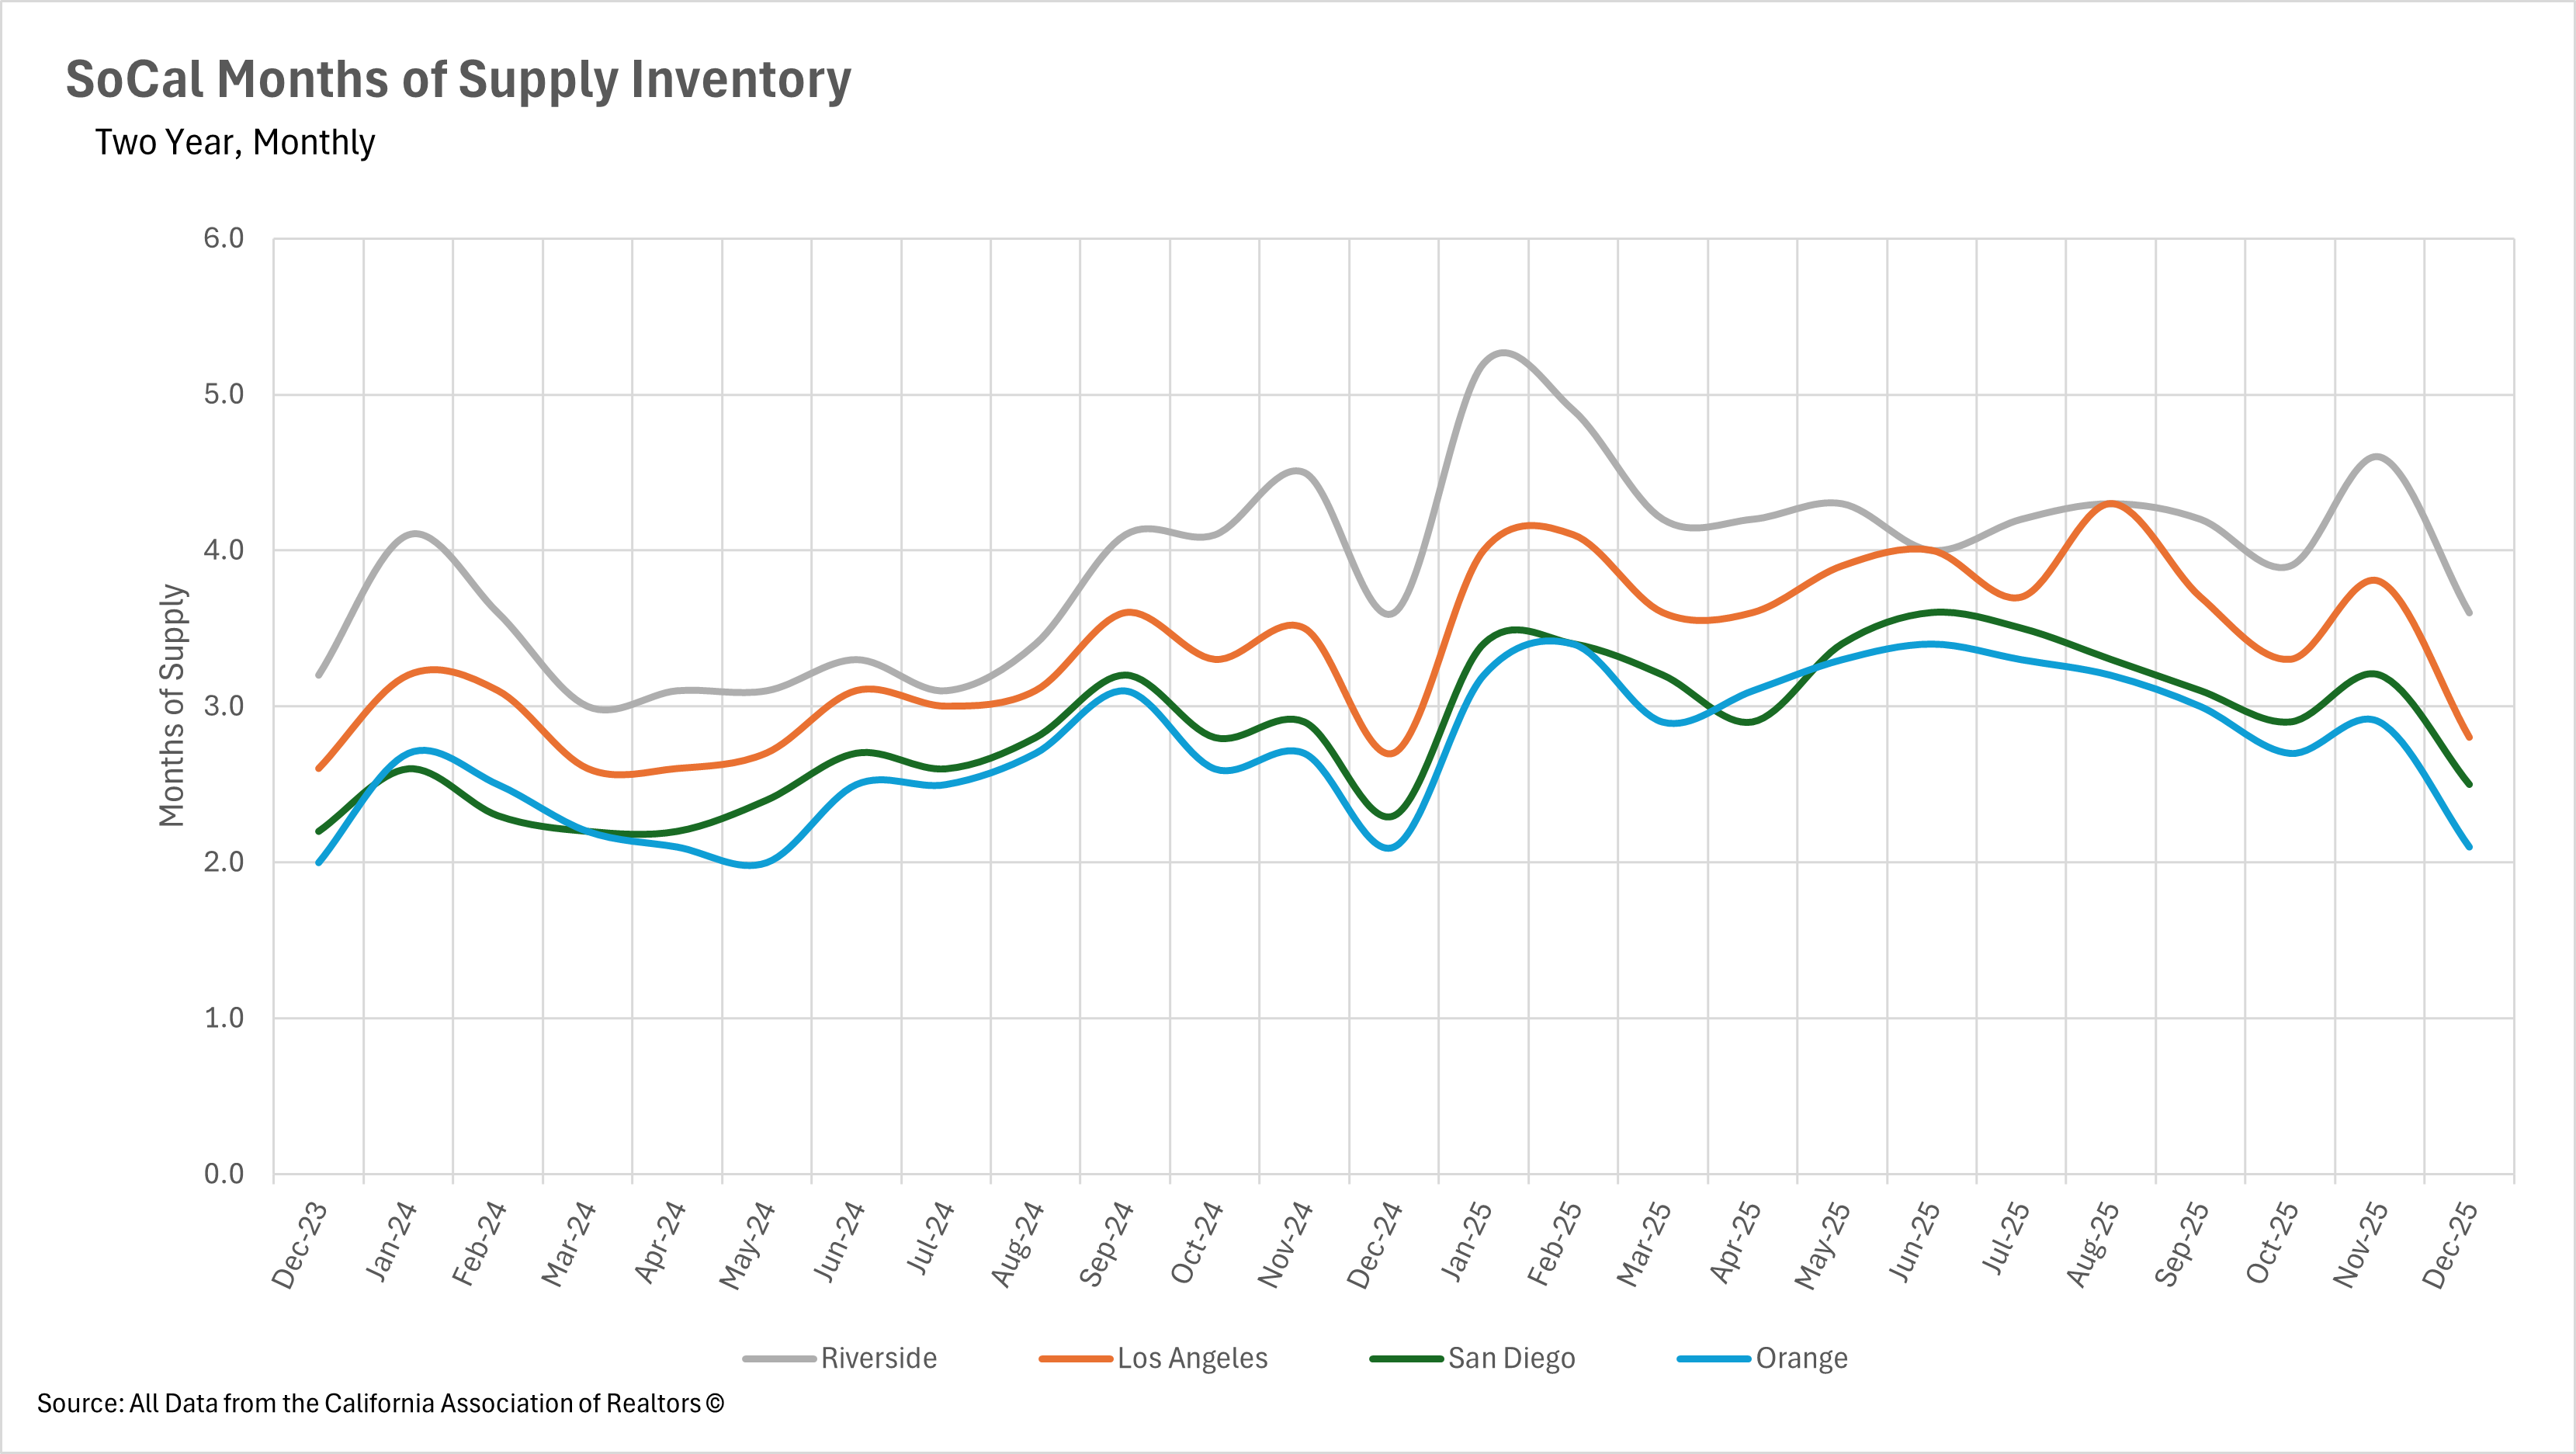
When determining whether a market is a buyers' market or a sellers' market, we look to the Months of Supply Inventory (MSI) metric. The state of California has historically averaged around three months of MSI, so any area with at or around three months of MSI is considered a balanced market. Any market that has lower than three months of MSI is considered a seller's market, whereas markets with more than three months of MSI are considered buyers' markets.
After spending a good portion of 2025 in buyers' market or balanced market territory, the coastal and metro markets of Southern California have shifted decisively back into seller's market territory as we close out the year. Orange County leads the way with just 2.1 months of supply, followed by San Diego at 2.5 months and Los Angeles at 2.8 months. These figures represent substantial month-over-month declines, driven largely by the seasonal contraction in inventory. Riverside remains the outlier in the region, with 3.6 months of supply on the market, placing it in balanced to slight buyer's market territory. As we head into the spring selling season, it will be interesting to see whether these markets maintain their seller-friendly posture or swing back toward more balanced conditions as new inventory enters the market.
Stay up to date on the latest real estate trends.

July 2026

A Closer Look at Dallas Rental Prices, Hidden Costs, and What Renters Need to Know Before Moving
June 2026

May 2026

April 2026
March 2026

February 2026
January 2026

Trusted Experts in the Palisades, Santa Monica, and Brentwood Real Estate Markets
You’ve got questions and we can’t wait to answer them.