Market Update Los Angeles

Note: You can find the charts & graphs for the Big Story at the end of the following section.
*National Association of REALTORS® data is released two months behind, so we estimate the most recent month’s data when possible and appropriate.
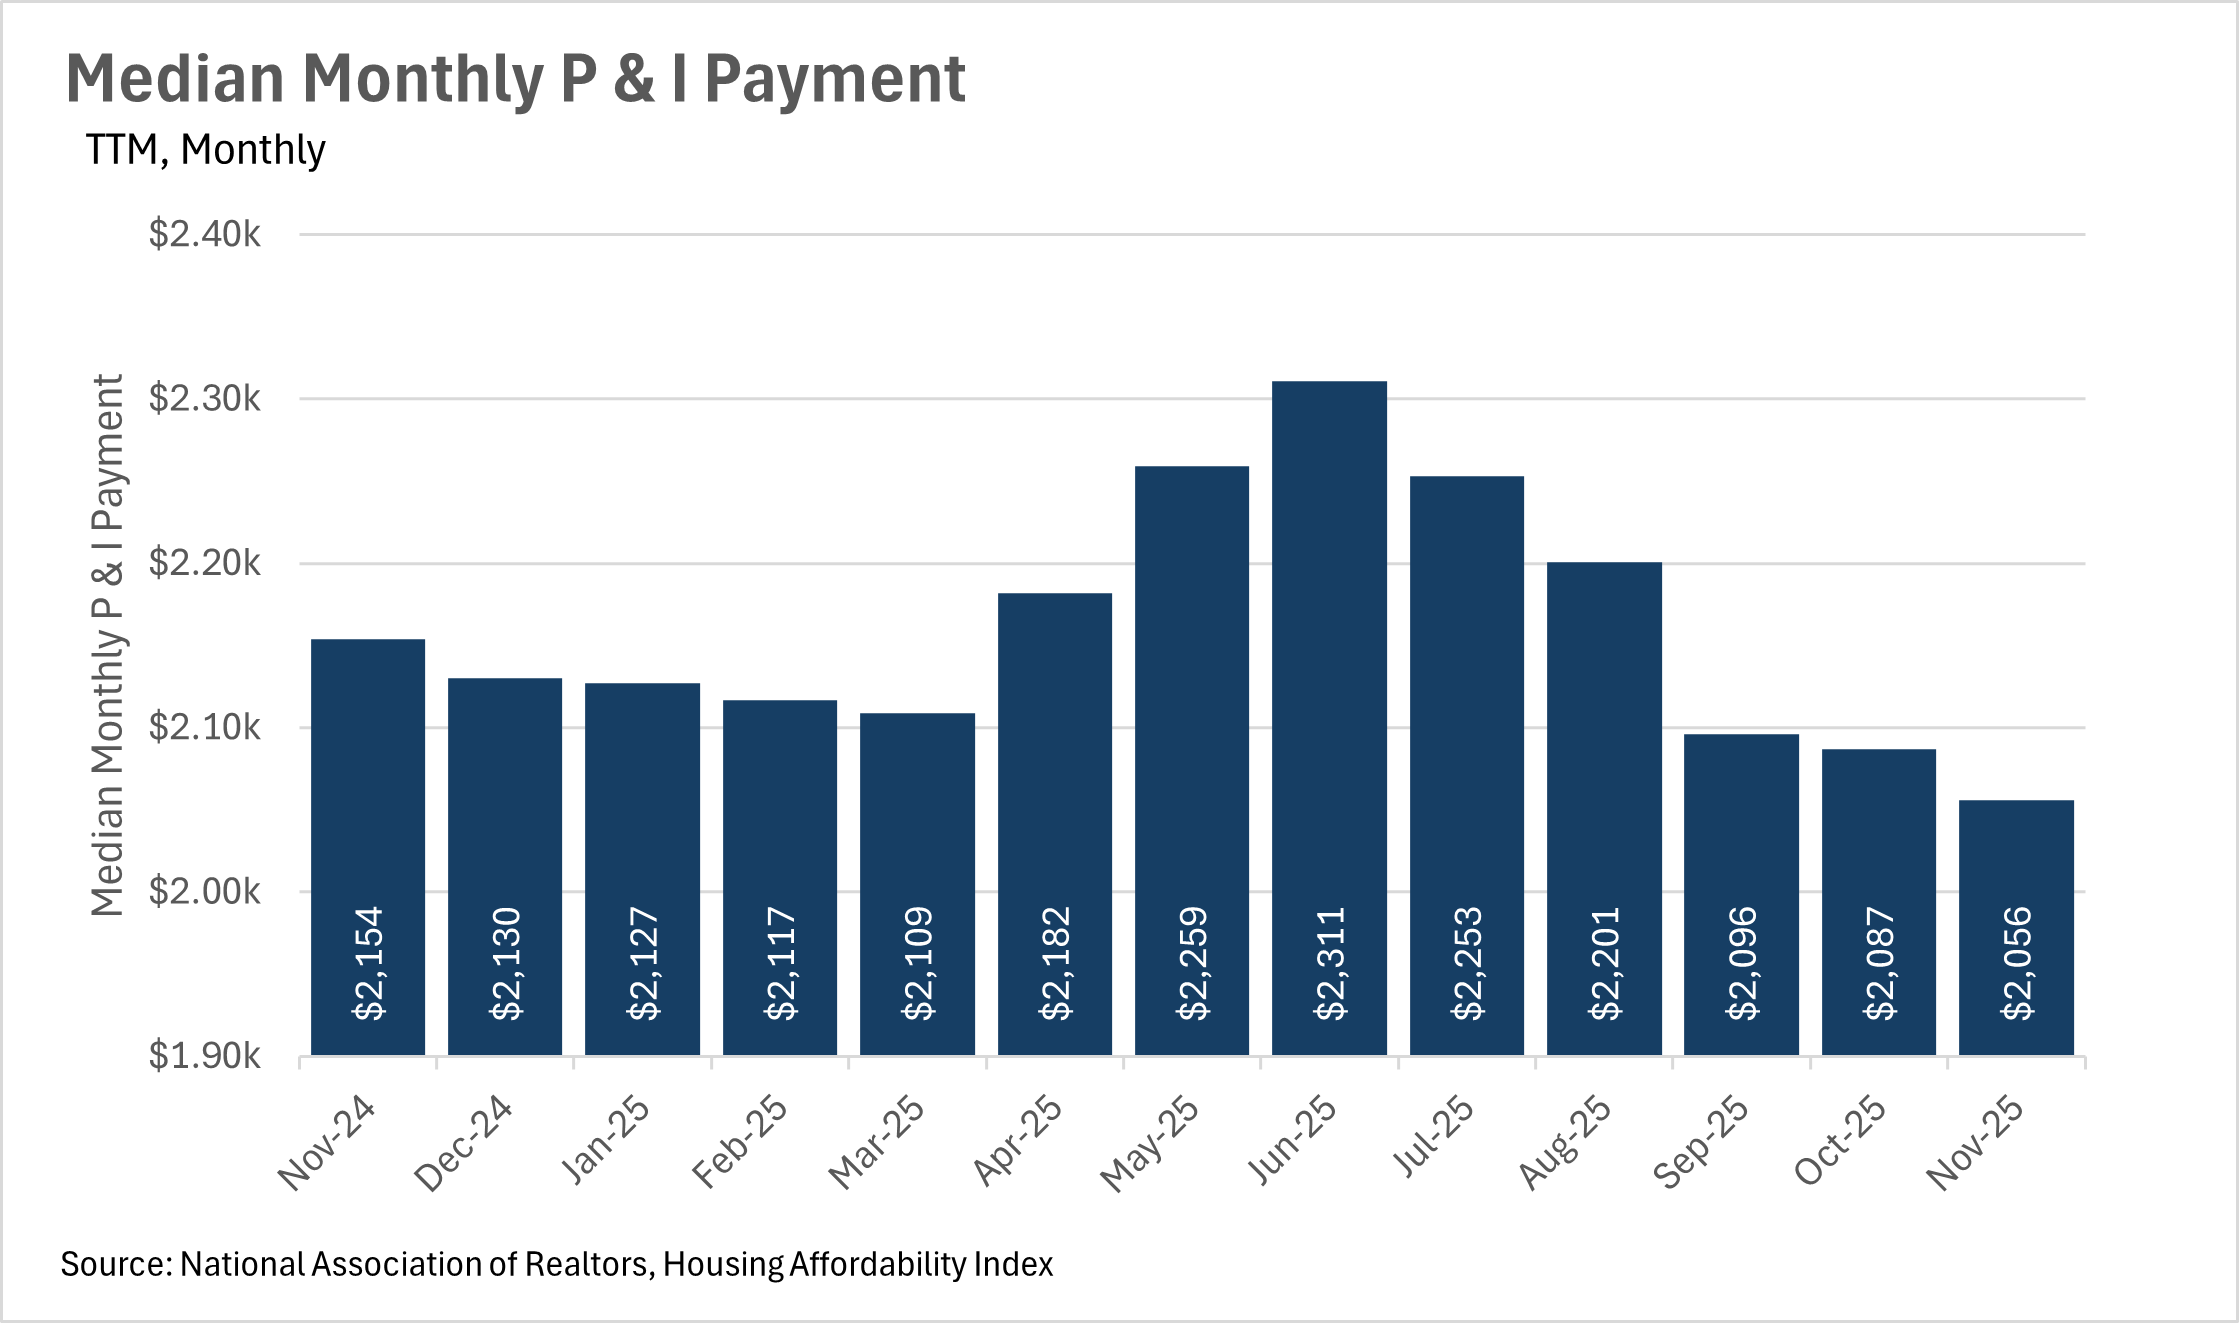
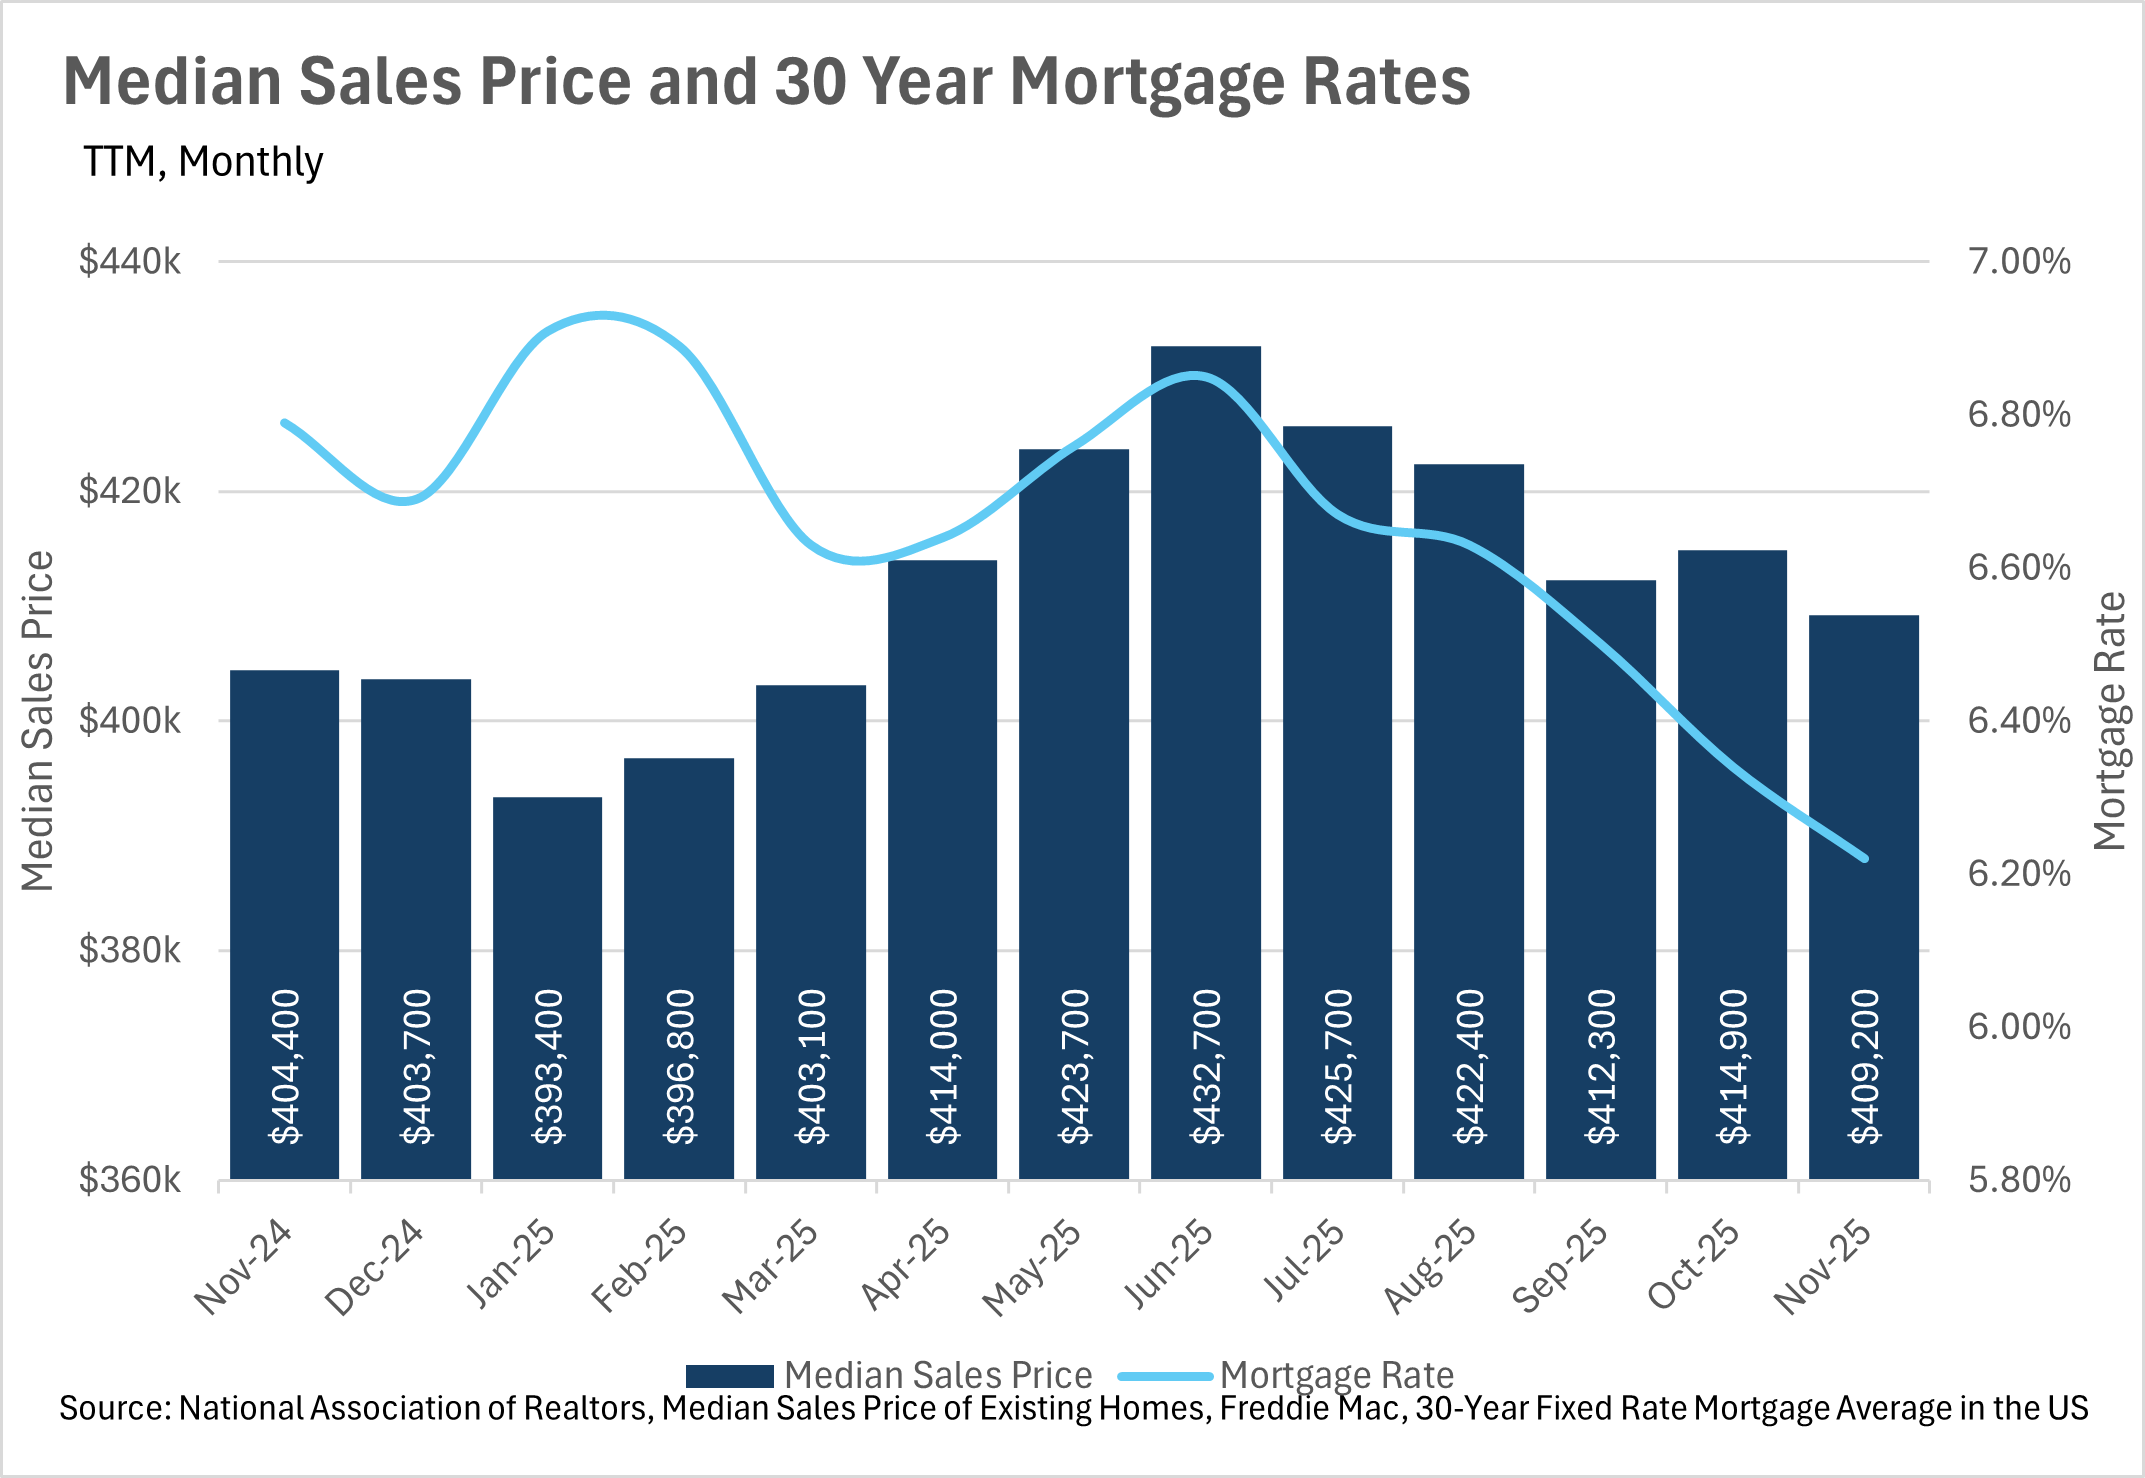
With the median monthly P&I payment hitting $2,056 in November, that marks a considerable decrease from the $2,311 maximum that we hit earlier in the year. As you might have guessed, this is largely due to interest rates declining, as the Federal Reserve continues its rate cutting cycle. In November of 2024, interest rates were at 6.79%, compared to 6.22% in November of 2025. This represents an 8.39% decrease in interest rates on a year-over-year basis, while the median sale price of a home in the US actually increased by 1.19% during that same period of time. As interest rates slowly creep down, we will likely see home values continue to increase, as the deciding factor for most people is not the total purchase amount, but instead the monthly payment that they can afford.
As we mentioned in the prior section, interest rates continue to creep lower and lower. We saw rates hit 6.22% in November, and have fallen even further since then. As of right now, the average interest rate for a 30 year, fixed rate mortgage is sitting around 6.06%, which is actually a slight increase from what we briefly saw last week. Unfortunately, some recent commentary from the Fed has led markets to believe we won’t see a rate cut as a result of the January FOMC meeting, as CME FedWatch puts the probability of a 25 bps cut at just 5% for January. However, it’ll be important to pay attention to the economic data that’s being released over the coming months, as it’ll give us a good idea of where we can expect rates to go in the near term future.
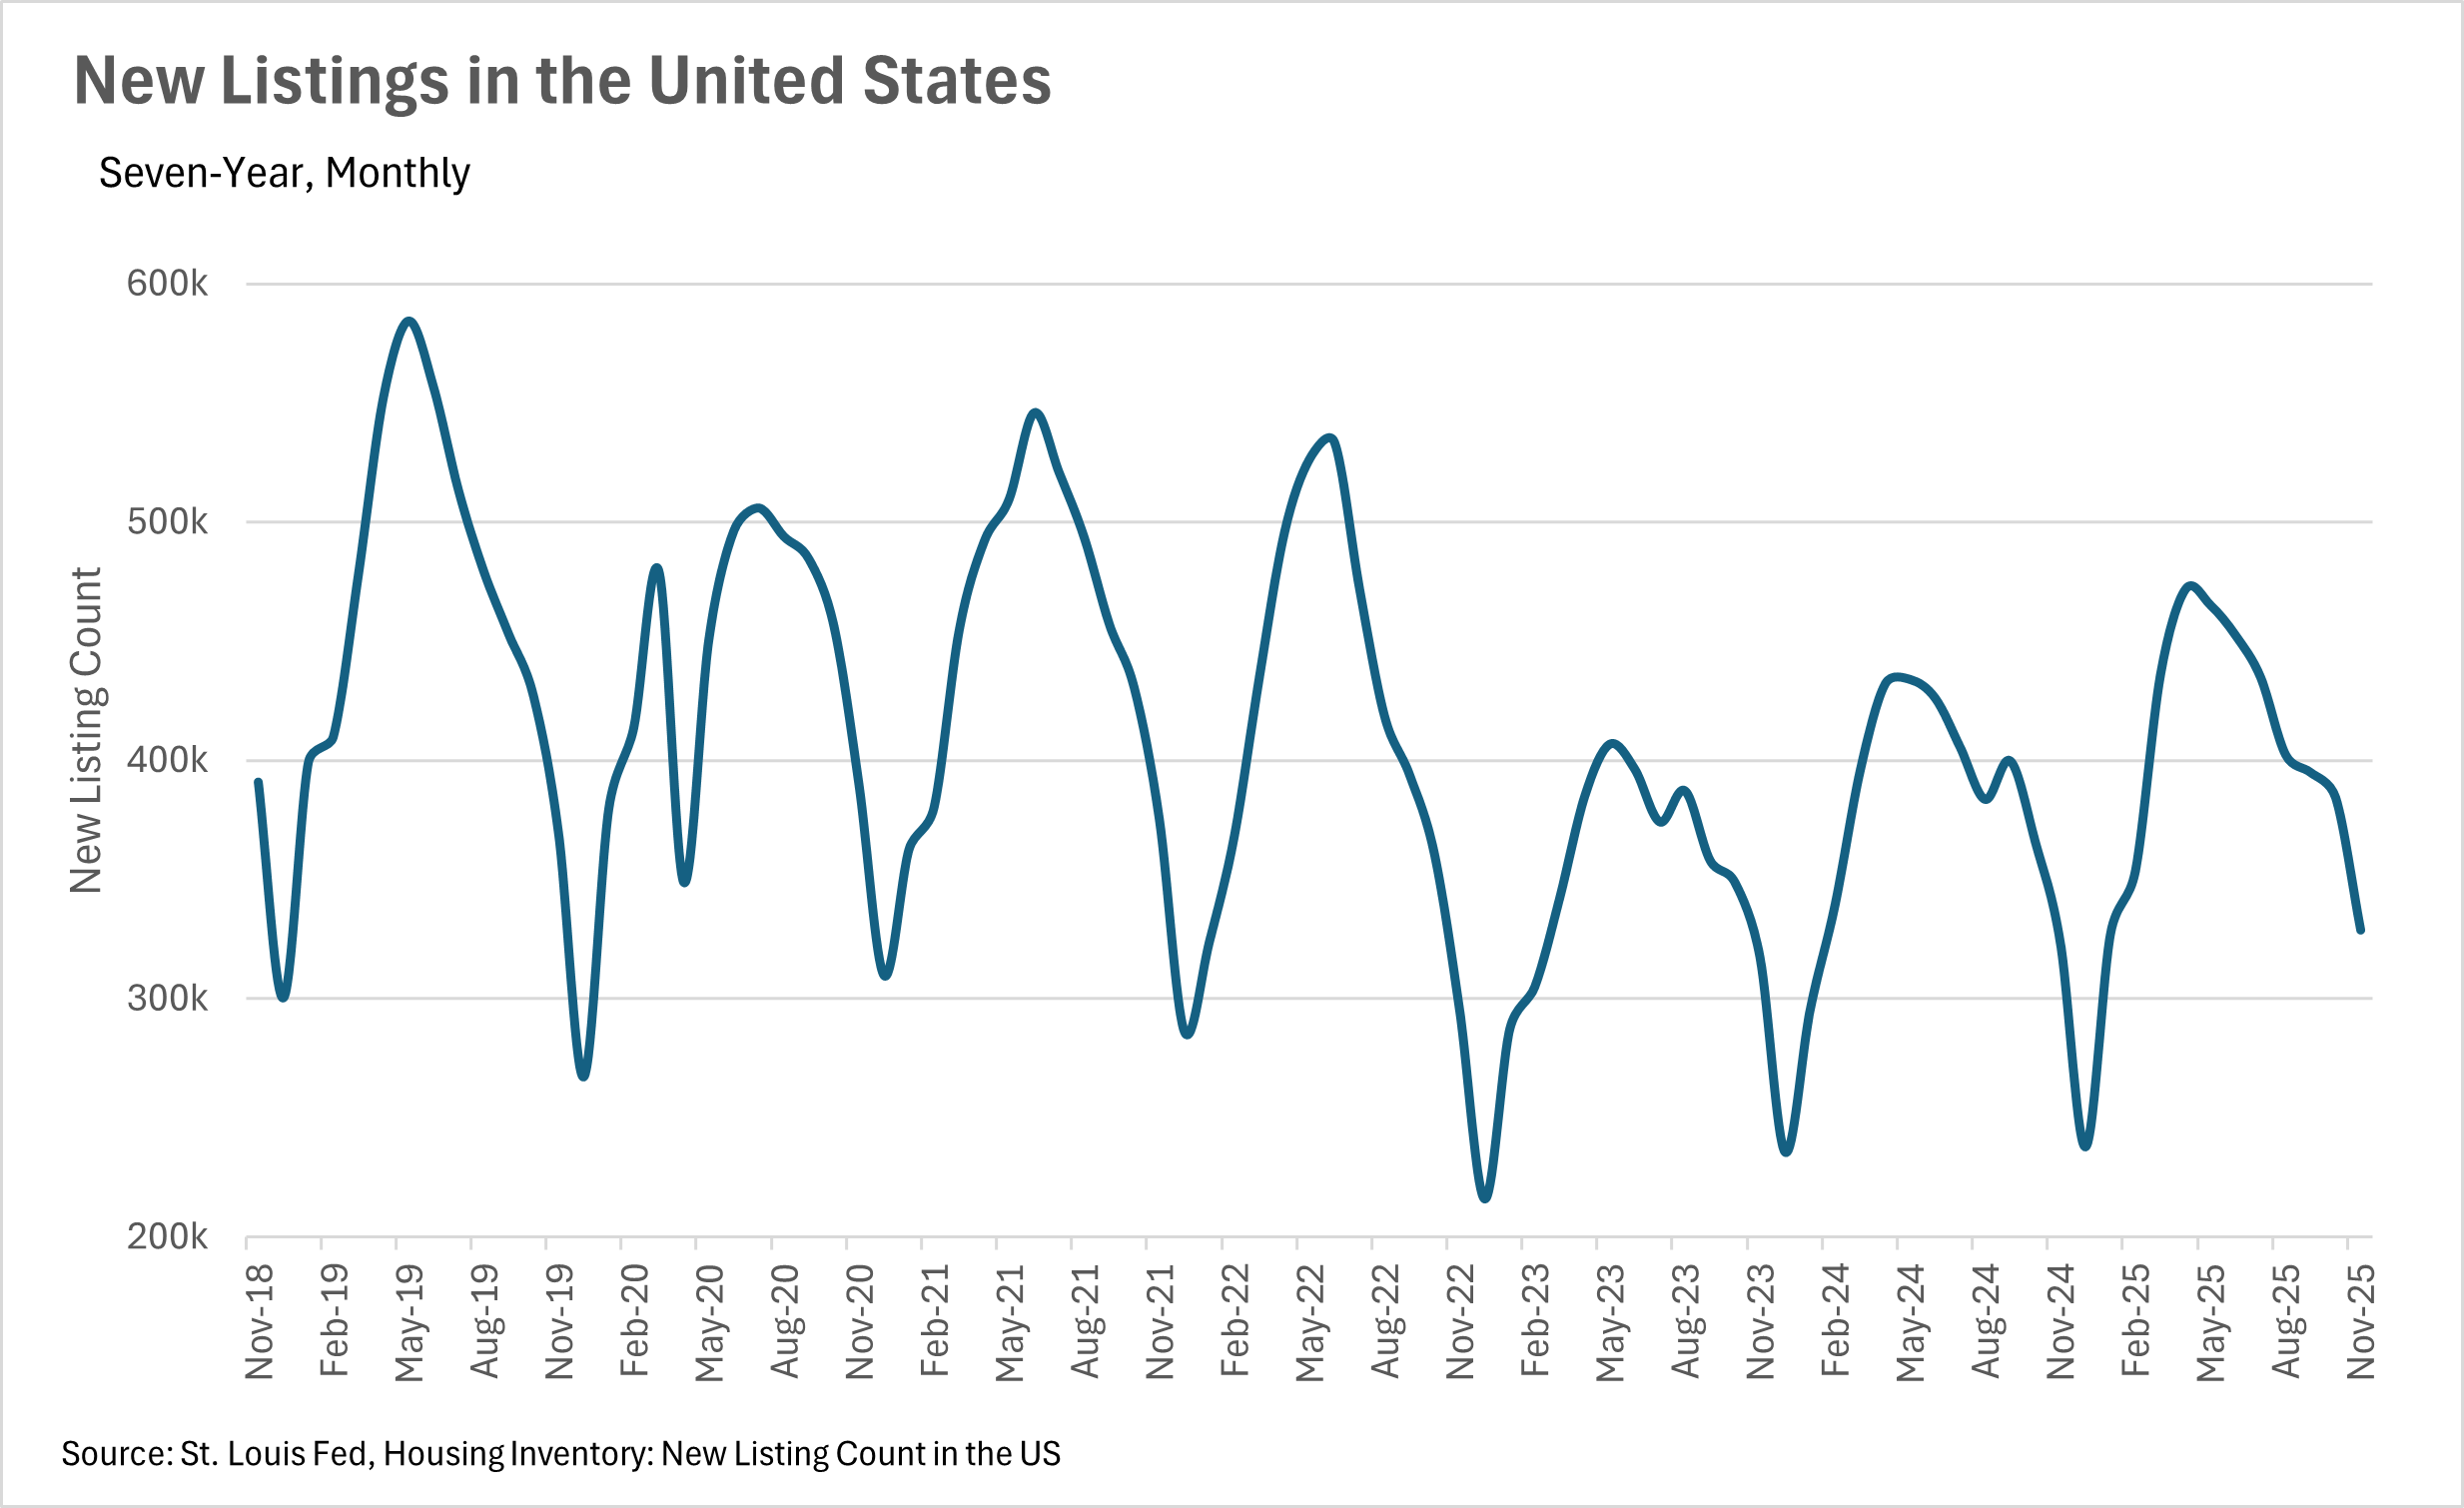
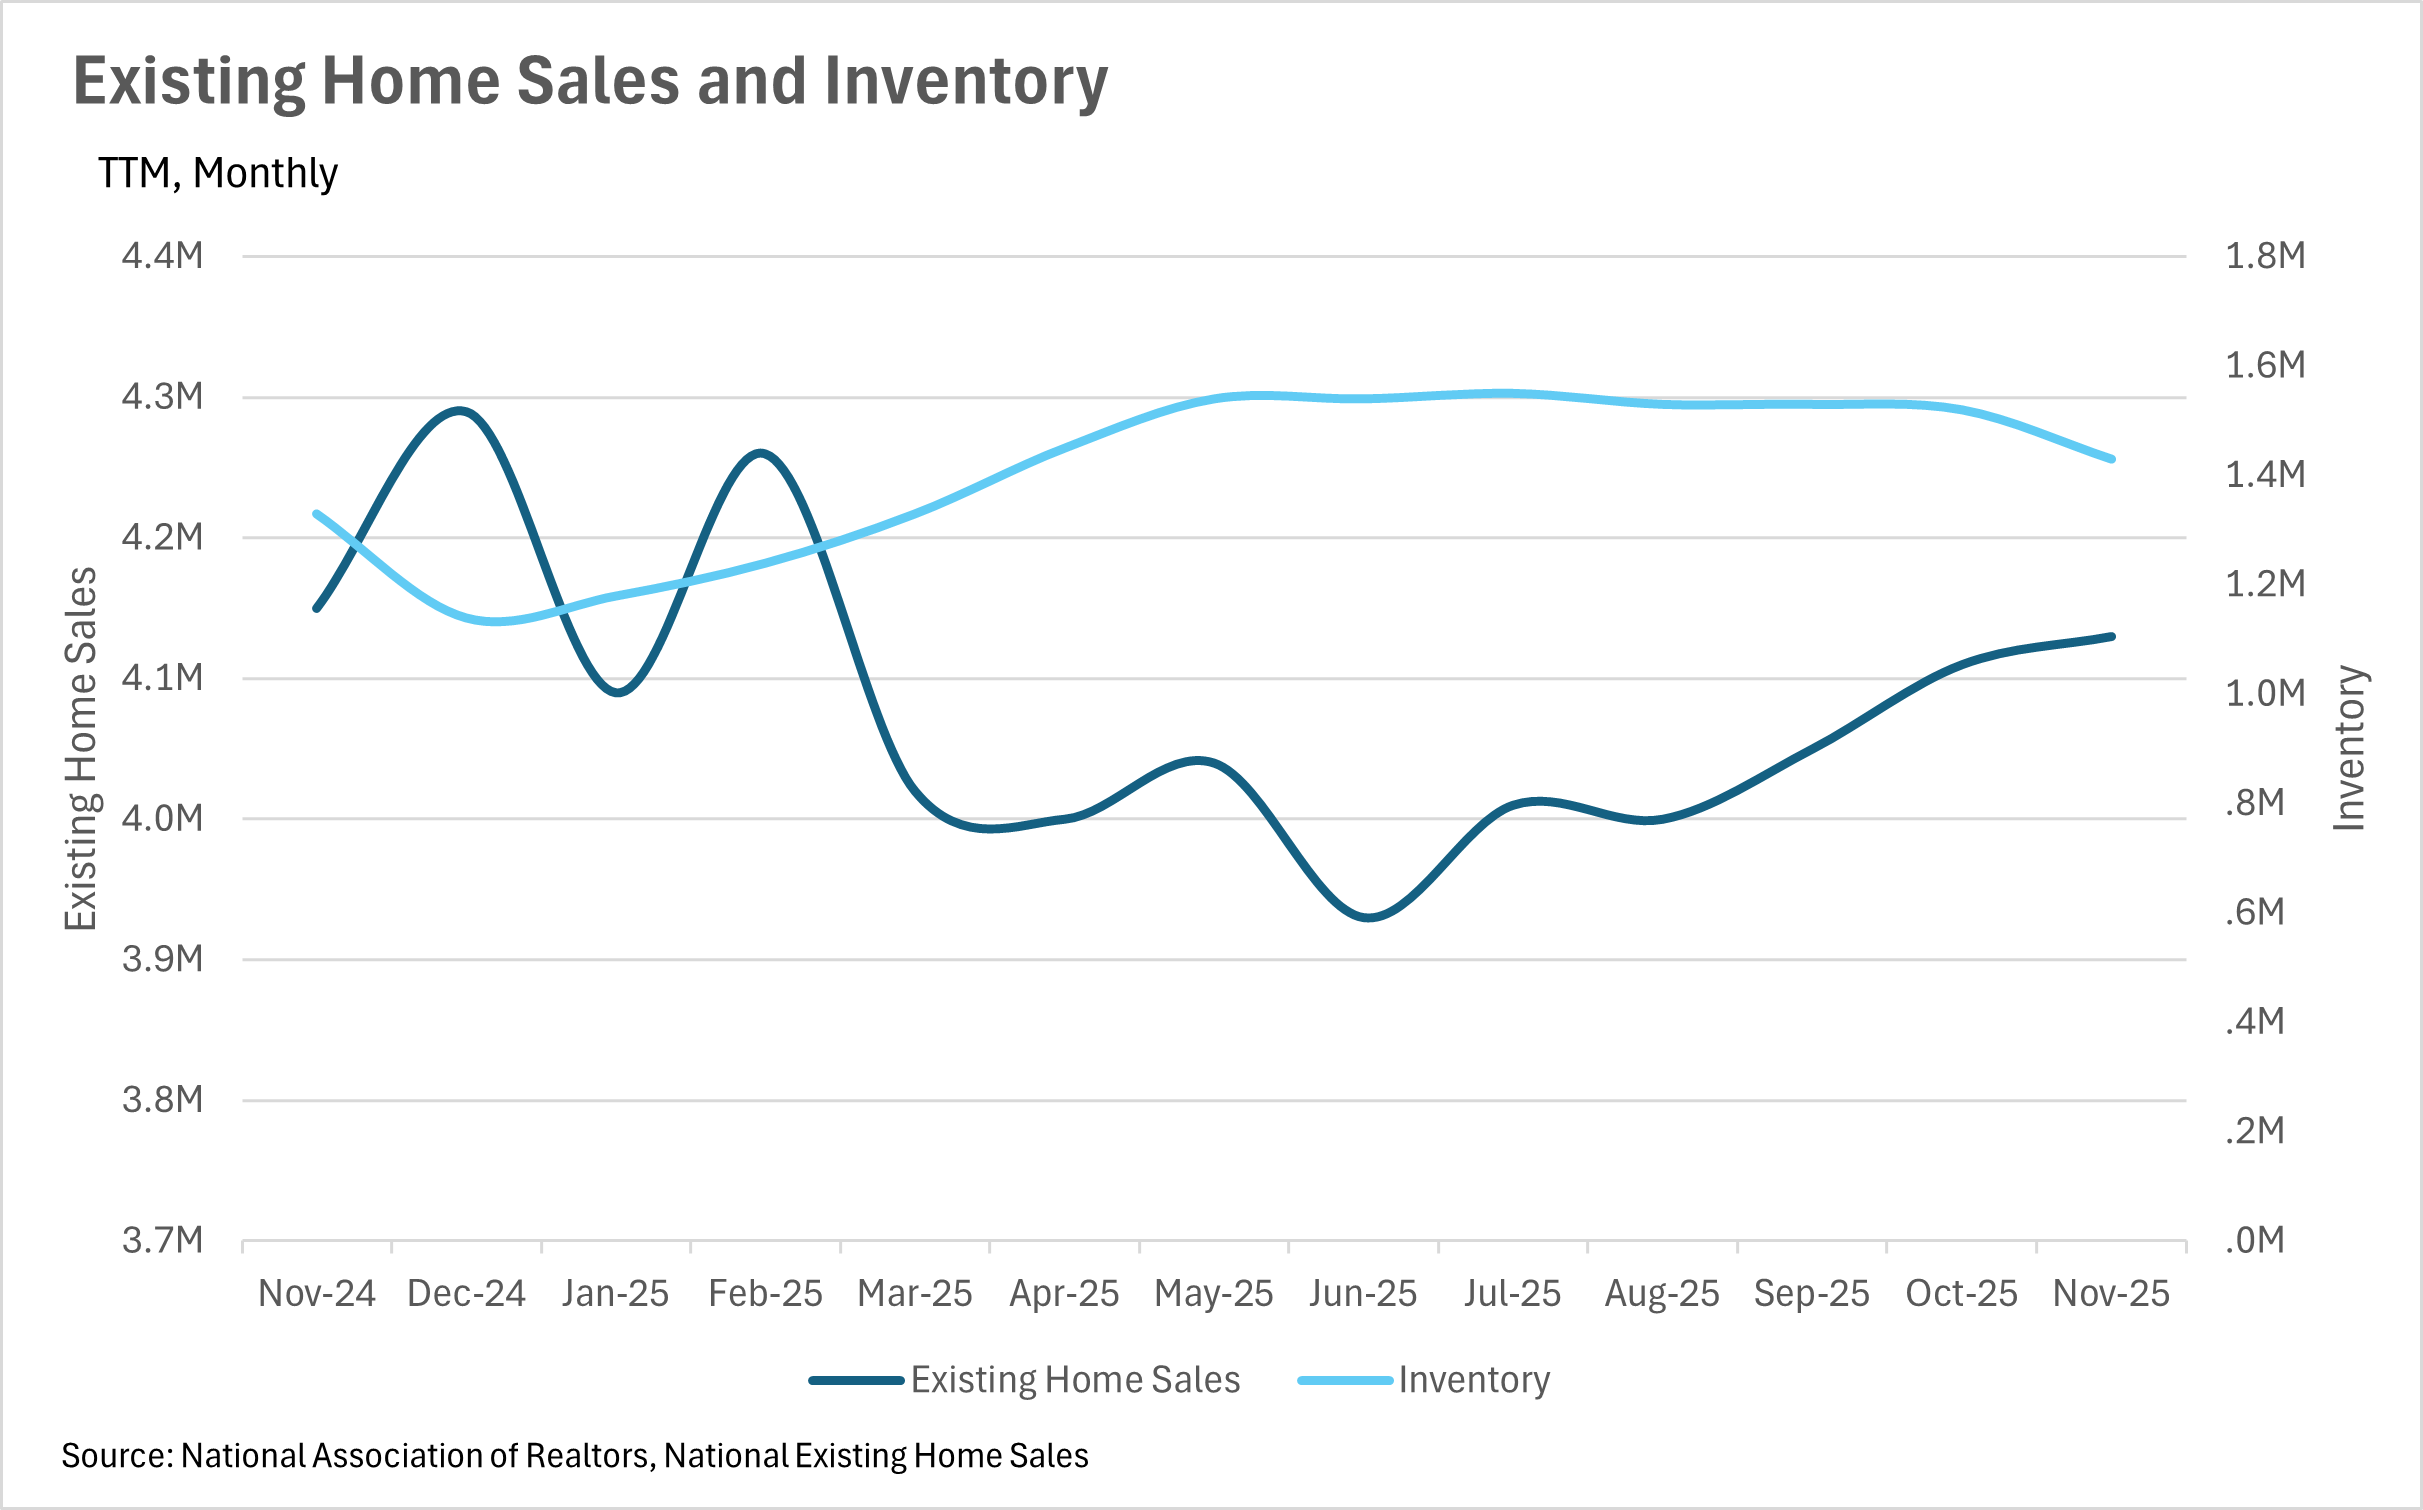
While you might expect inventories to decrease as interest rates decrease, that wasn’t the case in November. In fact, we saw inventories increase by 7.52% on a year-over-year basis, despite falling rates. This is largely attributable to the fact that existing home sales decreased by roughly half a percent while new home listings increased by roughly 1.7% on a year-over-year basis. We’ll likely see inventories continue to increase as we move through the winter months, until the usual spring rush begins and inventories start to move once again. Overally, we had a very different year in terms of market dynamics in 2025, so it’ll be interesting to watch where the market goes in 2026.
We’ve gotten to the point where rates have been so high for so long, that there is a considerable cohort of people that’s waiting on the sidelines, carefully watching interest rates. This cohort of people is ready to make a move on their first home, or is looking for a good point in time to sell their existing home and move. Lately we’ve seen quite a bit of commentary out of the Federal Reserve that has markets thinking we’ll see rate cuts, especially when you couple this with the commentary regarding interest rates coming from the executive branch. If we do see some steeper rate cuts (more than the 25 bps cuts we’ve seen recently), then moving quickly will be pivotal for you and your clients, as bigger cuts will likely lead to the floodgates opening!
Of course, this is all what we’re seeing at a national, macro level. As we all know, real estate is a localized game, so be sure to check out your local lowdown below, to see what’s going on in your market!
Note: You can find the charts/graphs for the Local Lowdown at the end of this section.
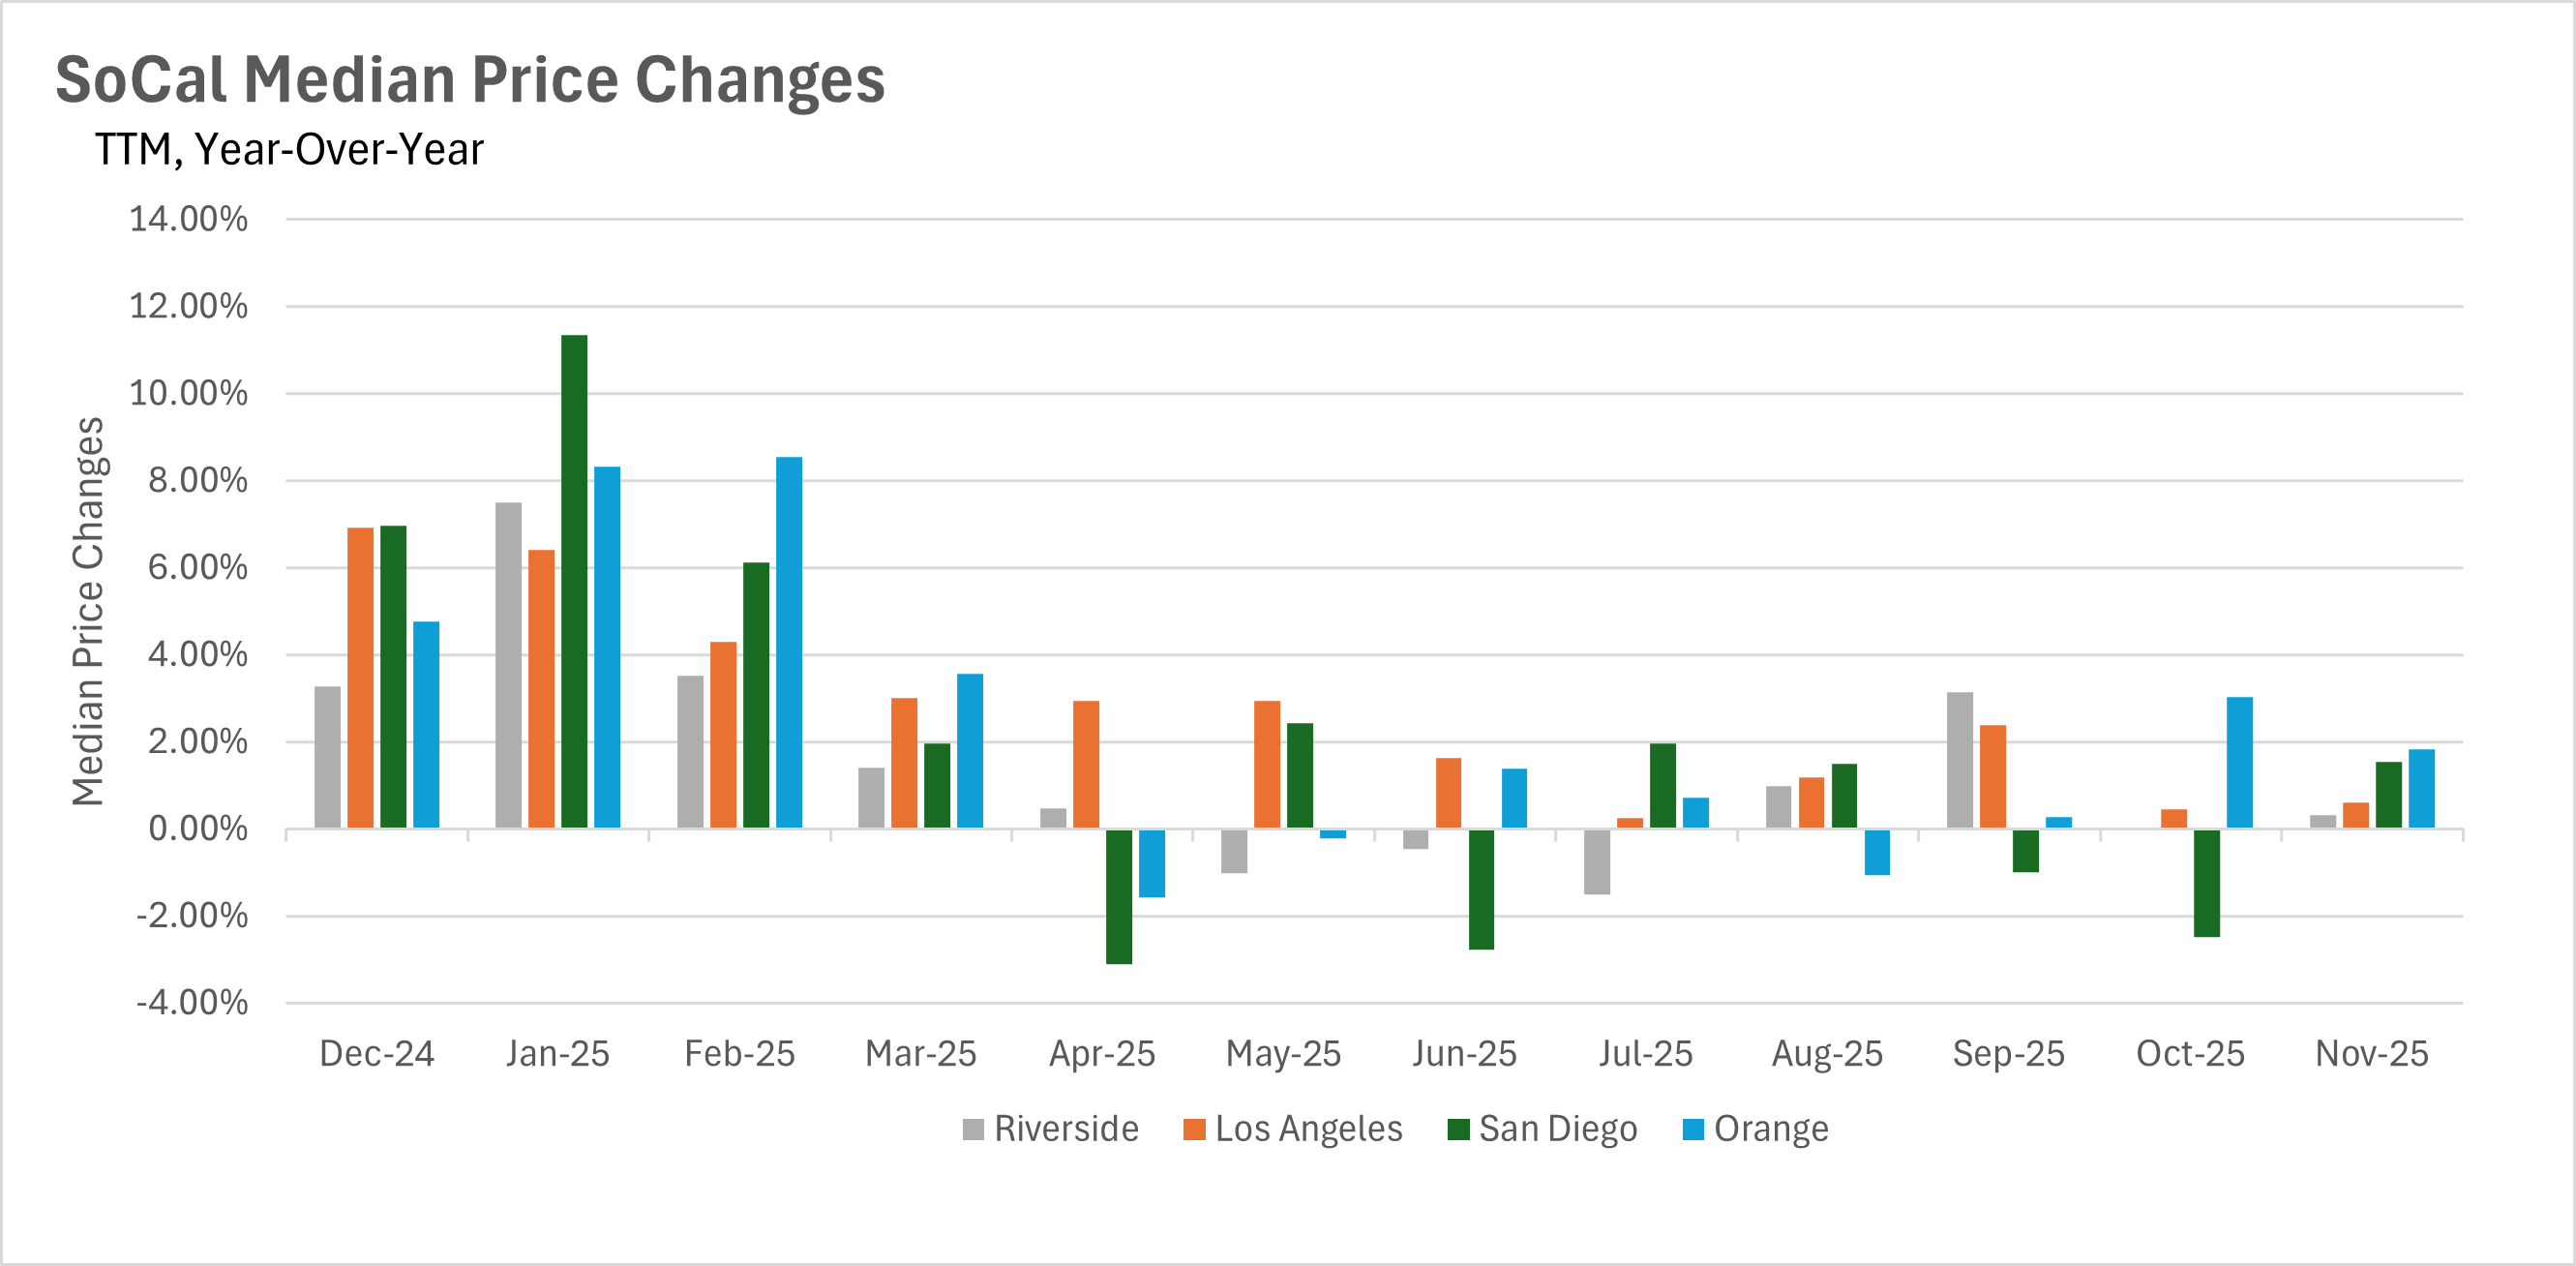
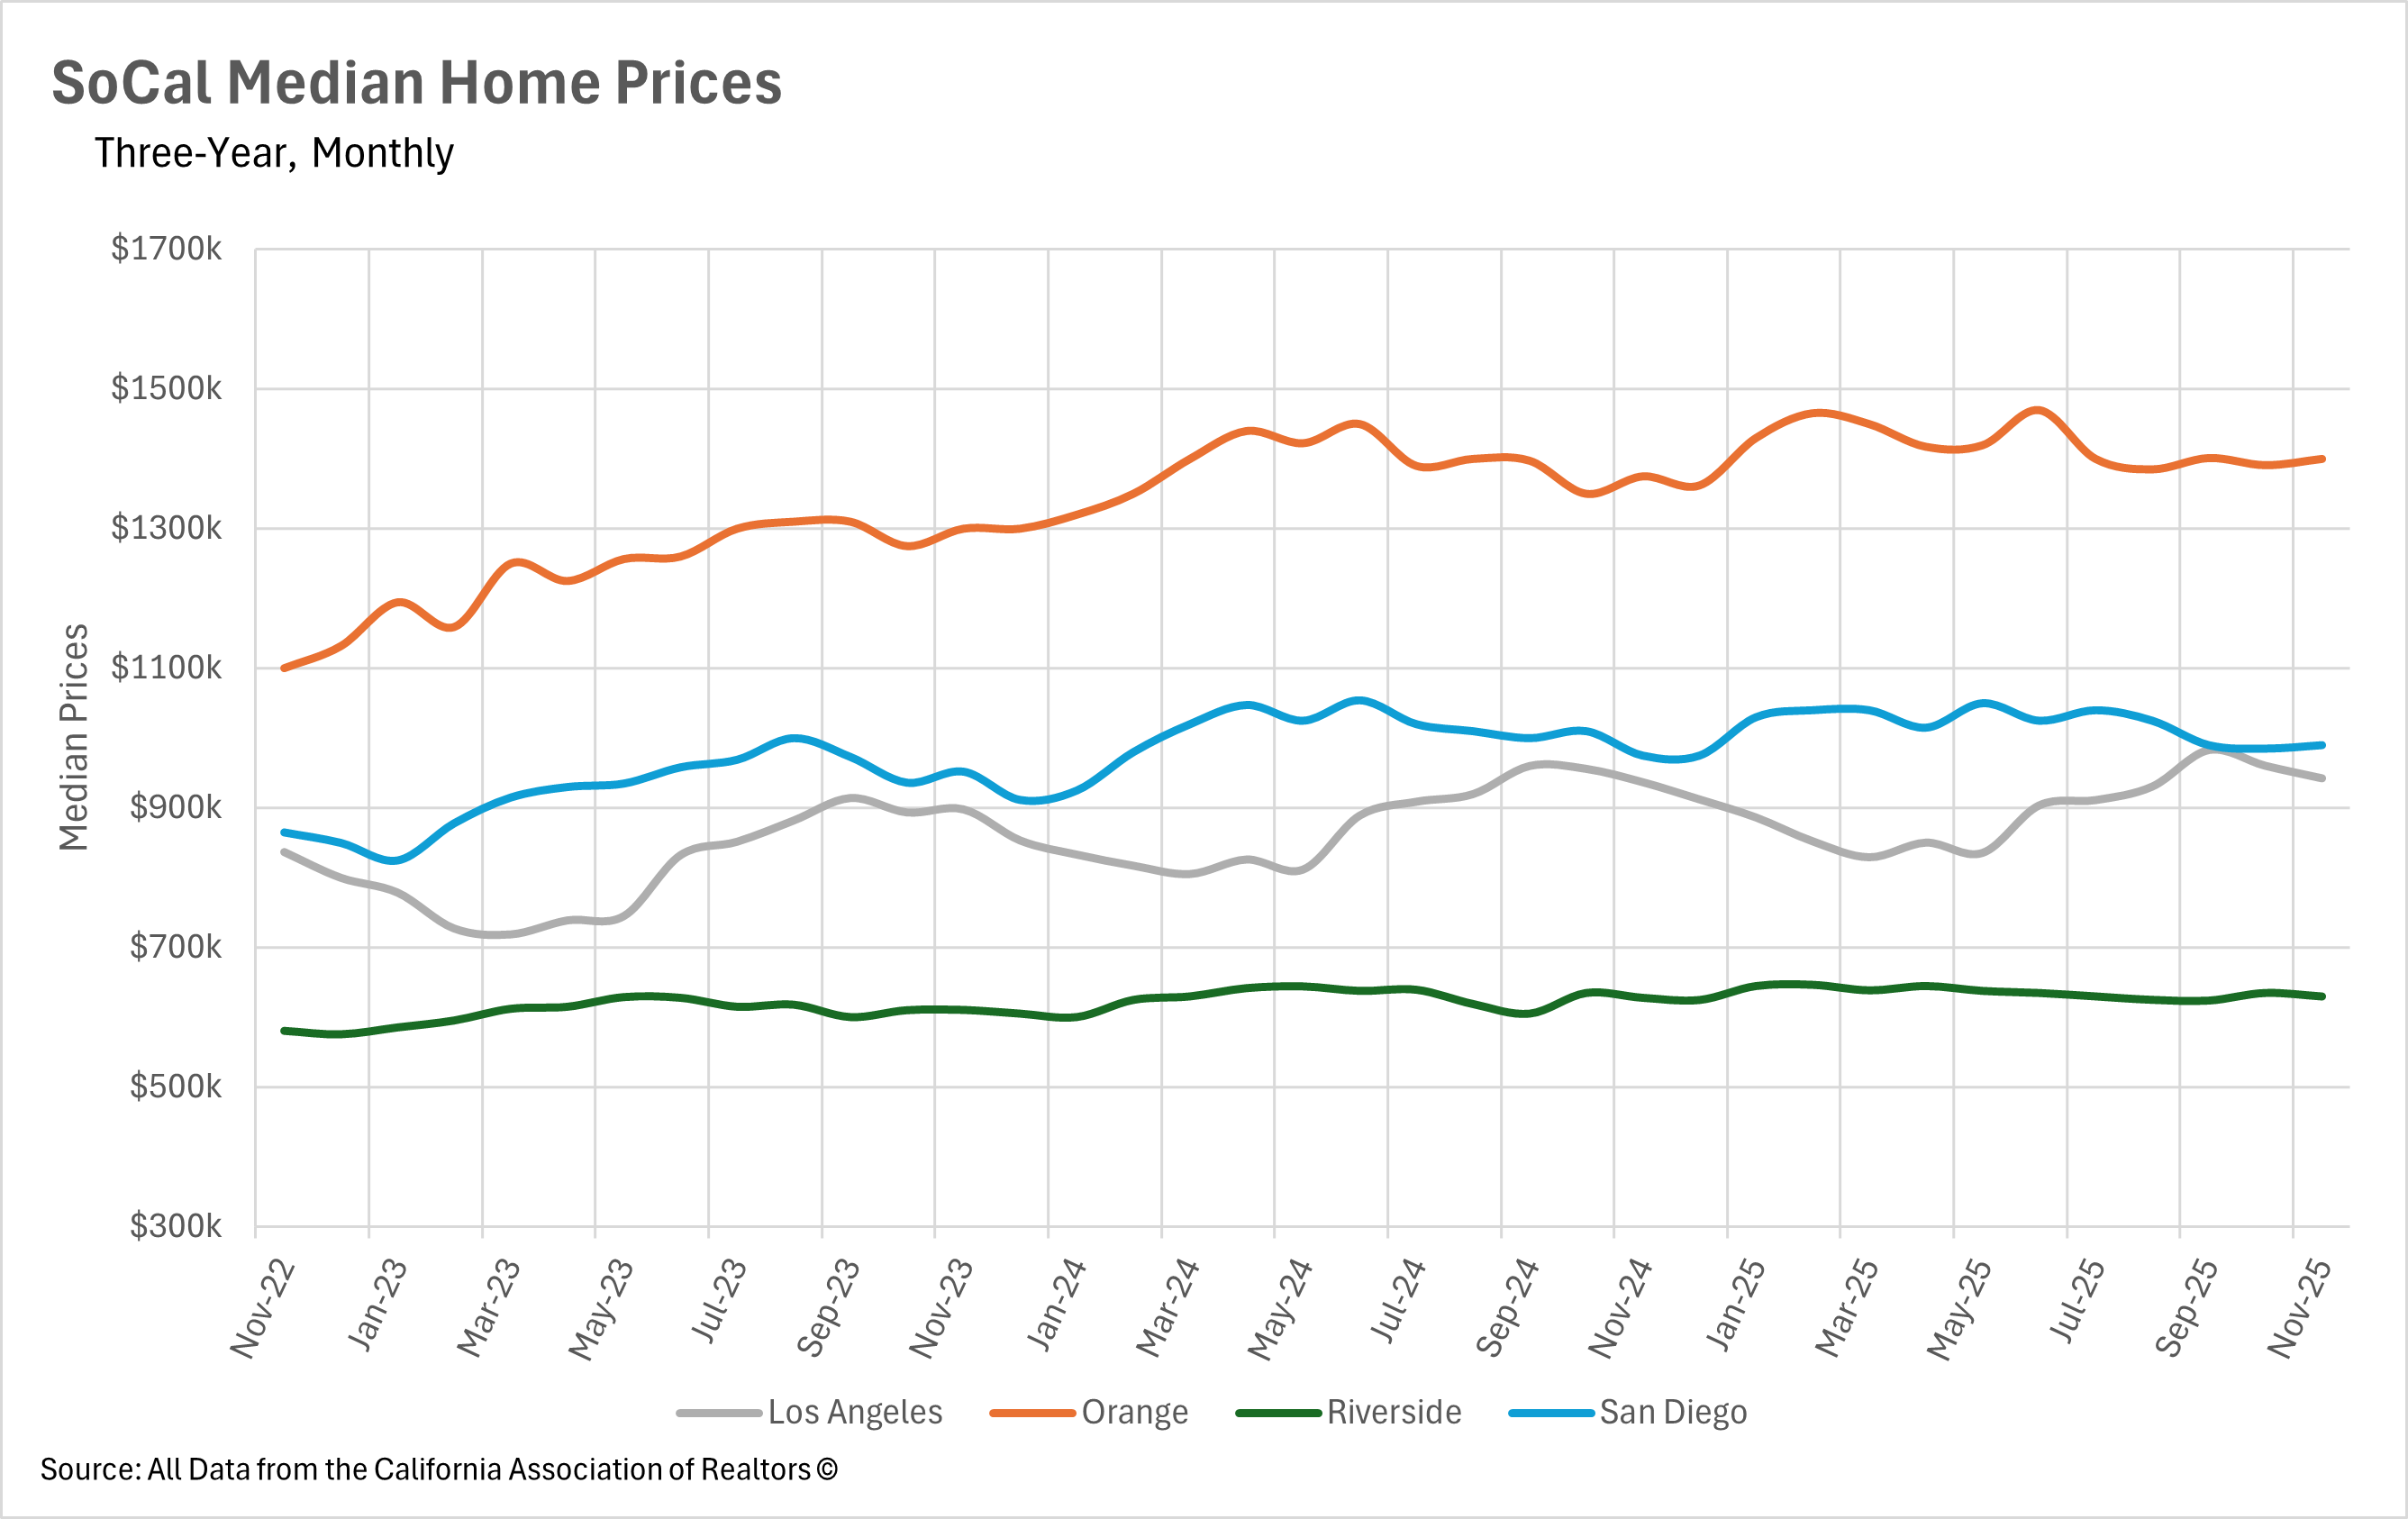
After years of dramatic appreciation, Southern California's housing market has entered a period of price stabilization as we close out 2025. All four major markets posted positive year-over-year median sale price growth in November, though the gains were notably modest compared to the double-digit appreciation rates seen in recent years. Orange County led the region with a 1.82% increase, bringing its median sale price to $1,400,000, while San Diego posted a 1.54% gain to reach $990,000. Los Angeles and Riverside saw the most muted growth, with year-over-year increases of just 0.60% and 0.31% respectively, bringing their median sale prices to $942,610 and $629,950. This pattern of minimal appreciation suggests that the region's housing markets have found a sustainable equilibrium where buyer demand and seller expectations have aligned, creating conditions for modest, steady growth rather than the volatility that characterized earlier periods.
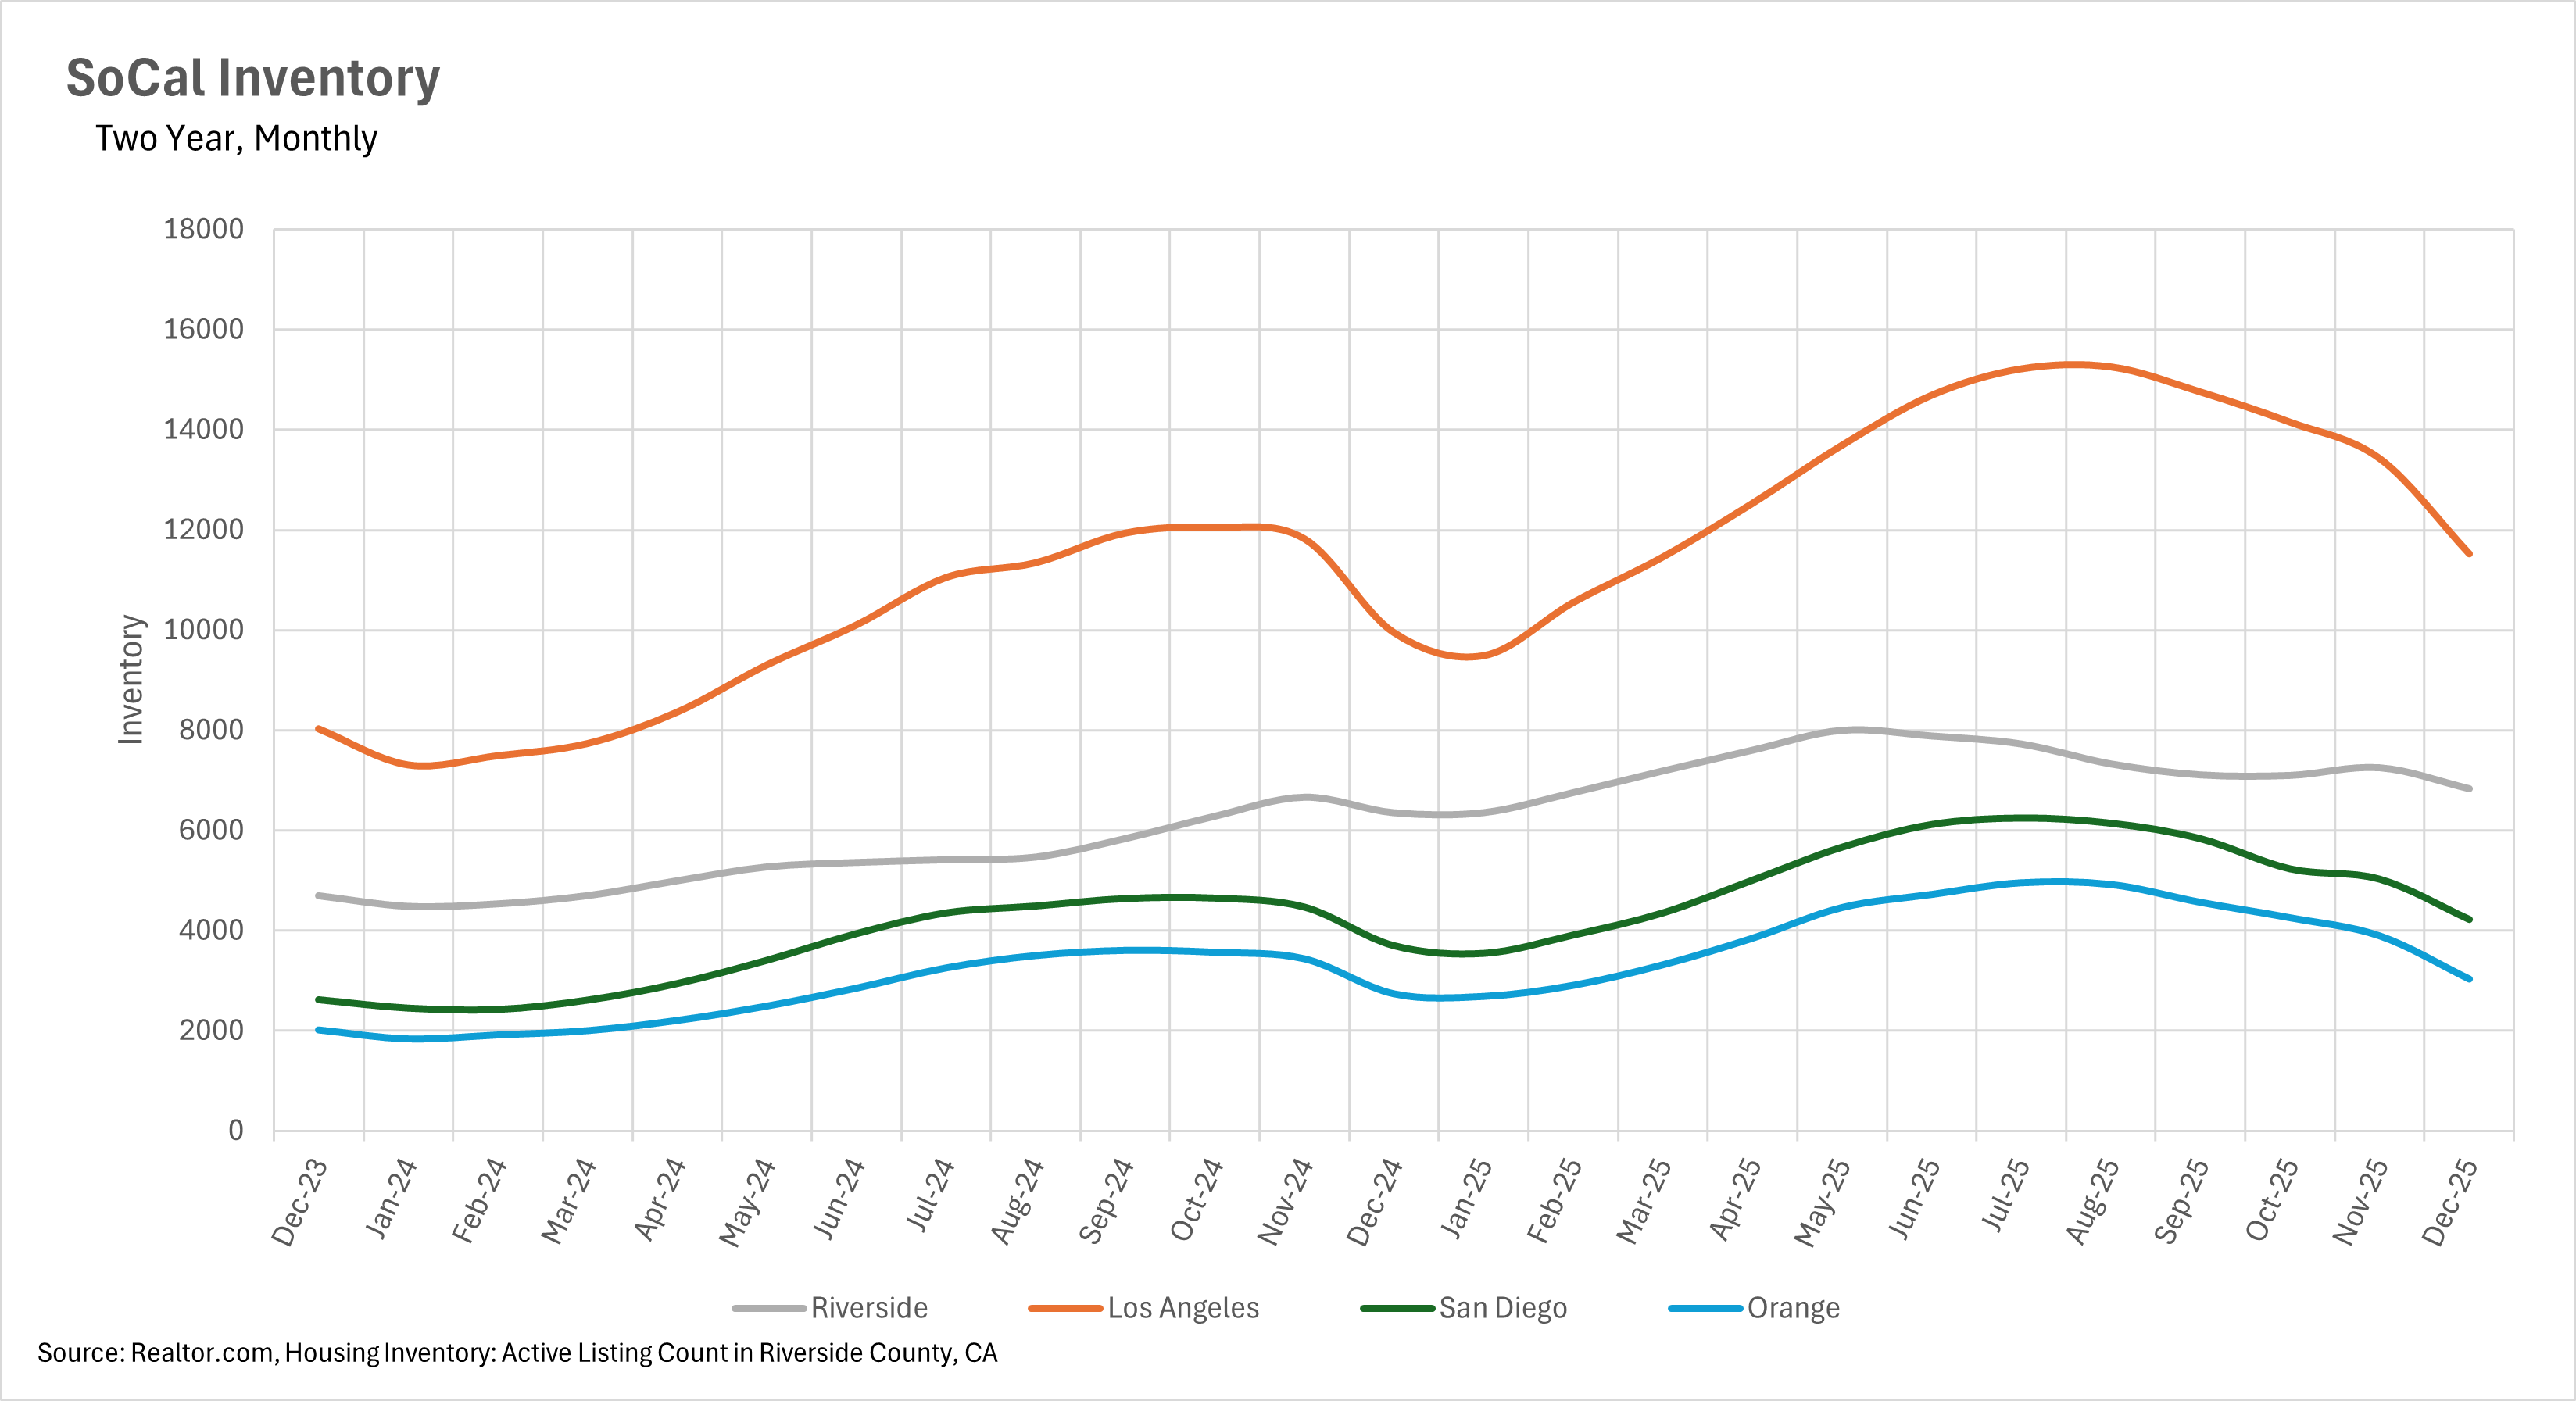
The inventory buildup that characterized much of 2025 has moderated somewhat with typical seasonal declines, but buyers still have significantly more homes to choose from compared to this time last year. Los Angeles leads the region with 11,526 active listings, representing a 15.79% year-over-year increase, while San Diego's 4,222 homes reflect a 14.17% increase over December 2024. Riverside has seen similar expansion, with 6,830 homes on the market representing a 12.94% year-over-year gain. Orange County posted the smallest increase at 10.80%, with 3,027 active listings. While month-over-month declines have been substantial across all markets as sellers pull listings during the holiday season, the sustained elevation in year-over-year inventory levels demonstrates that the region has moved meaningfully away from the supply-constrained conditions that drove rapid appreciation in previous years.
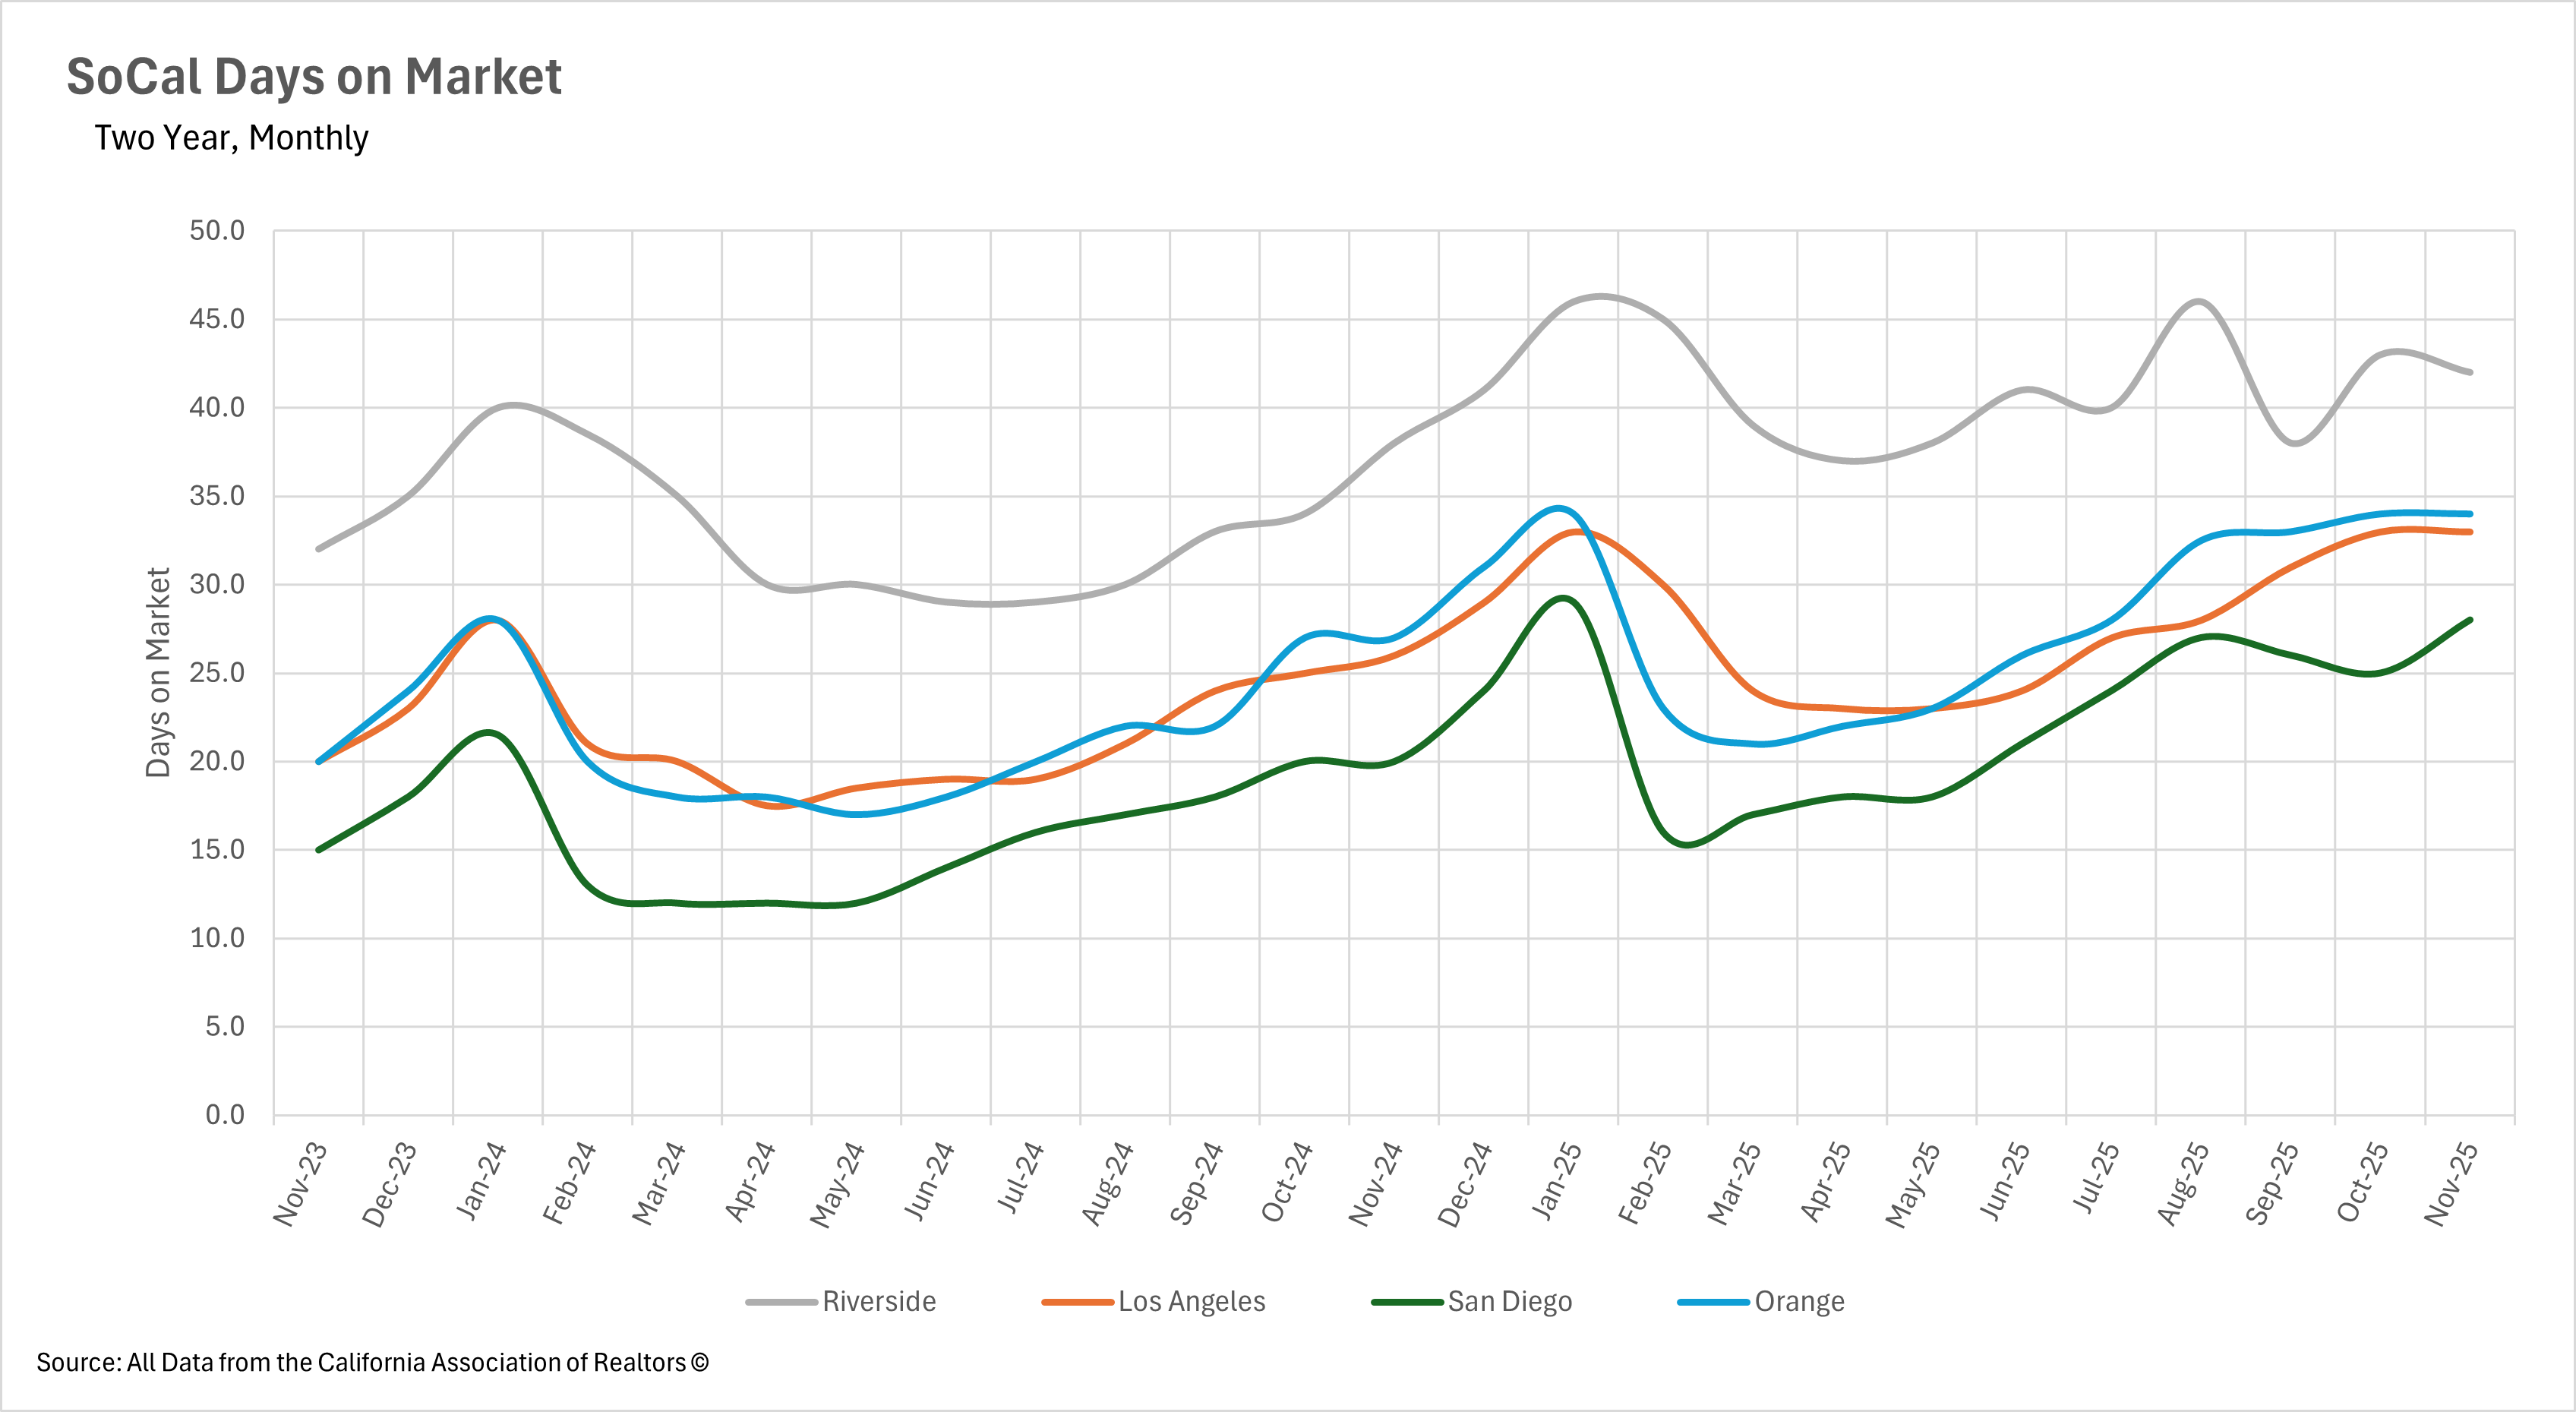
The increased inventory levels have translated into significantly longer selling times throughout Southern California, as buyers exercise greater caution and selectivity in their purchase decisions. San Diego saw the most dramatic change, with homes spending 28 days on the market in November, representing a 40% increase compared to last year. Los Angeles and Orange County posted similar increases, with homes sitting for 33 and 34 days respectively, up approximately 26% on a year-over-year basis. Riverside's 42 days on market reflects a 15.15% year-over-year increase. This consistent pattern across all four markets suggests that buyer behavior has fundamentally shifted, with purchasers leveraging their improved position to conduct more thorough due diligence before committing. While these selling times remain reasonable by historical standards, they represent a meaningful departure from the frenzied pace of 2024 when well-priced homes often received multiple offers within days of listing.
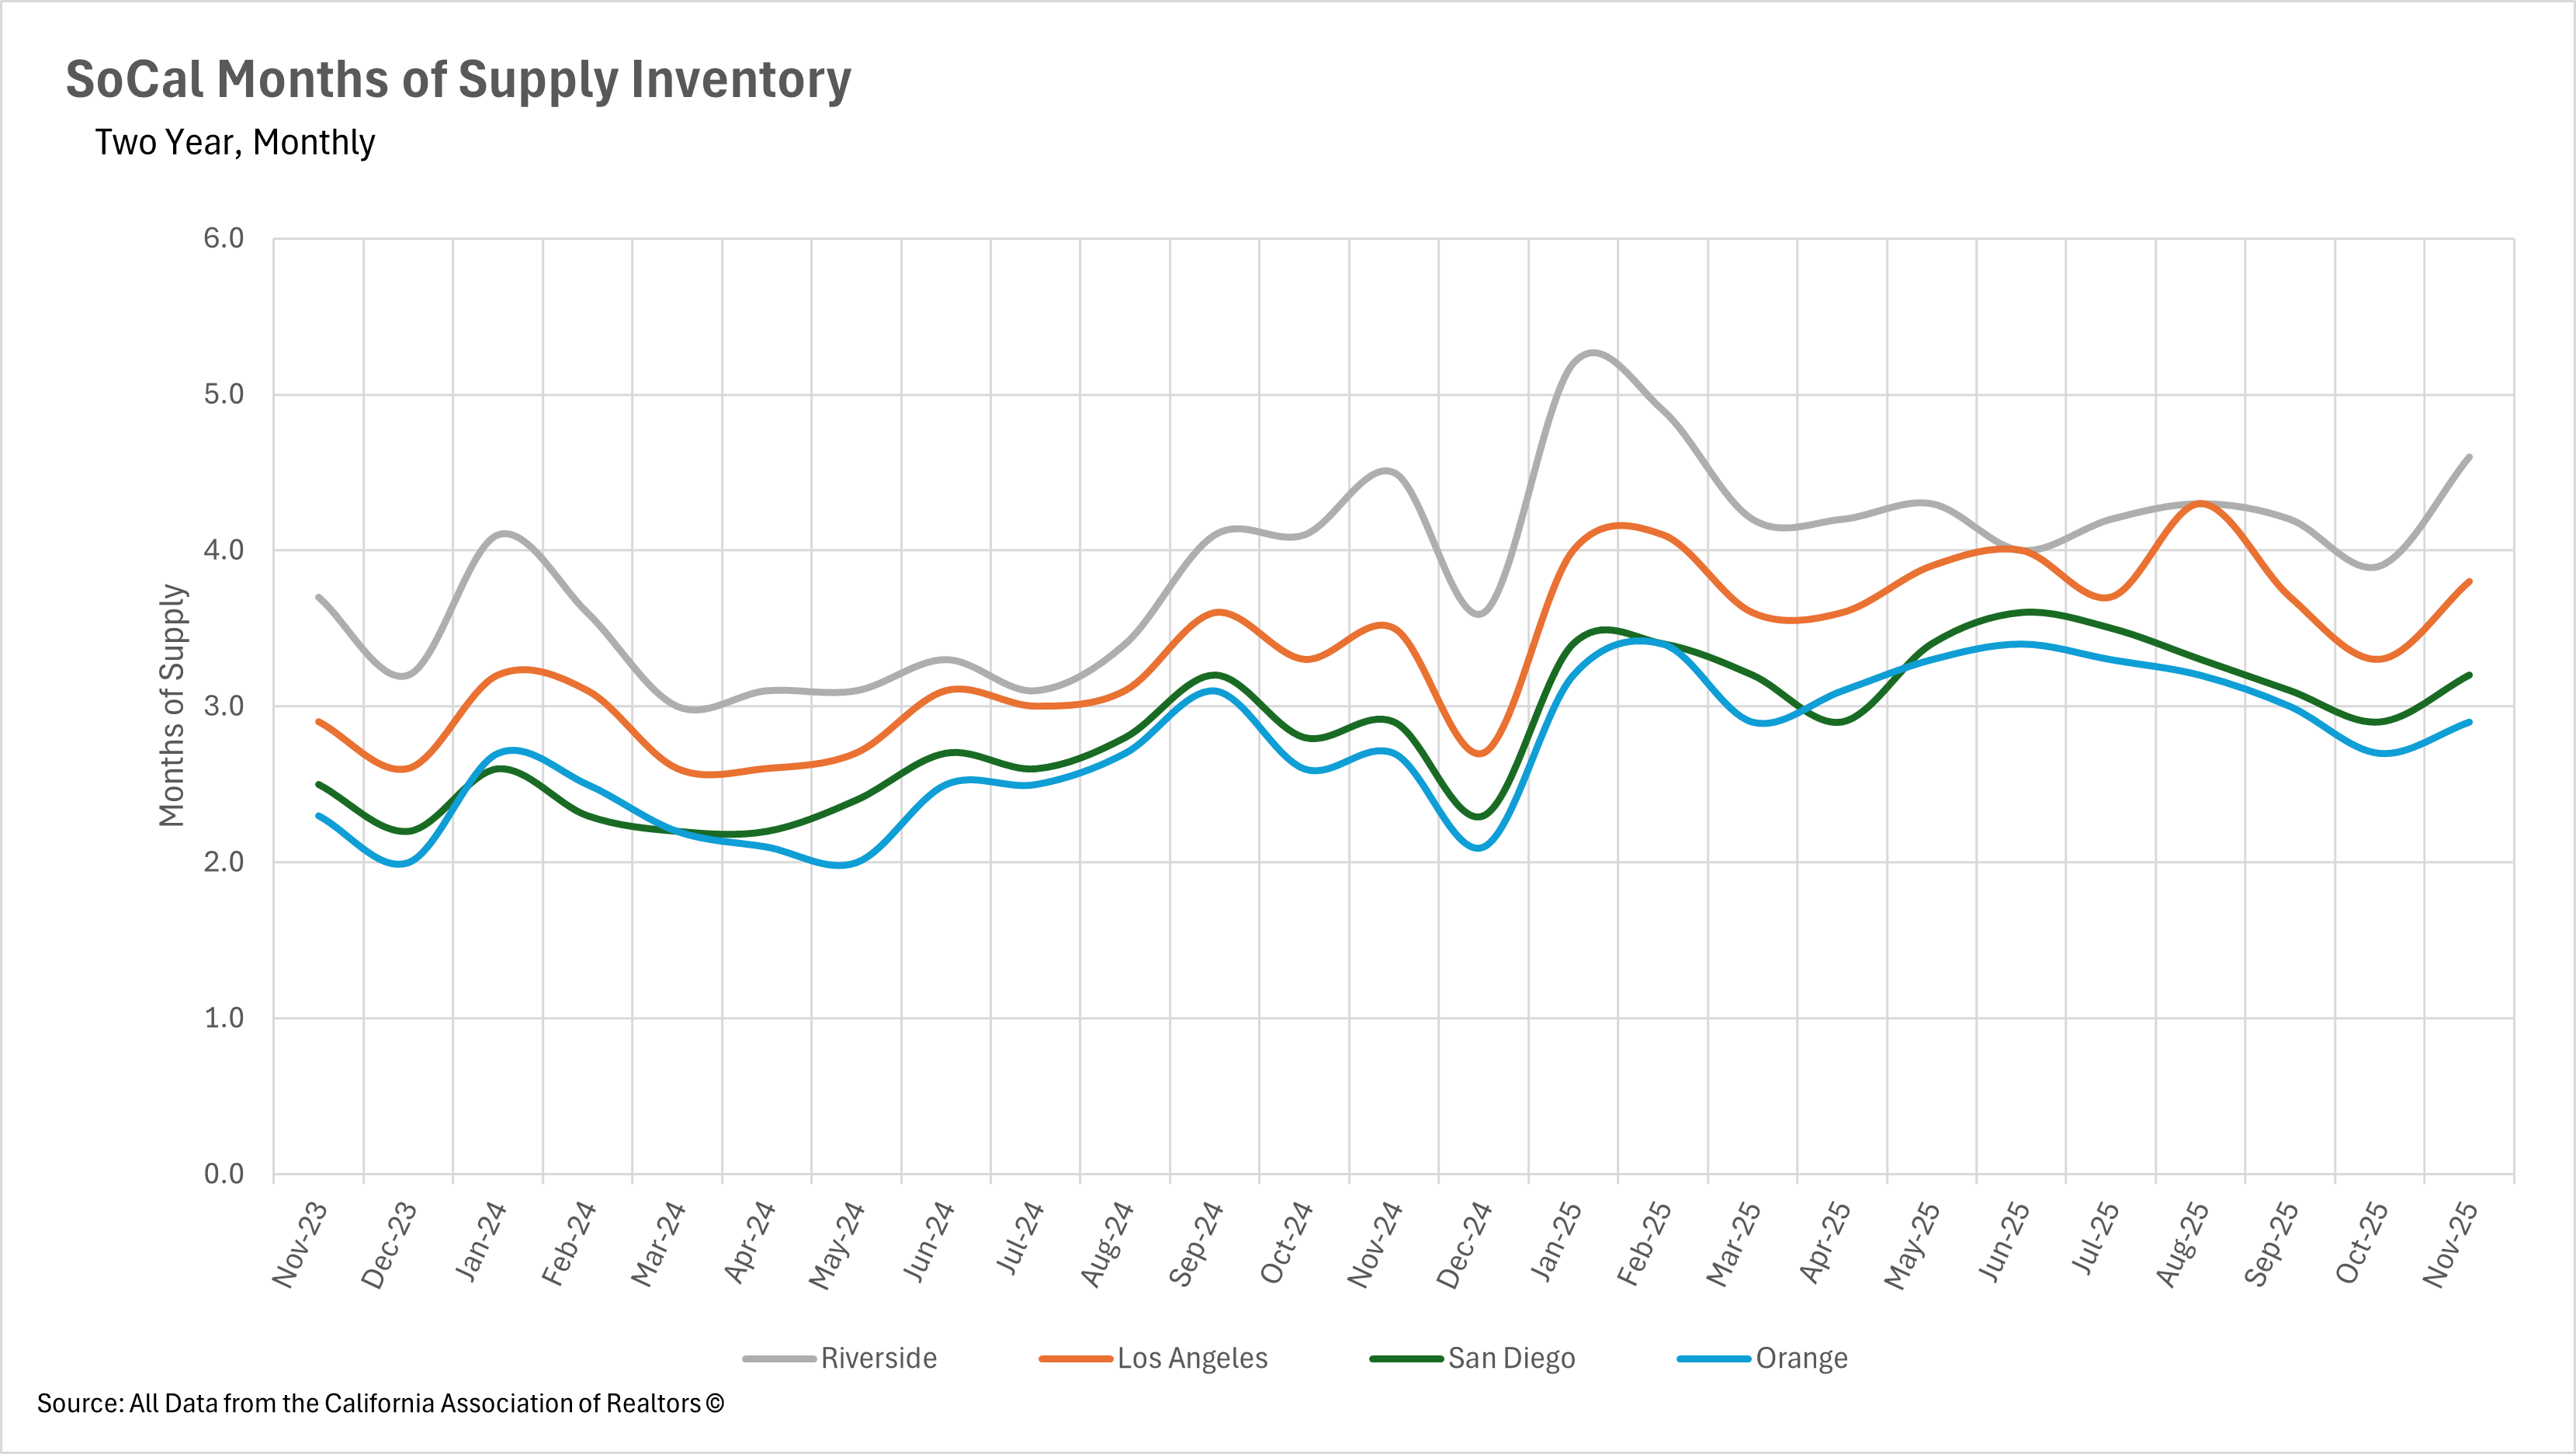
When determining whether a market is a buyers’ market or a sellers’ market, we look to the Months of Supply Inventory (MSI) metric. The state of California has historically averaged around three months of MSI, so any area with at or around three months of MSI is considered a balanced market. Any market that has lower than three months of MSI is considered a sellers’ market, whereas markets with more than three months of MSI are considered buyers’ markets.
Southern California's markets have diverged in terms of overall balance as we close out the year. Riverside and Los Angeles have moved firmly into buyer's market territory, with 4.6 and 3.8 months of supply respectively, giving purchasers meaningful leverage in negotiations. San Diego sits in balanced territory at 3.2 months of supply, while Orange County hovers right at the edge of balance with 2.9 months of supply. This variation across markets creates different opportunities depending on location: buyers looking in the Inland Empire or Los Angeles County may find more room for negotiation, while those focused on Orange County or San Diego can expect more competitive conditions. As we head into 2026, the spring selling season will be a key test of whether these market dynamics persist or shift as traditionally higher buyer demand meets the region's elevated inventory levels.
Stay up to date on the latest real estate trends.

August 2026

July 2026

A Closer Look at Dallas Rental Prices, Hidden Costs, and What Renters Need to Know Before Moving

June 2026

May 2026

April 2026
March 2026
February 2026
January 2026
You’ve got questions and we can’t wait to answer them.