Market Update Los Angeles

Note: You can find the charts & graphs for the Big Story at the end of the following section.
*National Association of REALTORS® data is released two months behind, so we estimate the most recent month’s data when possible and appropriate.
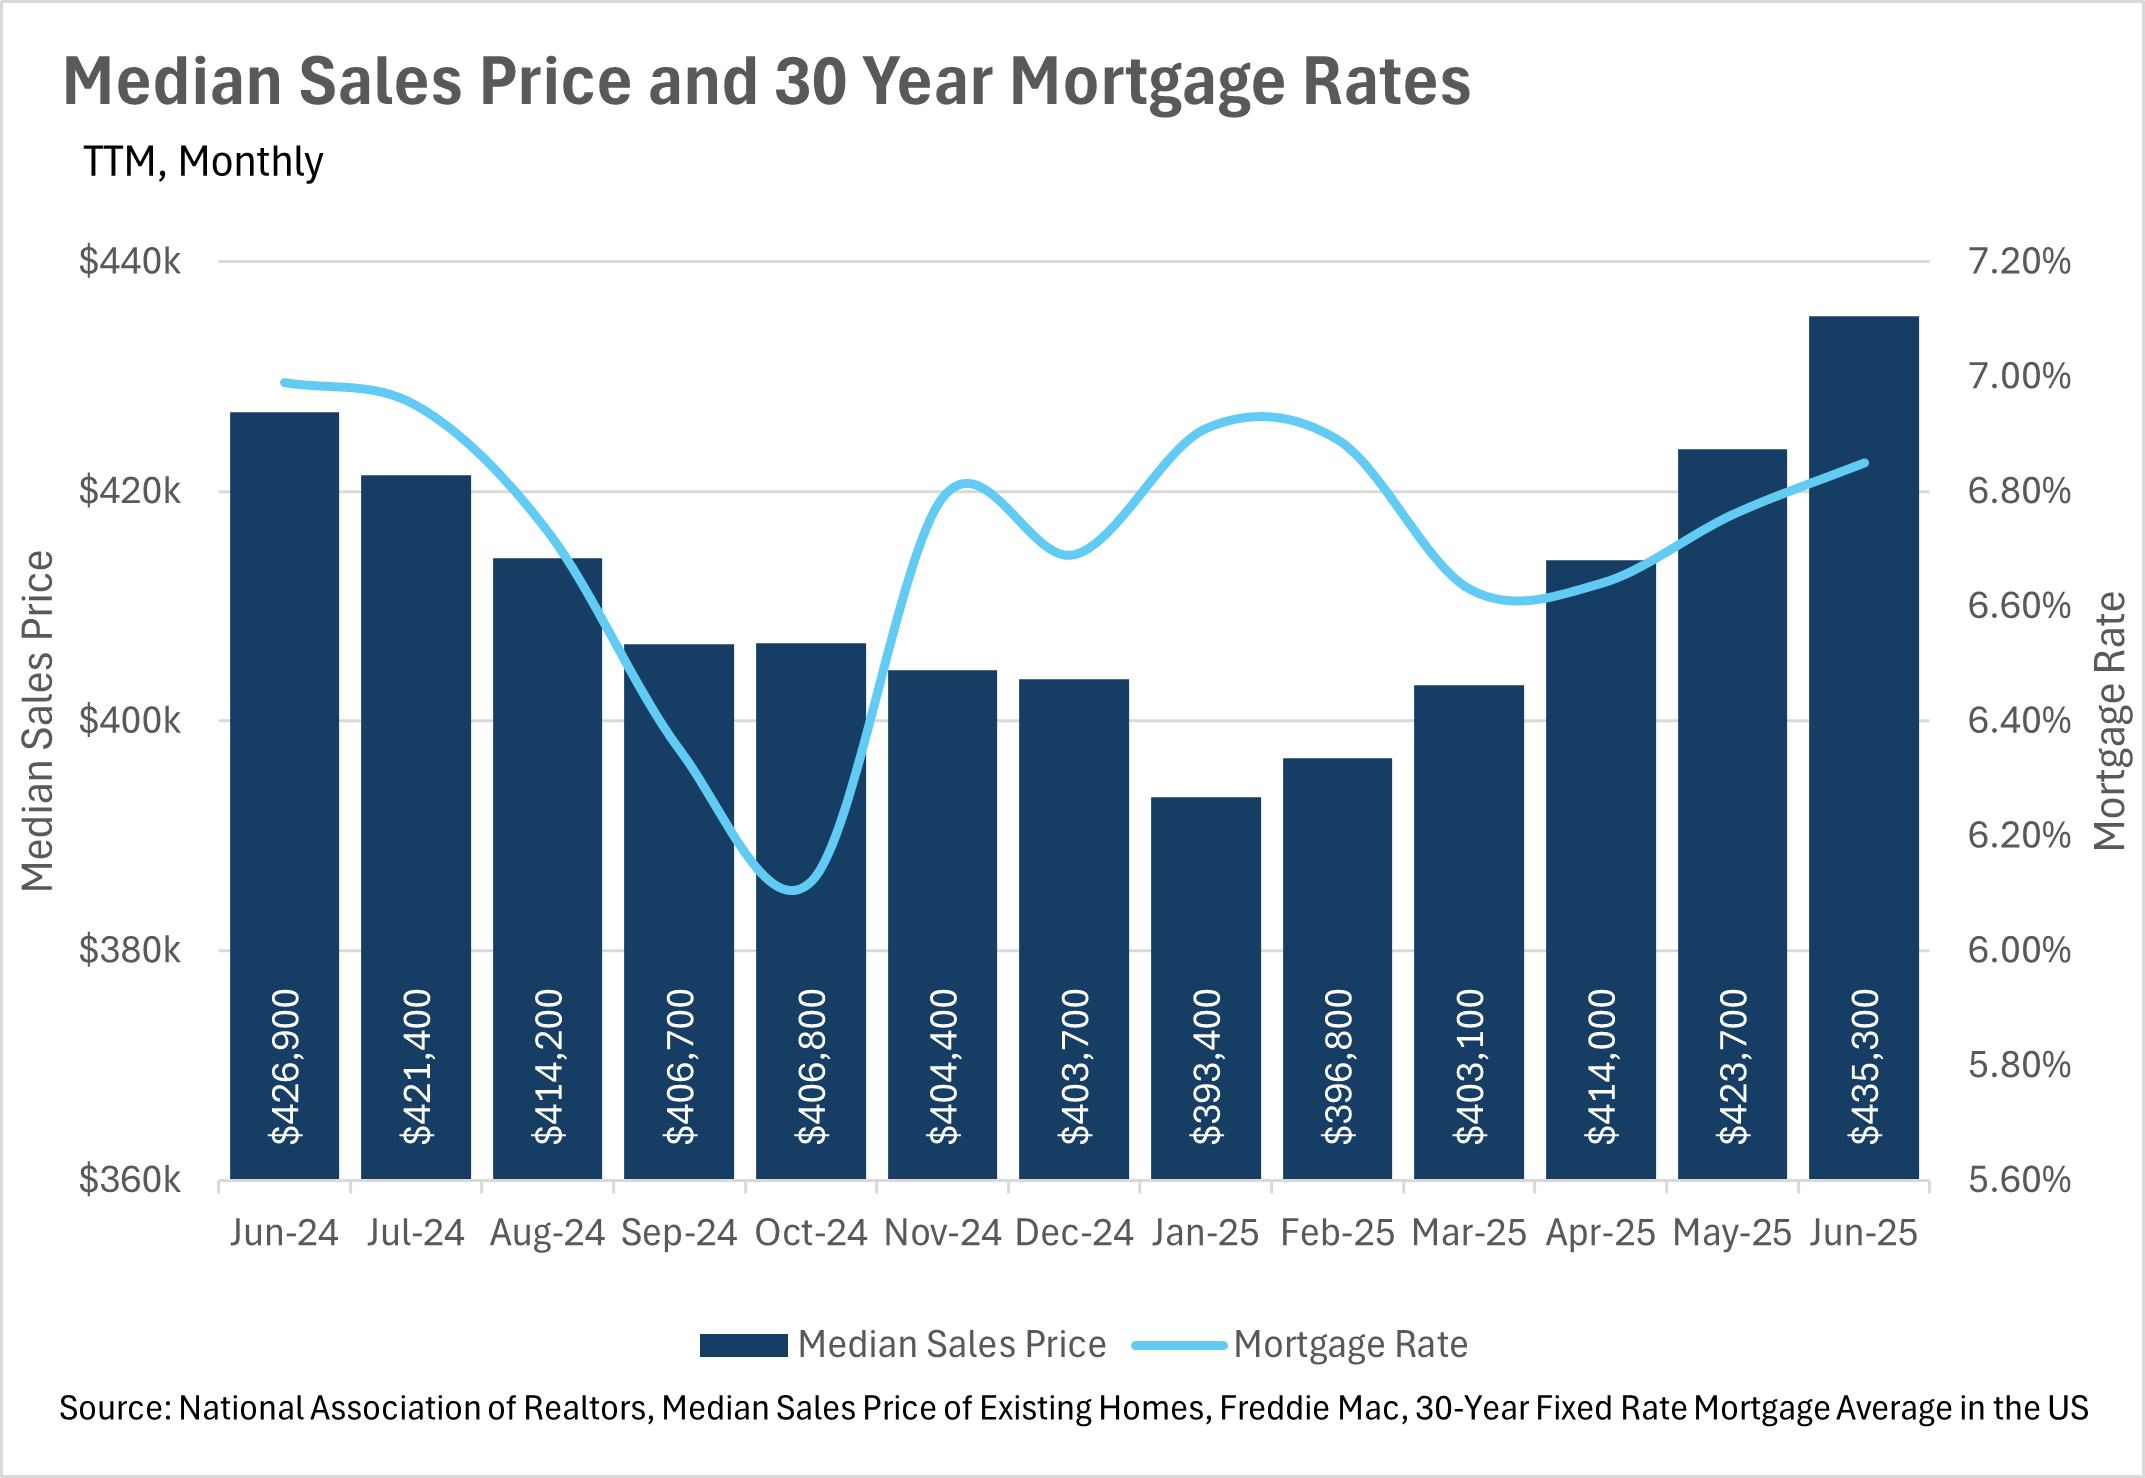
In the not-so-distant past, housing price growth outstripped inflation growth by a wide margin. However, now that the housing market has normalized, we’re seeing more modest levels of appreciation, with the median home sale price increasing by just 1.97% on a year-over-year basis in June. This represents great news for home buyers, and the housing market as a whole, considering that the June CPI reading came in at 2.7%. It’ll be worth paying attention to this over the course of the next few months, especially considering that many analysts are expecting a rate cut from the Fed in the September FOMC meeting.
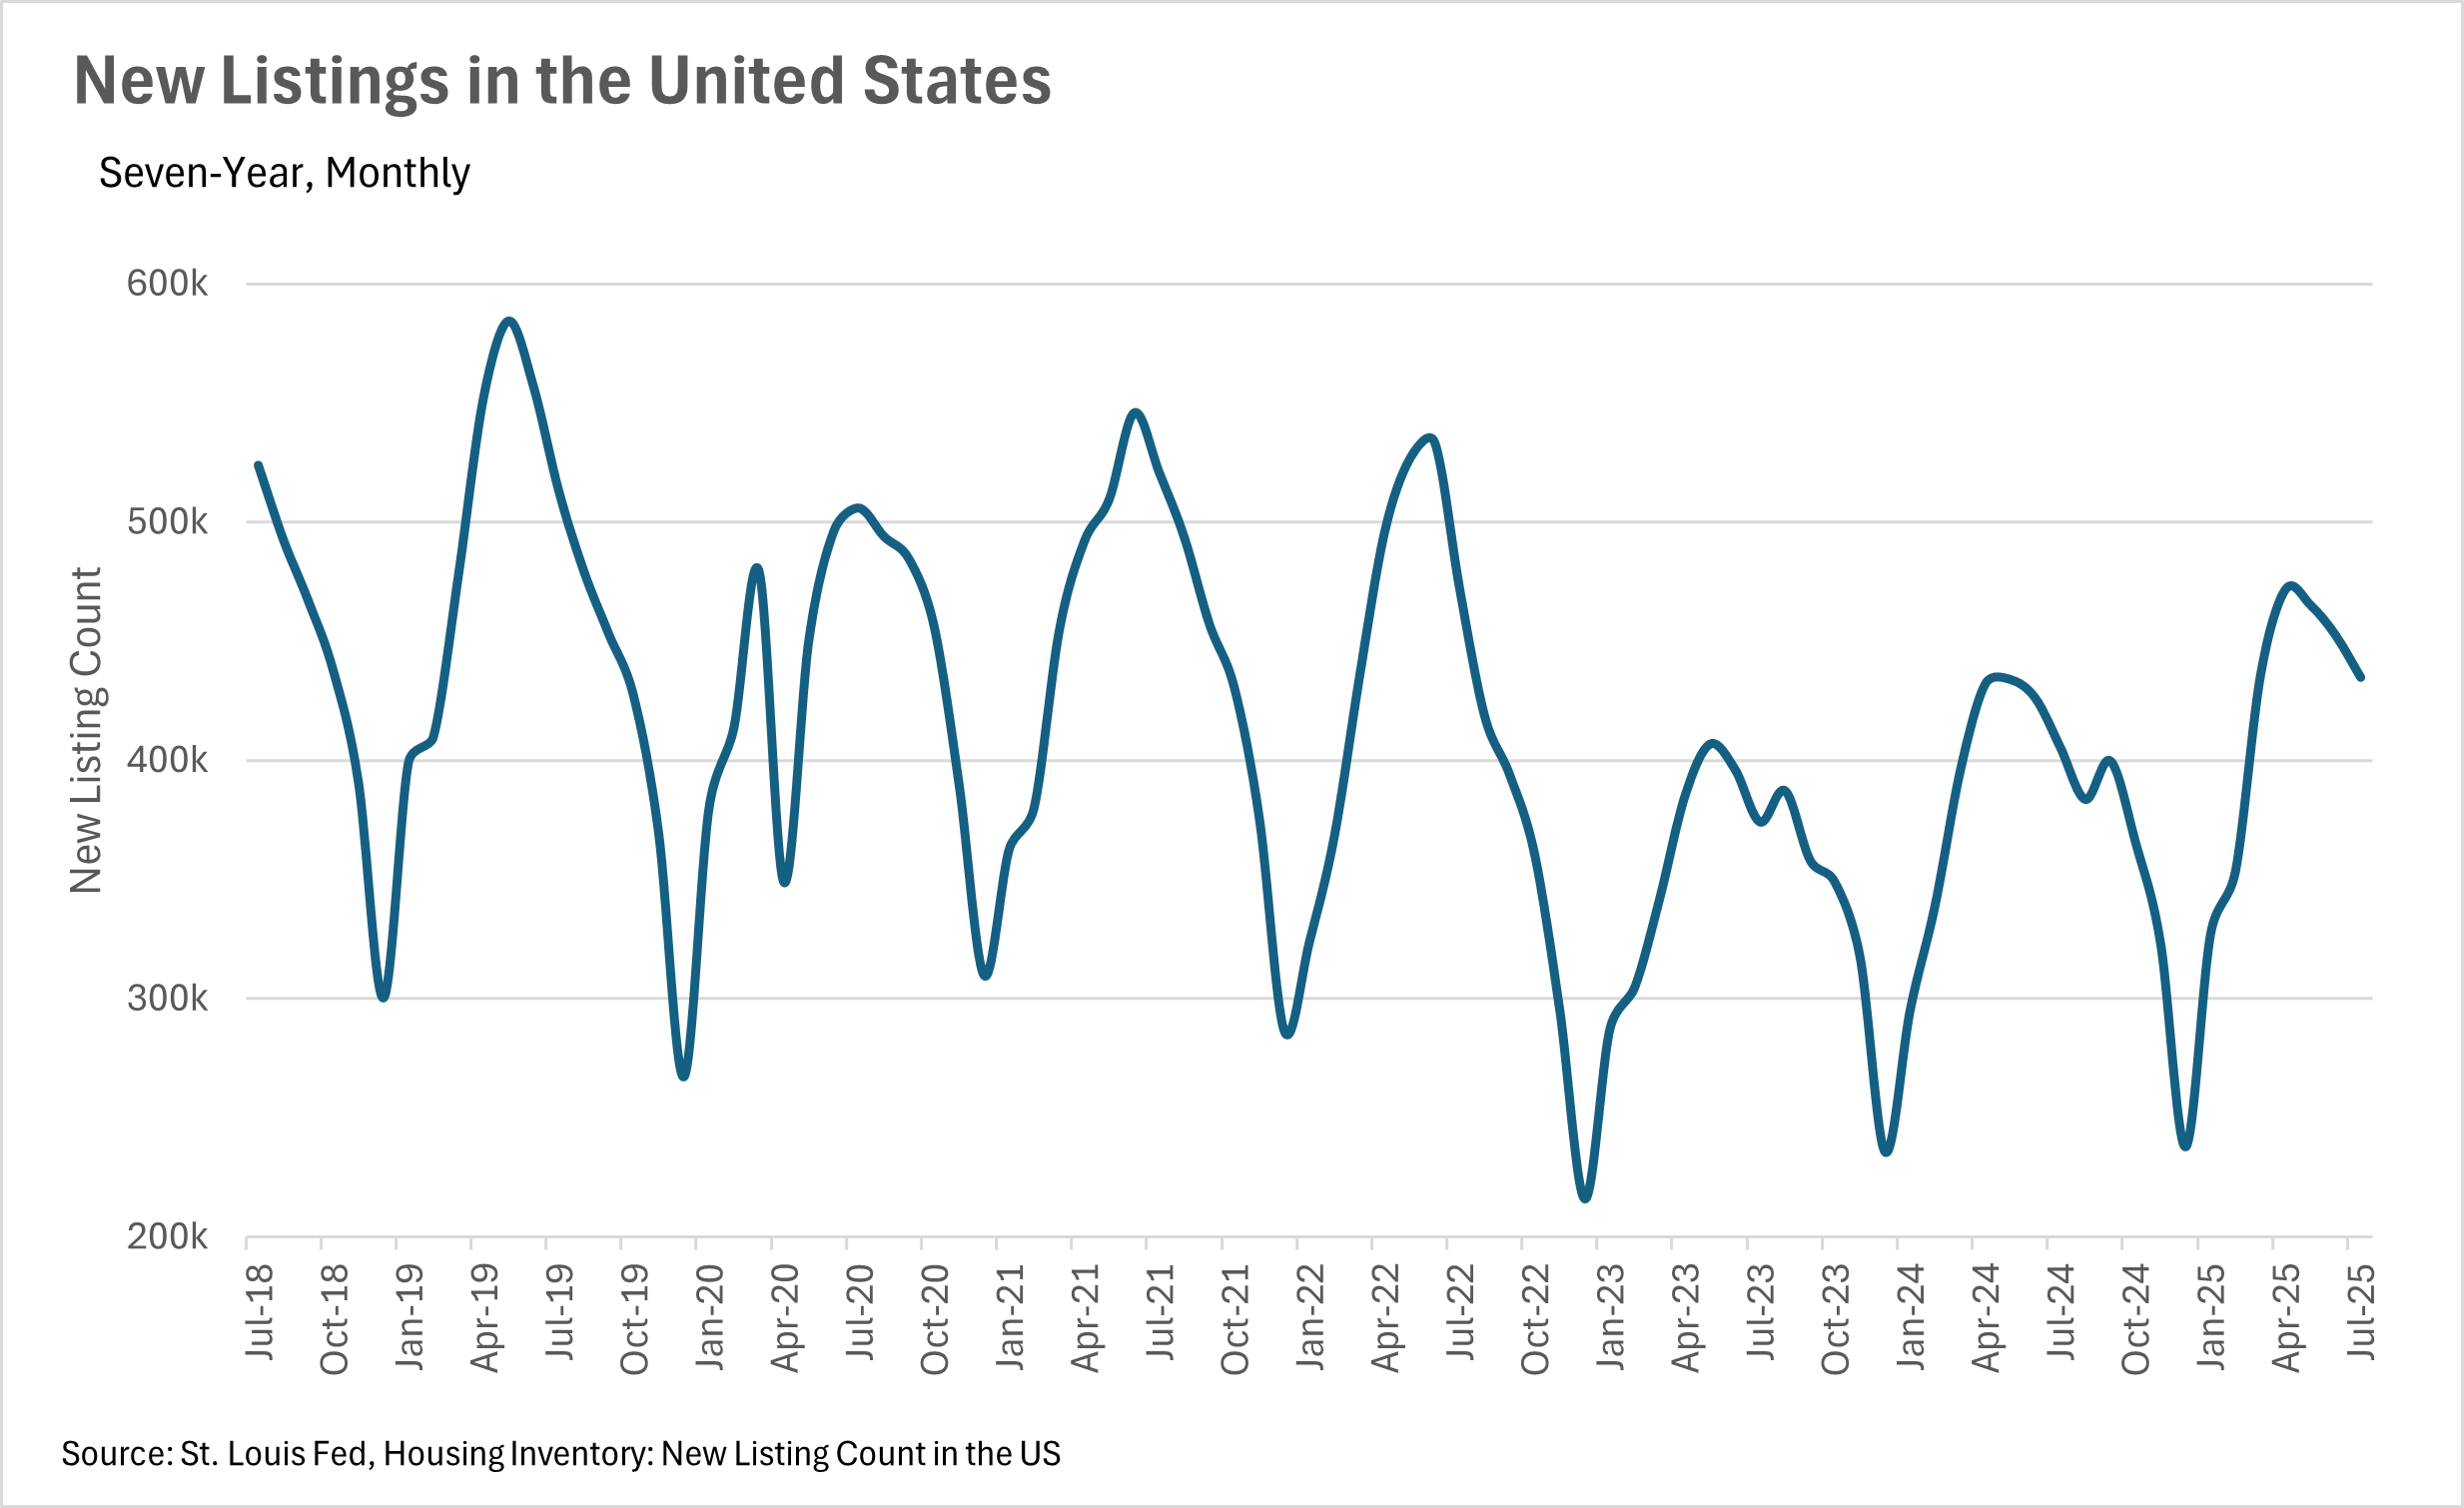
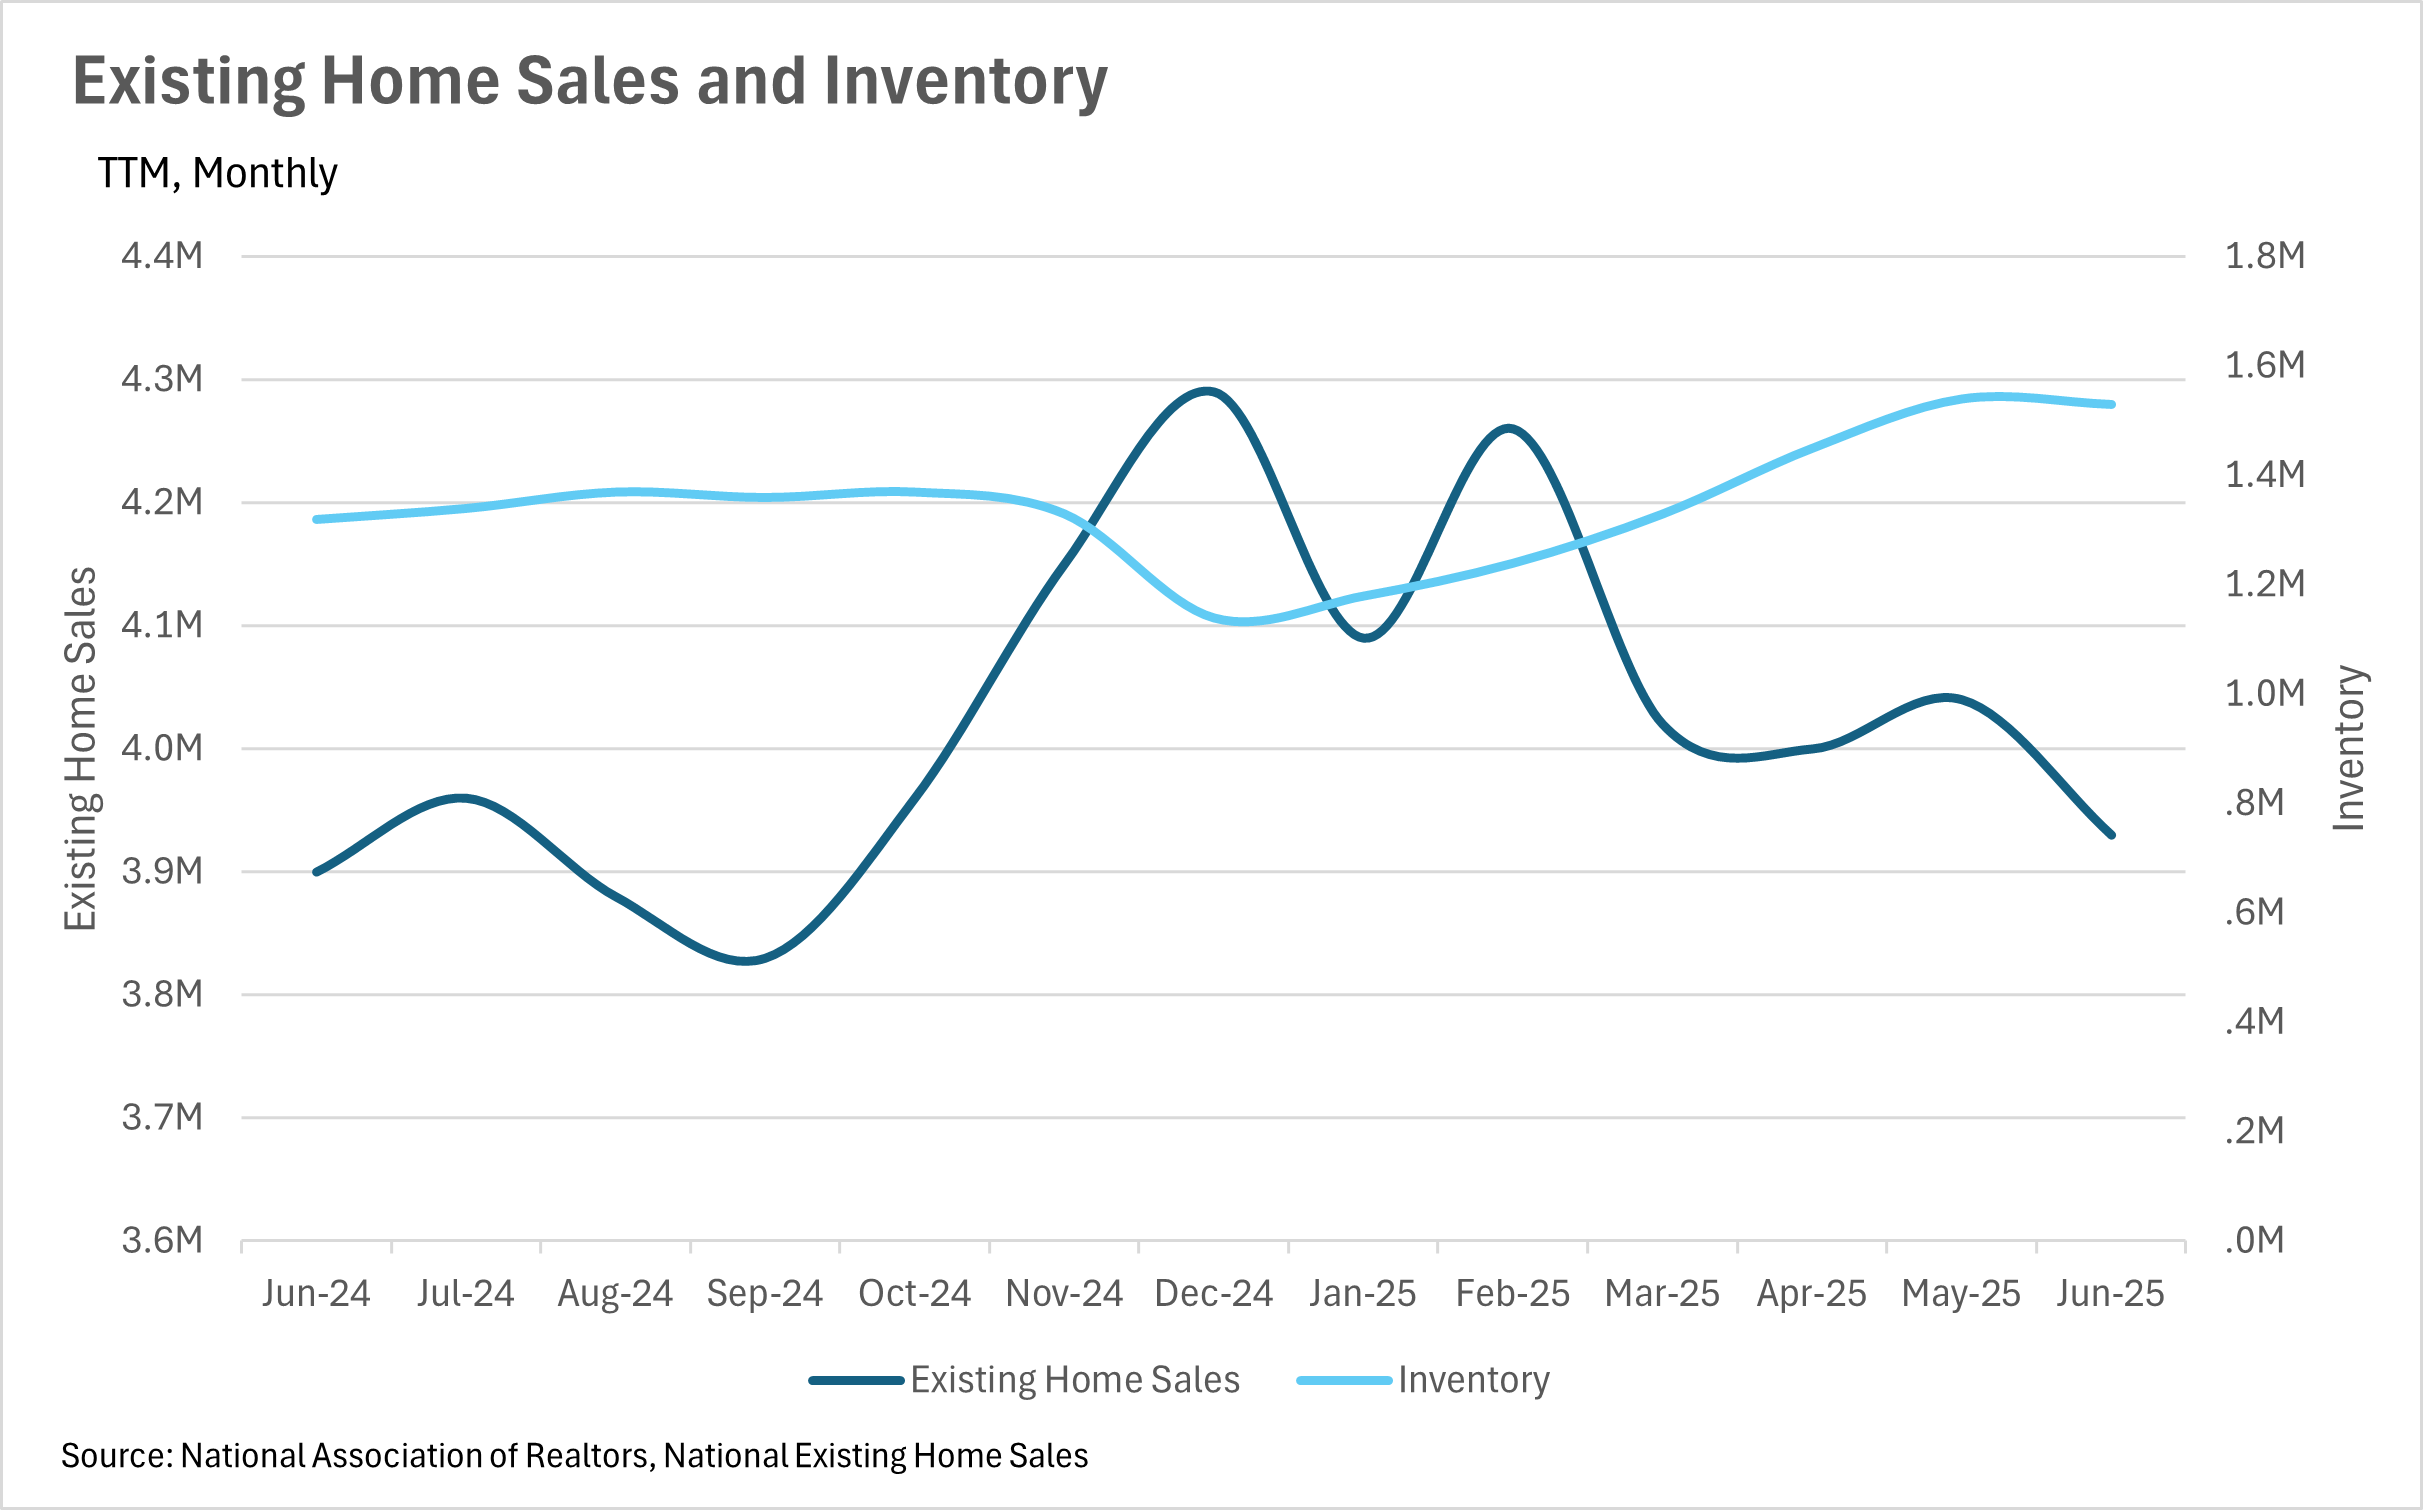
The trend of growing inventories has continued this month, with 15.91% more inventory on the market in June on a year-over-year basis. This growth in inventories can be attributed to the fact that the new homes are hitting the market at a much faster rate than new buyers are entering the market. In June, we saw a 0.77% increase in the number of existing homes sold on a year-over-year basis, while at the same time, we saw a 7.25% increase in the number of new listings hitting the market. Although there are still some buyers entering into the market every month, there is still a rather large contingent of people holding out until rates come back down.
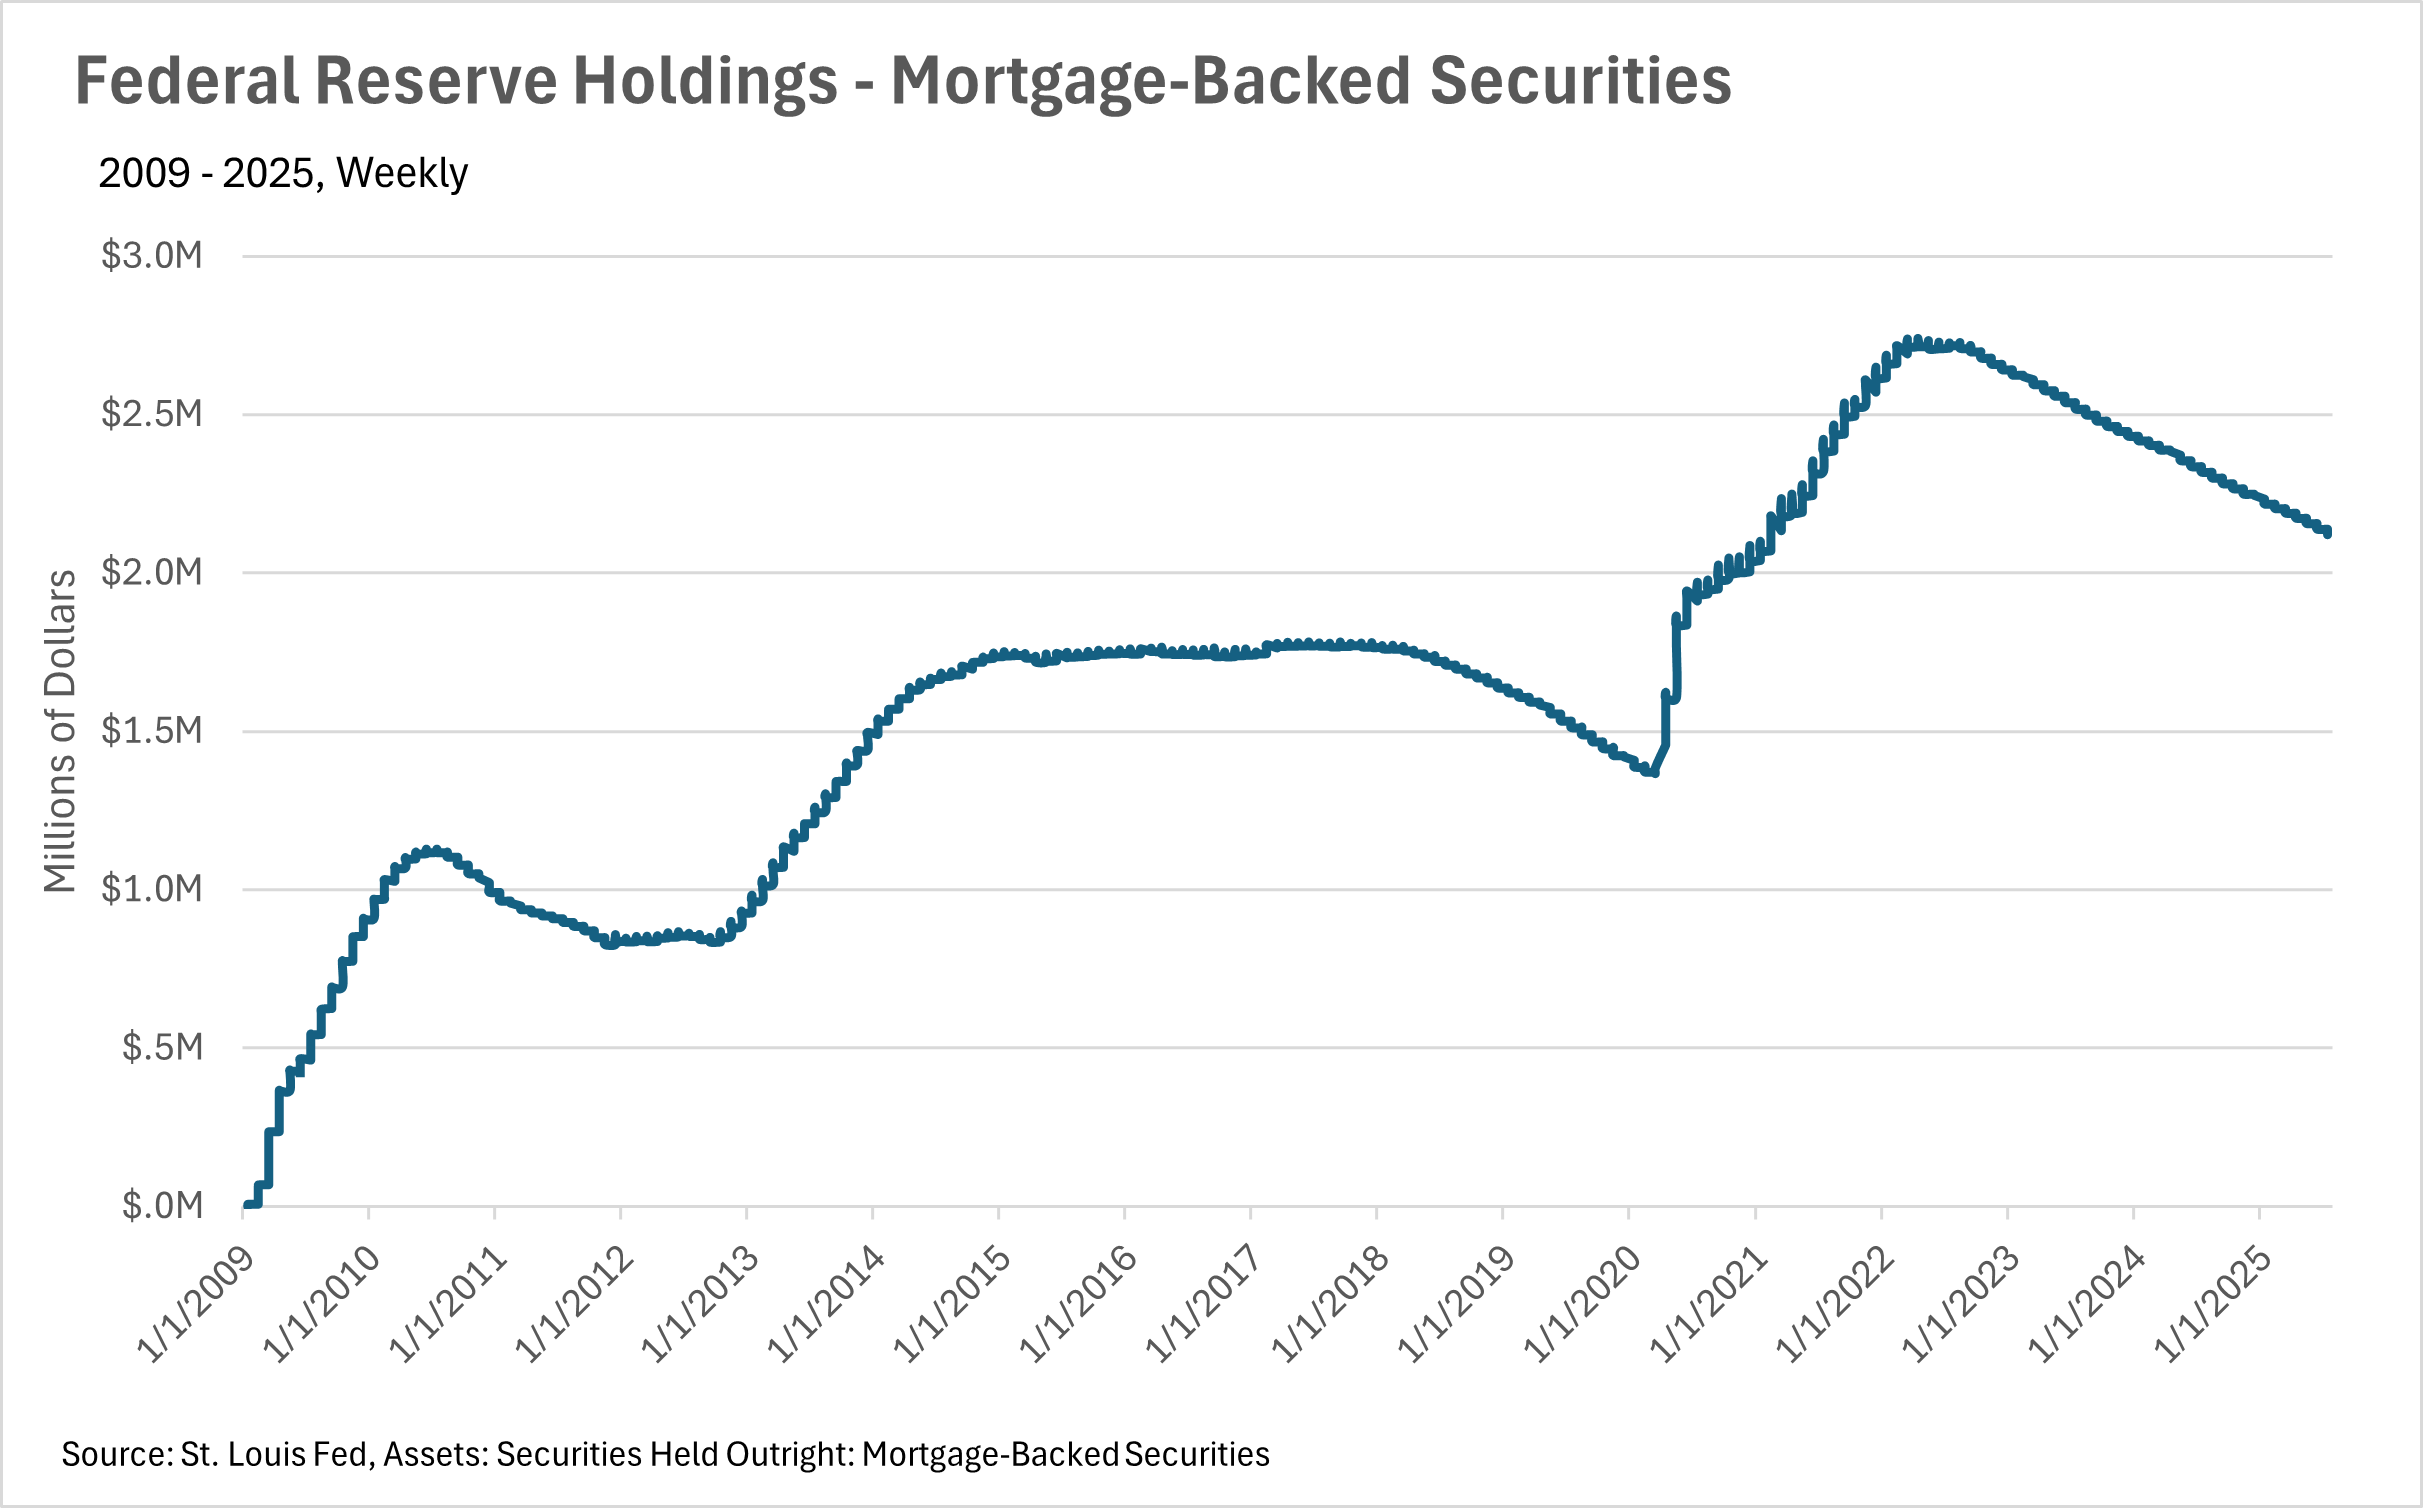
This past month, we saw the Fed hold rates steady once again, as they brace for the consequences of the newly minted tariff policies that went into effect in early August. Although inflation data has led many to believe that we need to see substantial rate cuts in the not-so-distant future, Fed officials are incredibly concerned about the potential impacts of the freshly enacted tariff policy. Additionally, the Fed has a dual mandate; it’s responsible for controlling inflation and promoting maximum employment. At this point in time, we’re seeing relatively low inflation, and a very low unemployment rate, so Fed officials seemingly aren’t in a hurry to cut the federal funds rate.
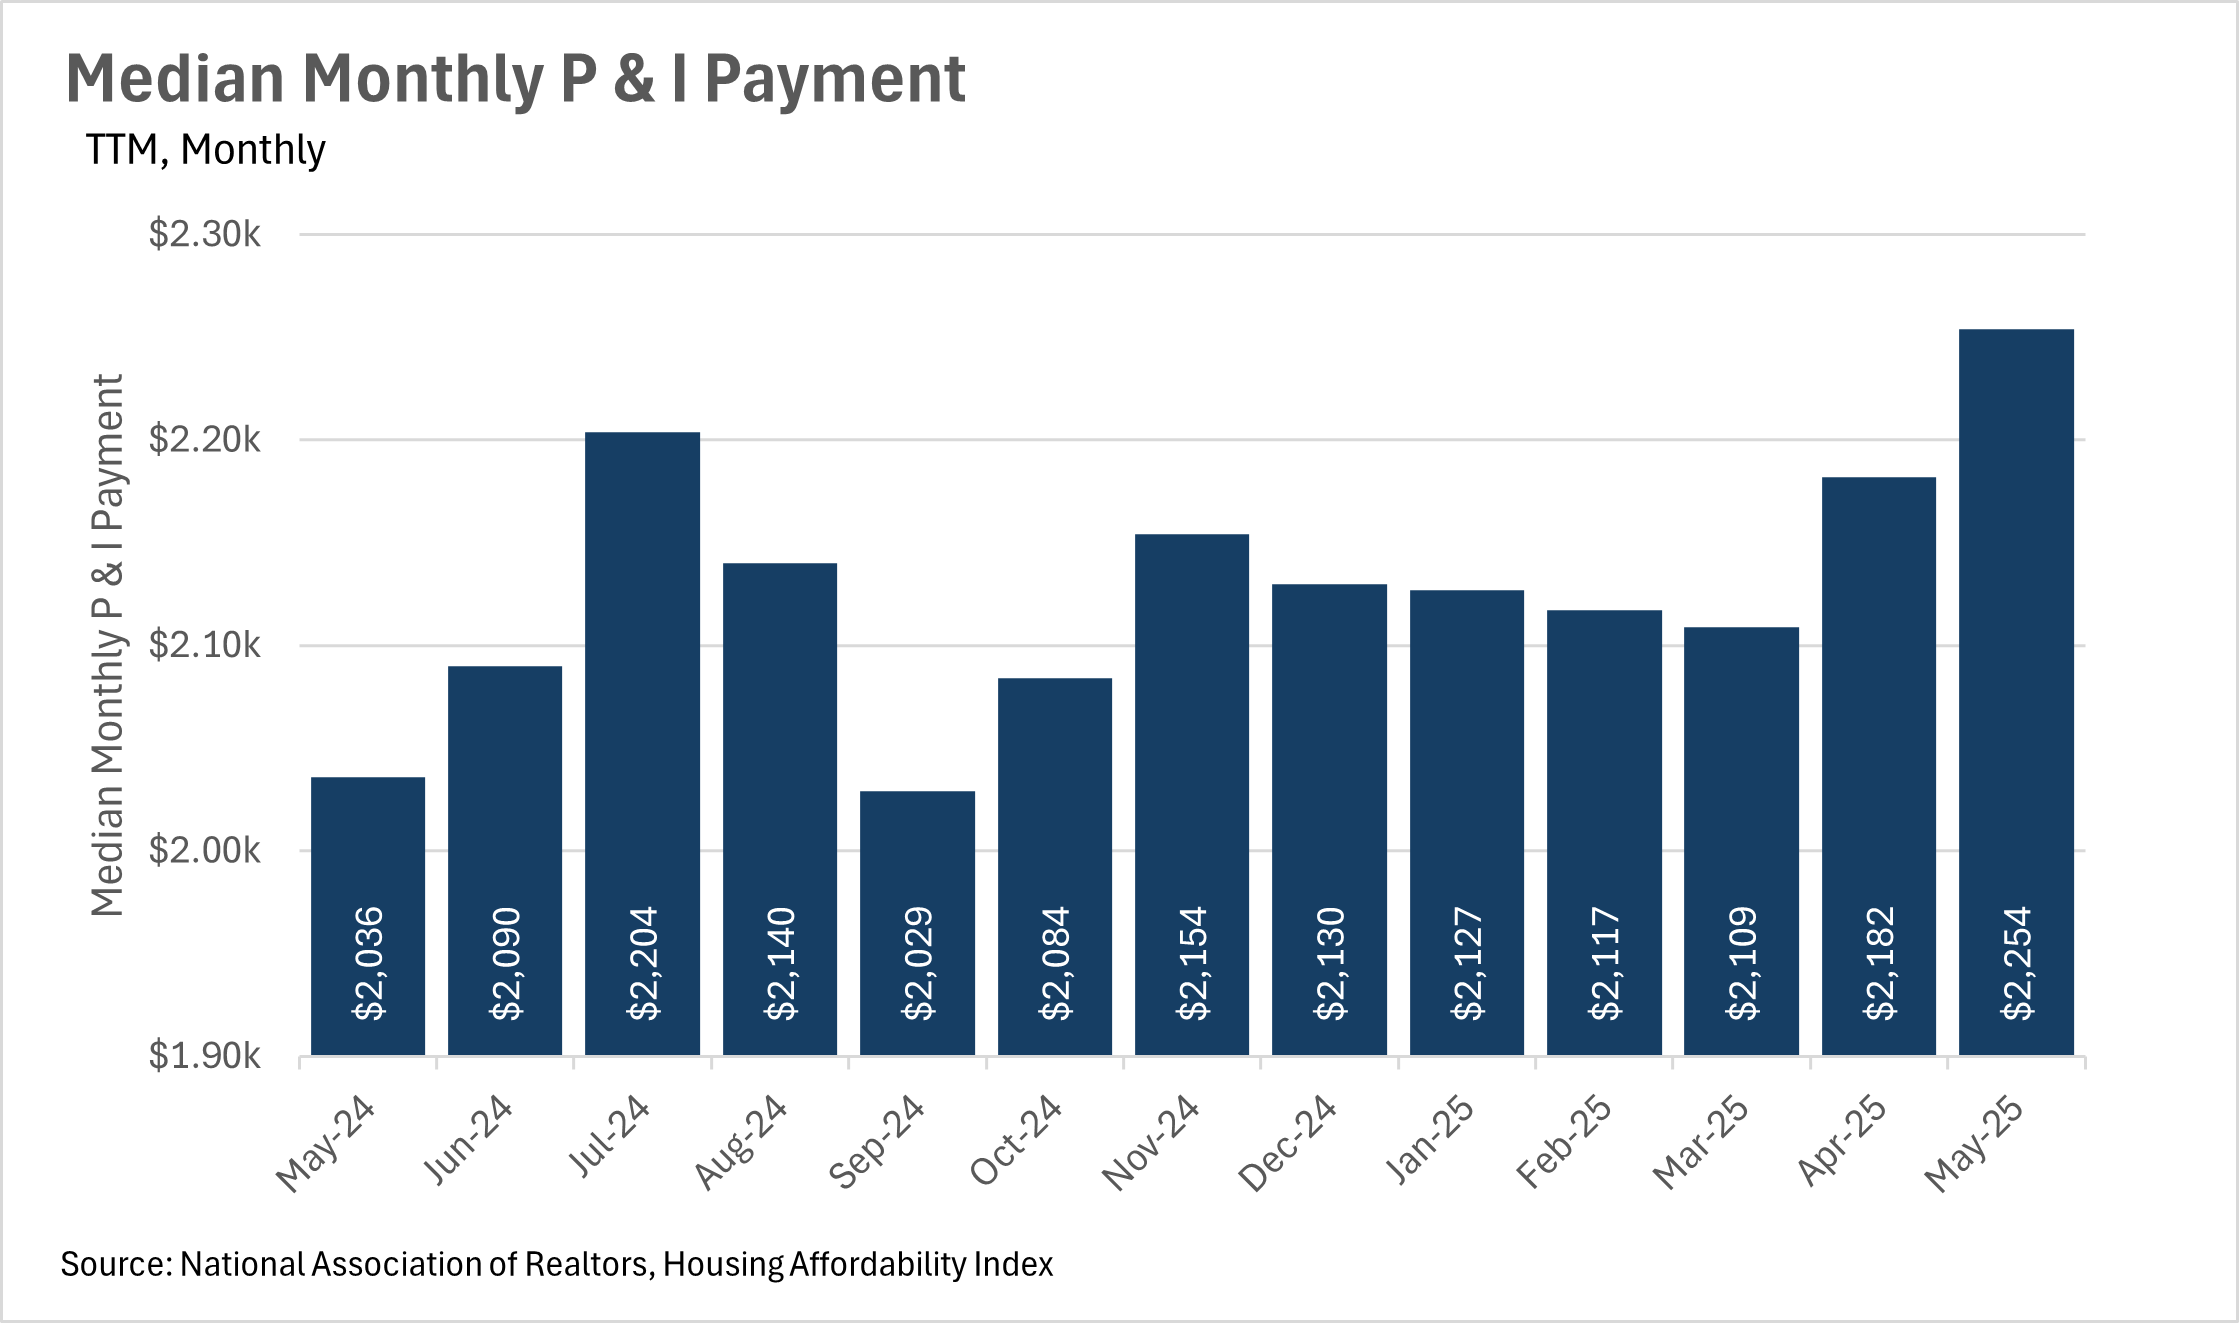
It probably isn’t much of a surprise that inventories are building and median sale prices have remained relatively stagnant, given the lack of movement in rates. Many believe that there is a very large contingent of people who simply aren’t willing to pay a comparatively very high interest rate to purchase a home, especially given that many have locked into rates in the 2-4% range on existing homes. The consistently high mortgage rates that we’ve seen have led people to stay in their homes for longer, resulting in more sellers on the market than buyers. However, we might see some movement if we see some positive commentary from the Fed in the upcoming FOMC meeting.
However, it’s important to remember that this is what we’re seeing at a national level. Oftentimes, what we see in California can be quite a bit different than the nation as a whole. We’ve done a deep dive into California markets in the local lowdown section below.
Note: You can find the charts/graphs for the Local Lowdown at the end of this section.
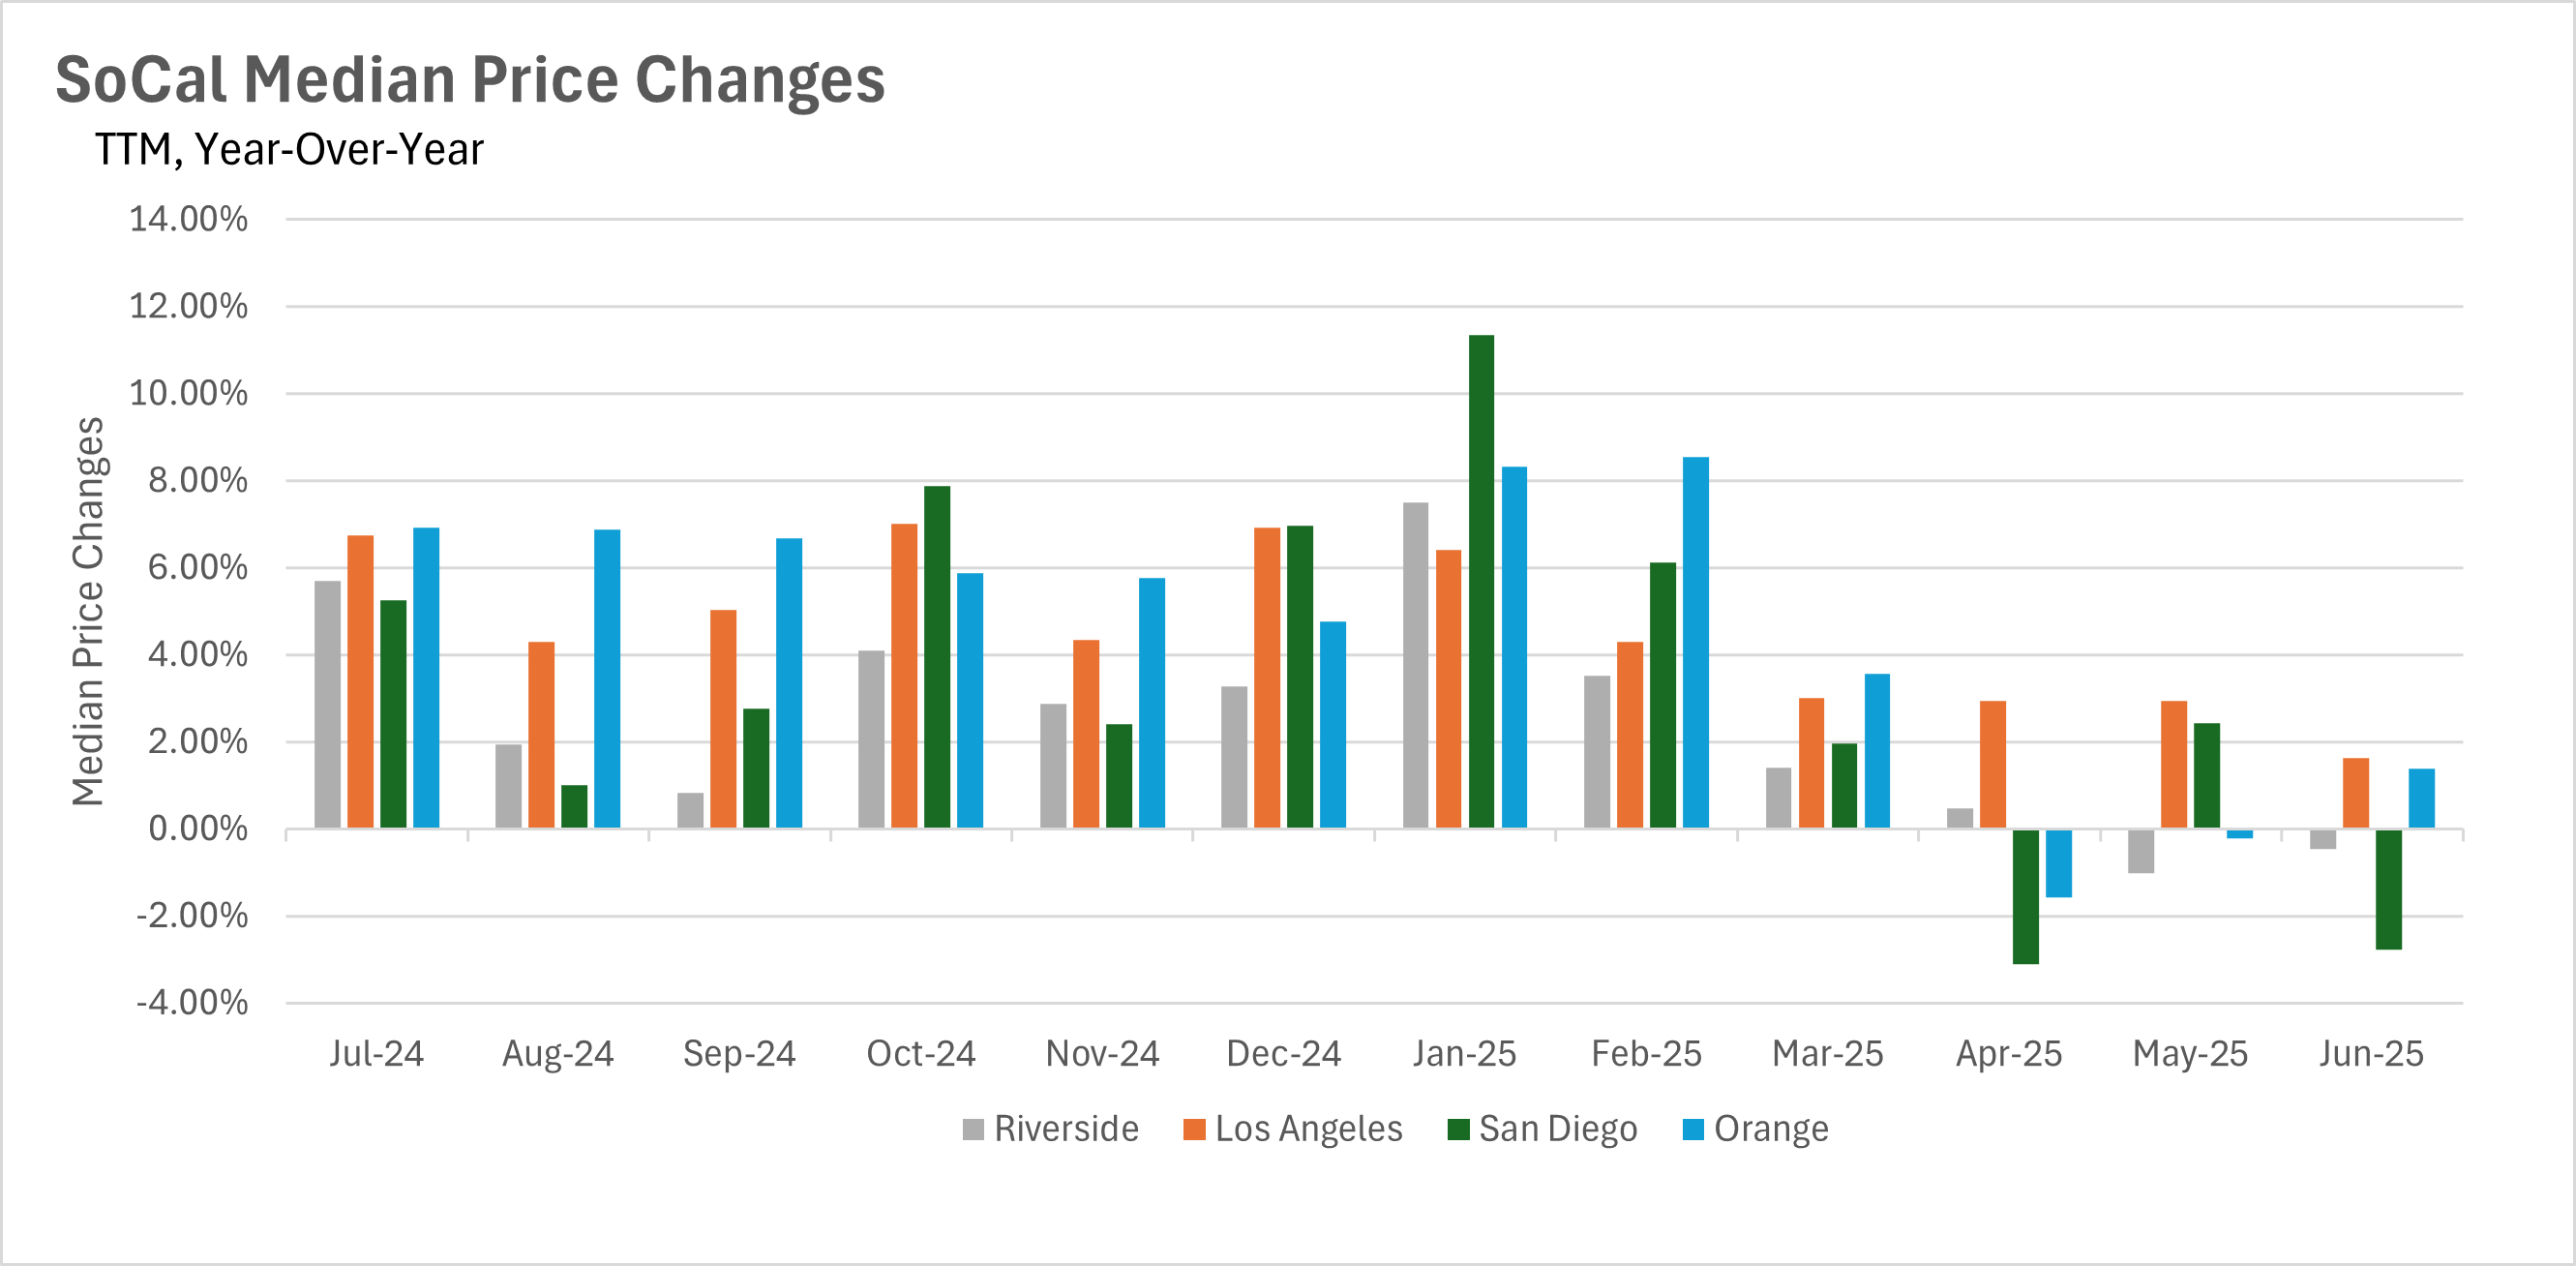
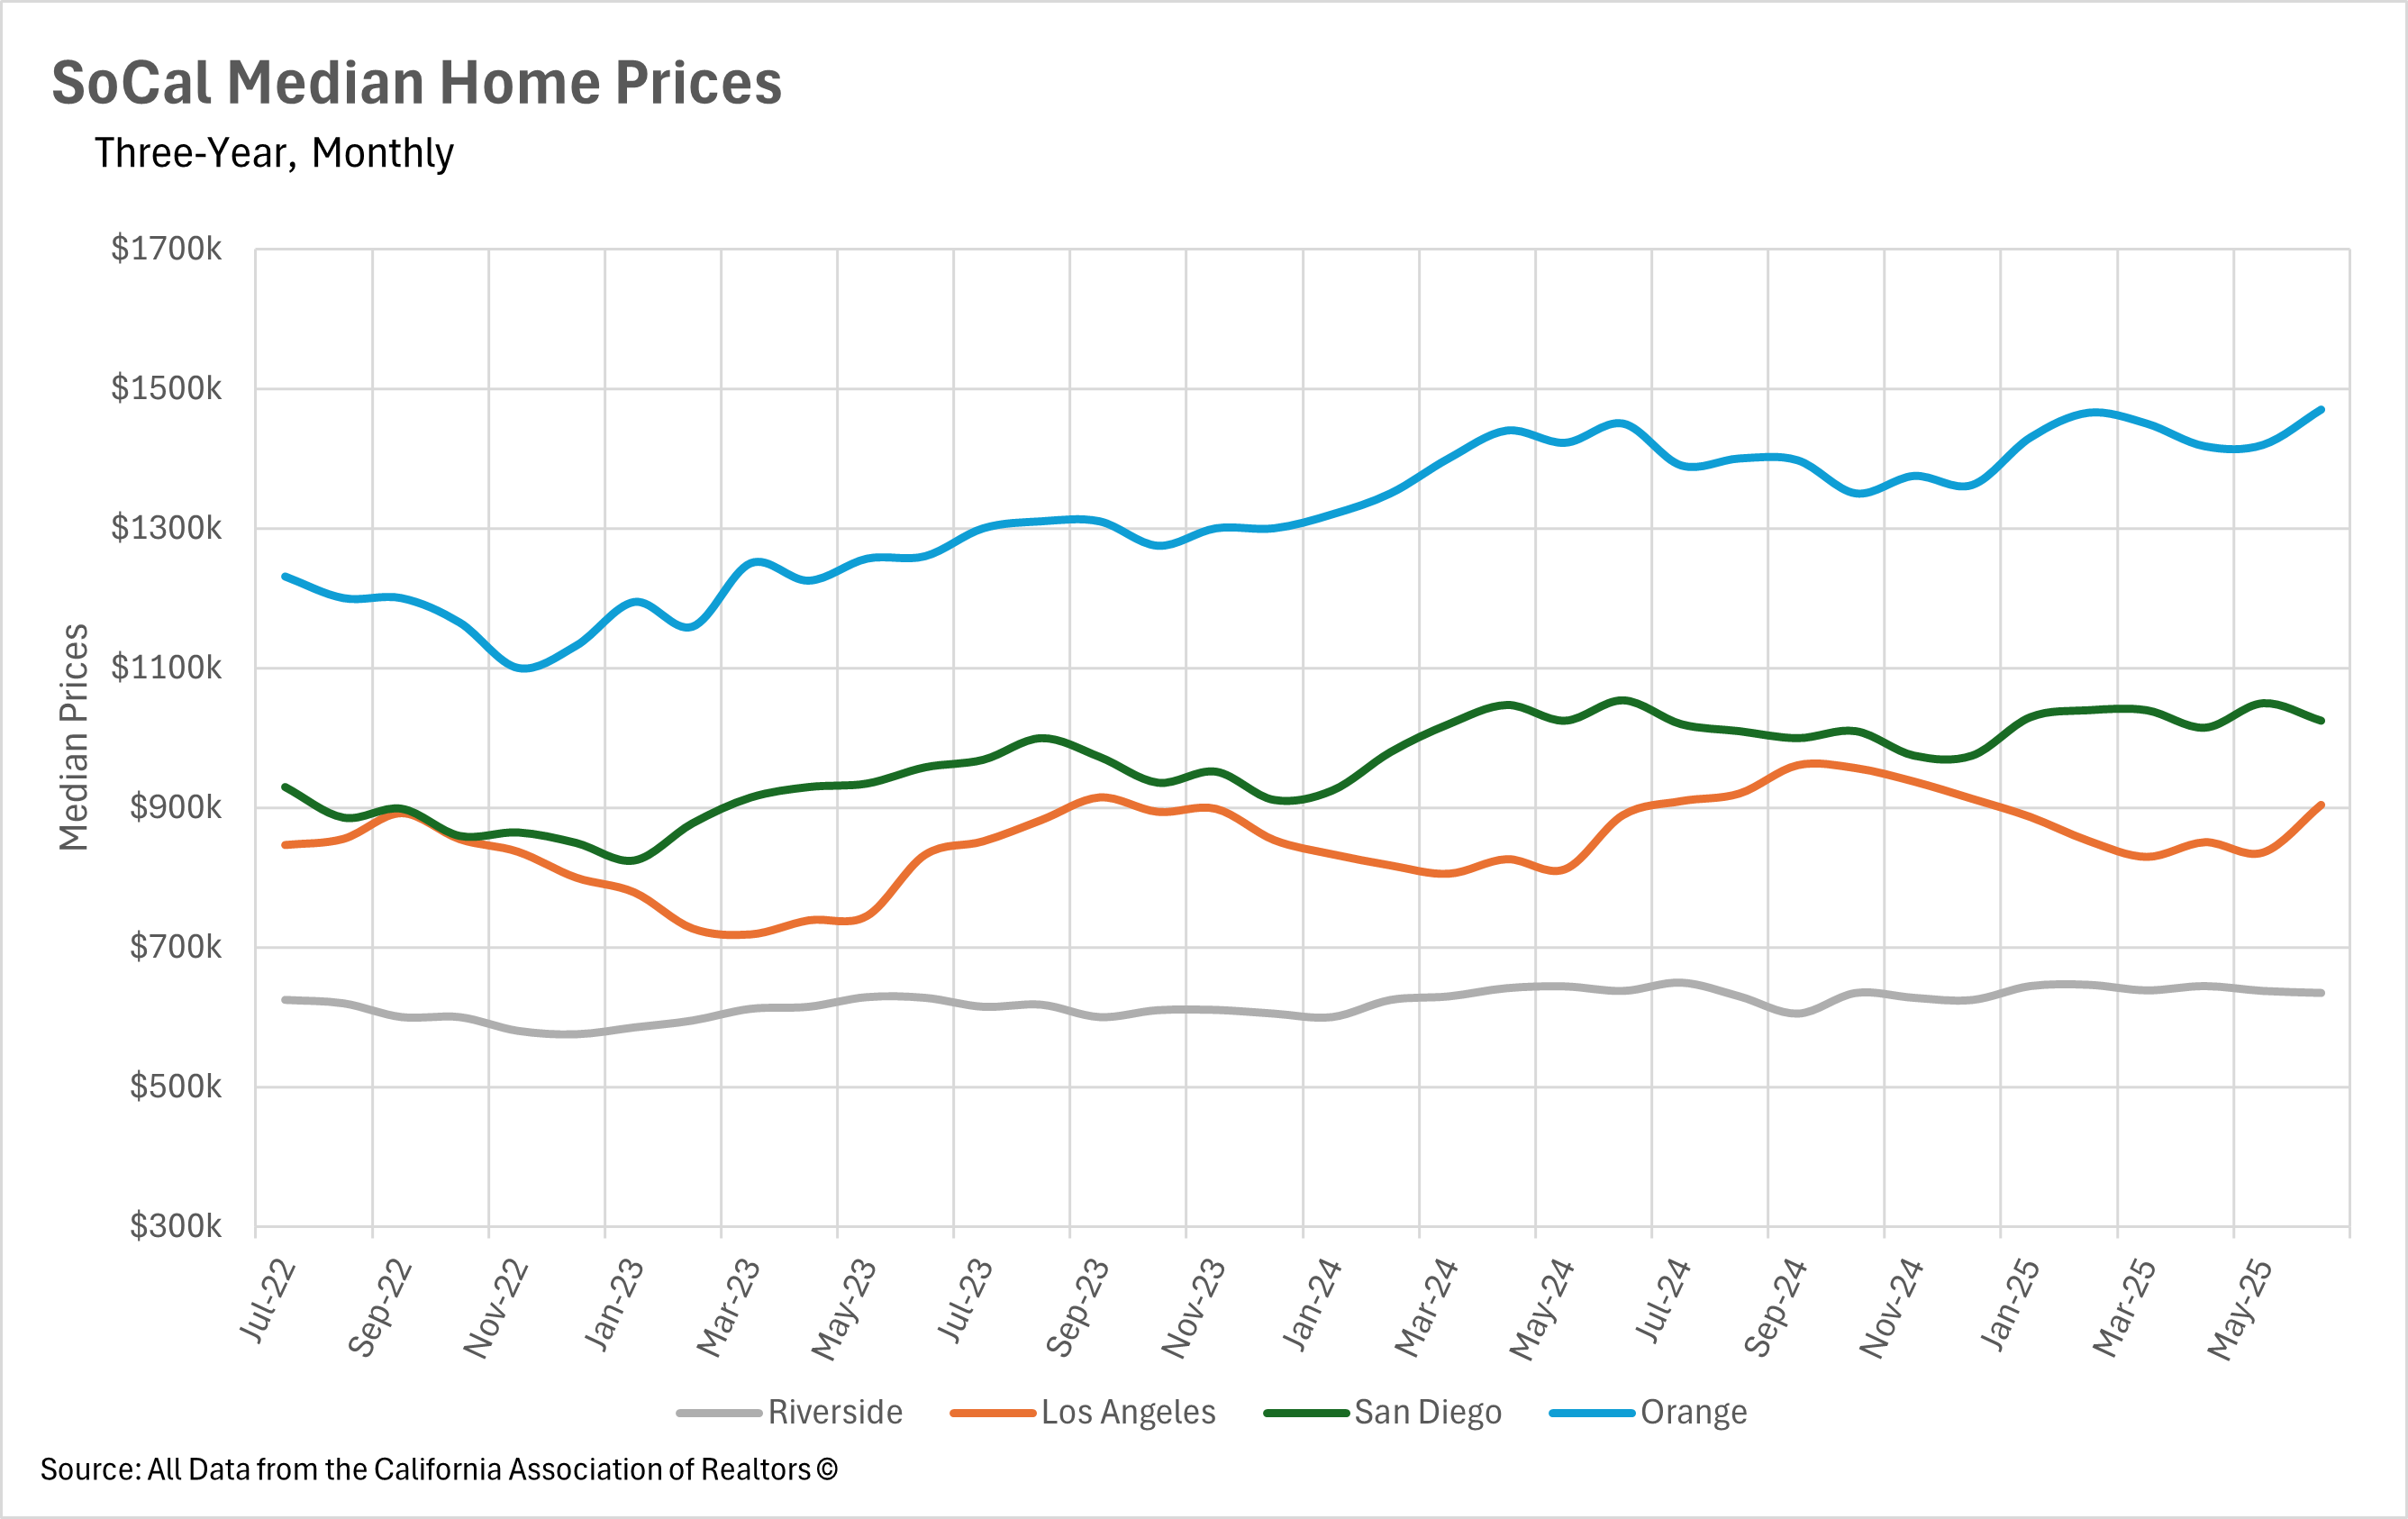
Southern California's real estate markets are displaying unprecedented price volatility and regional divergence as we move through mid-2025. Los Angeles County experienced the most dramatic shift, with median prices jumping from $835,480 in May to $903,650 in June, a remarkable monthly increase of over $68,000, though year-over-year growth has decelerated to just 1.63%. In stark contrast, San Diego County has seen its market cool considerably, with June prices declining 2.77% year-over-year to $1,025,000 after earlier explosive growth including an 11.35% increase in January. Orange County has shown signs of stabilization, returning to positive growth with a modest 1.38% year-over-year increase to $1,470,000 in June, breaking a two-month streak of declining prices. Riverside County continues its downward trajectory with a -0.47% decline in June to $635,000. This divergence reflects varying local supply-demand dynamics, with some markets finding new equilibrium points while others continue to adjust to dramatically changed conditions.
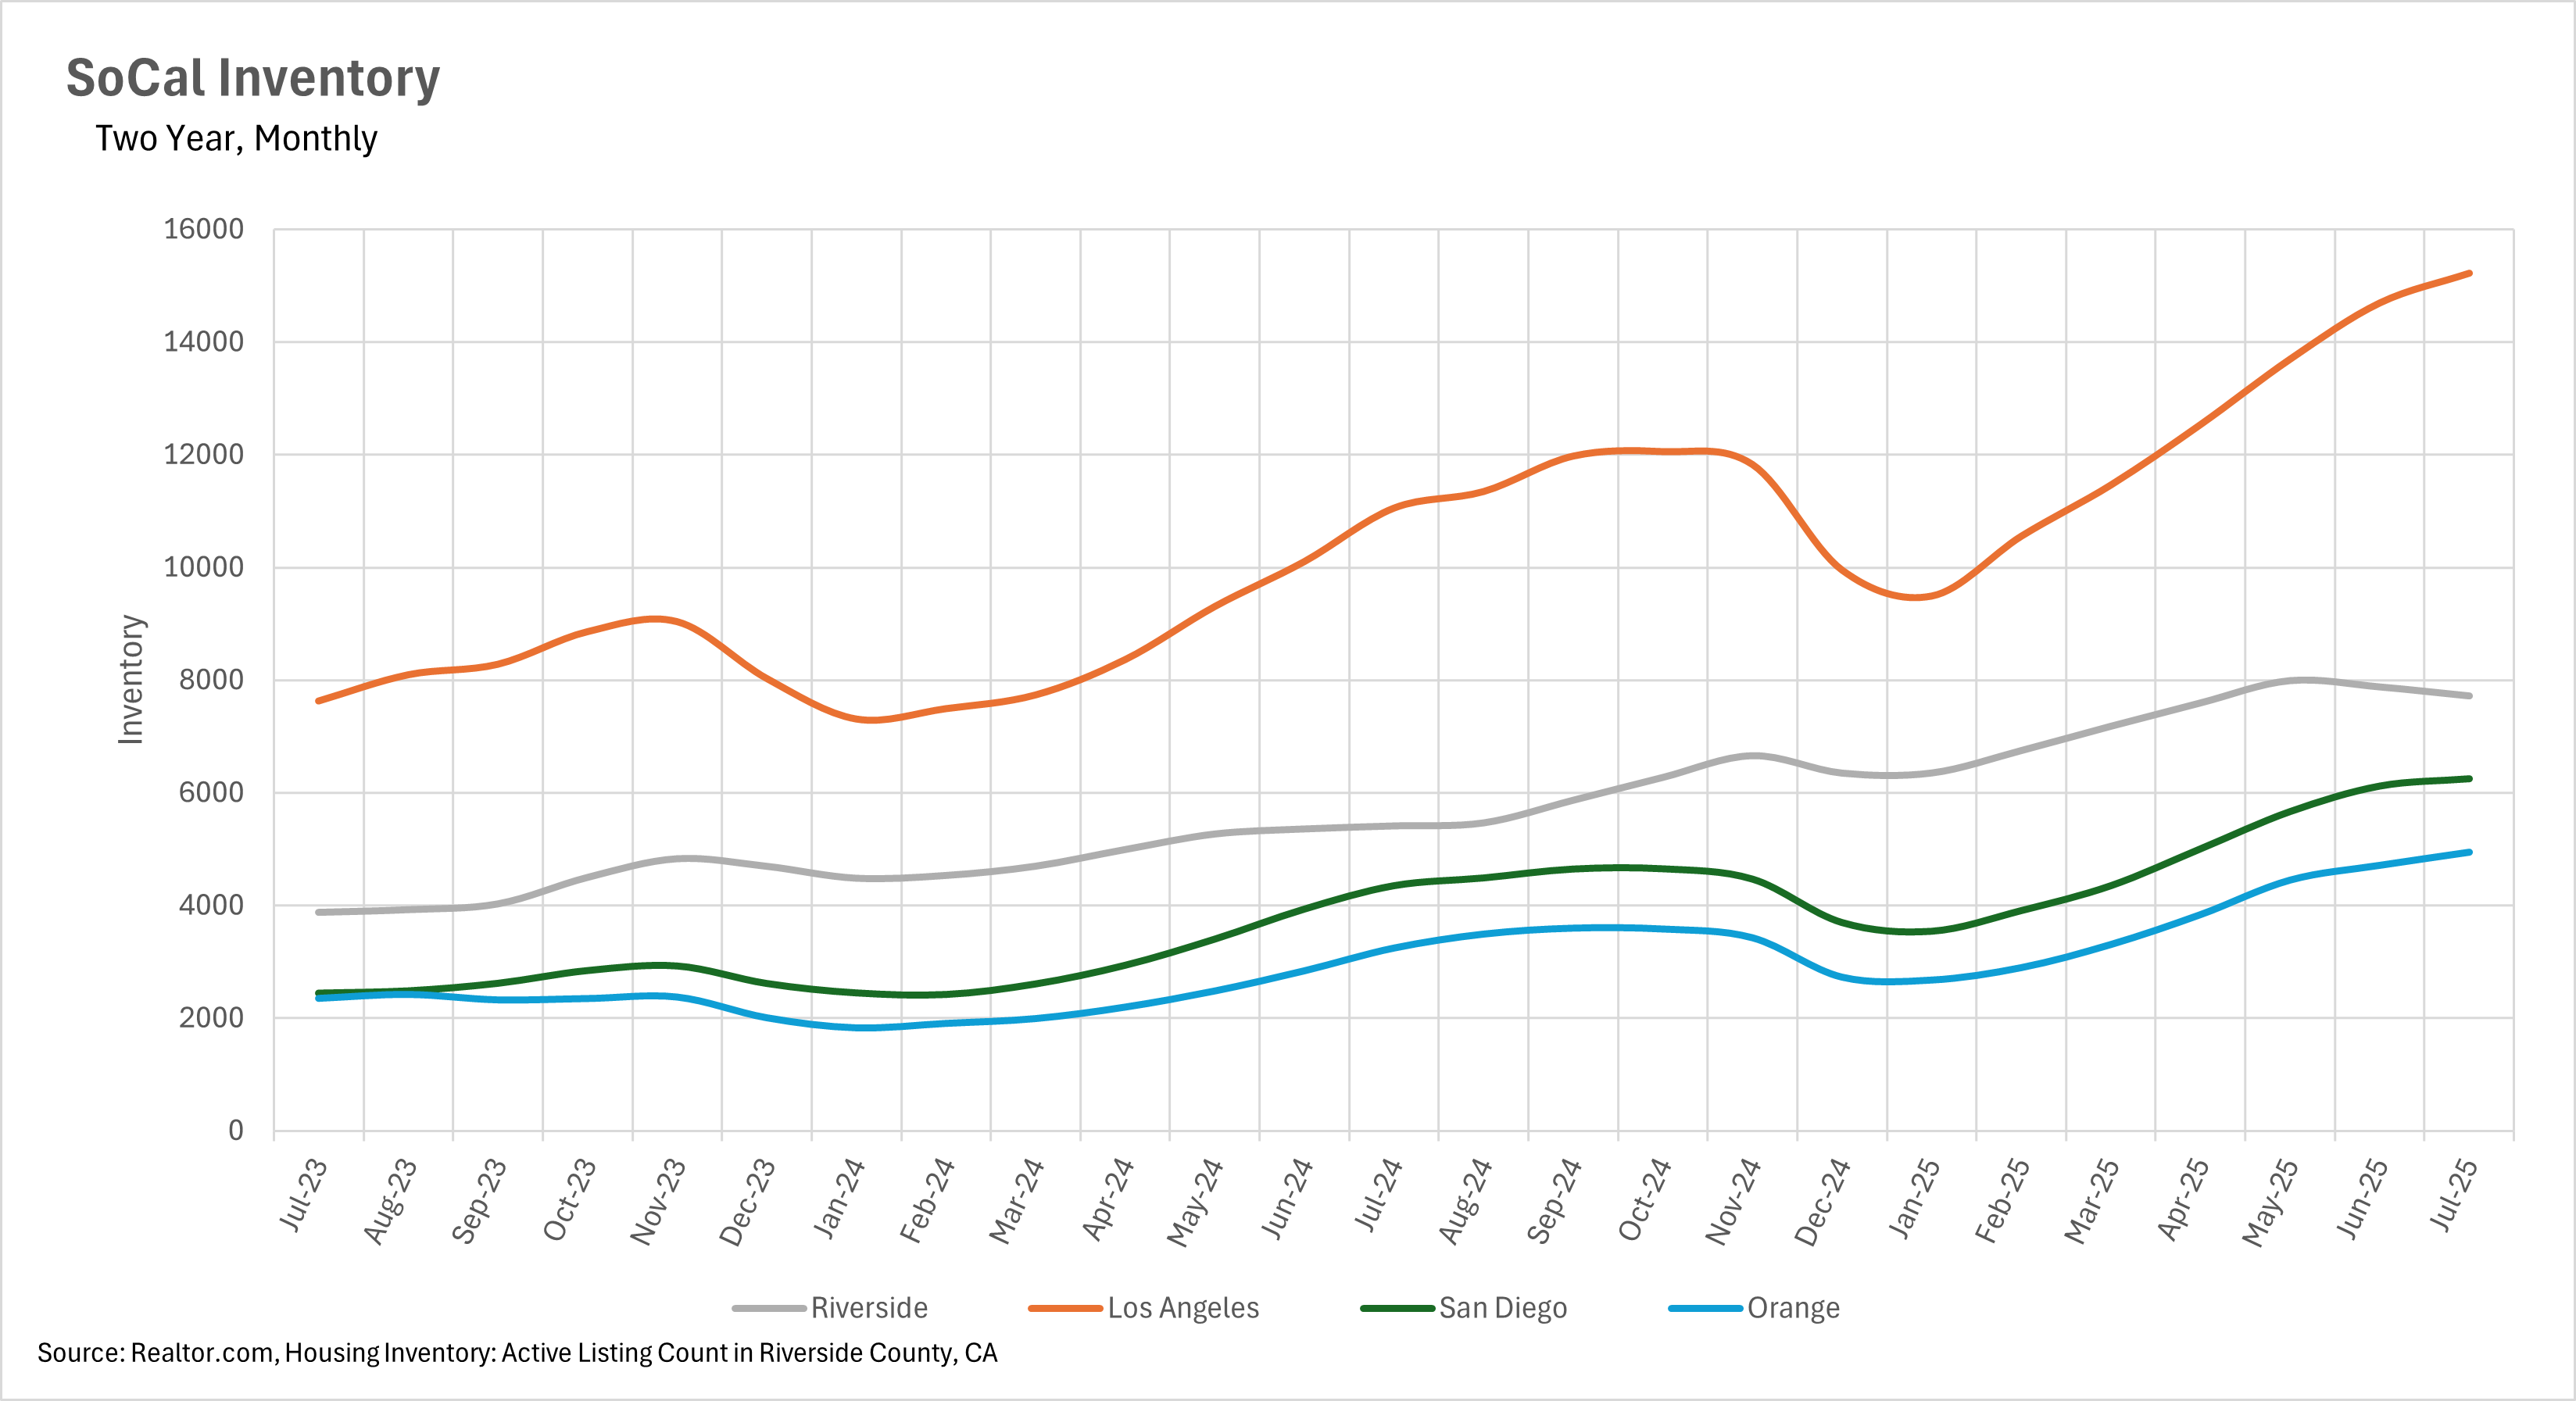
The defining characteristic of Southern California's 2025 real estate market has been the unprecedented surge in available housing inventory across all counties, reaching levels not seen in recent memory. Orange County leads this trend with a staggering 52.42% year-over-year increase in July, reaching 4,952 single-family homes on the market. Riverside County follows closely with a 51.59% annual increase to 7,721 homes in July, while San Diego County shows a massive 43.53% jump with 6,245 active listings. Los Angeles County, despite having the largest absolute inventory at 15,219 homes in July, shows a more moderate but still substantial 37.68% year-over-year increase. This flood of new listings represents a structural shift rather than seasonal variation, as the growth has persisted month after month throughout 2025. The sustained inventory buildup has fundamentally altered the balance of power between buyers and sellers, giving purchasers unprecedented choice and negotiating leverage that simply wasn't available during the supply-constrained conditions of recent years.
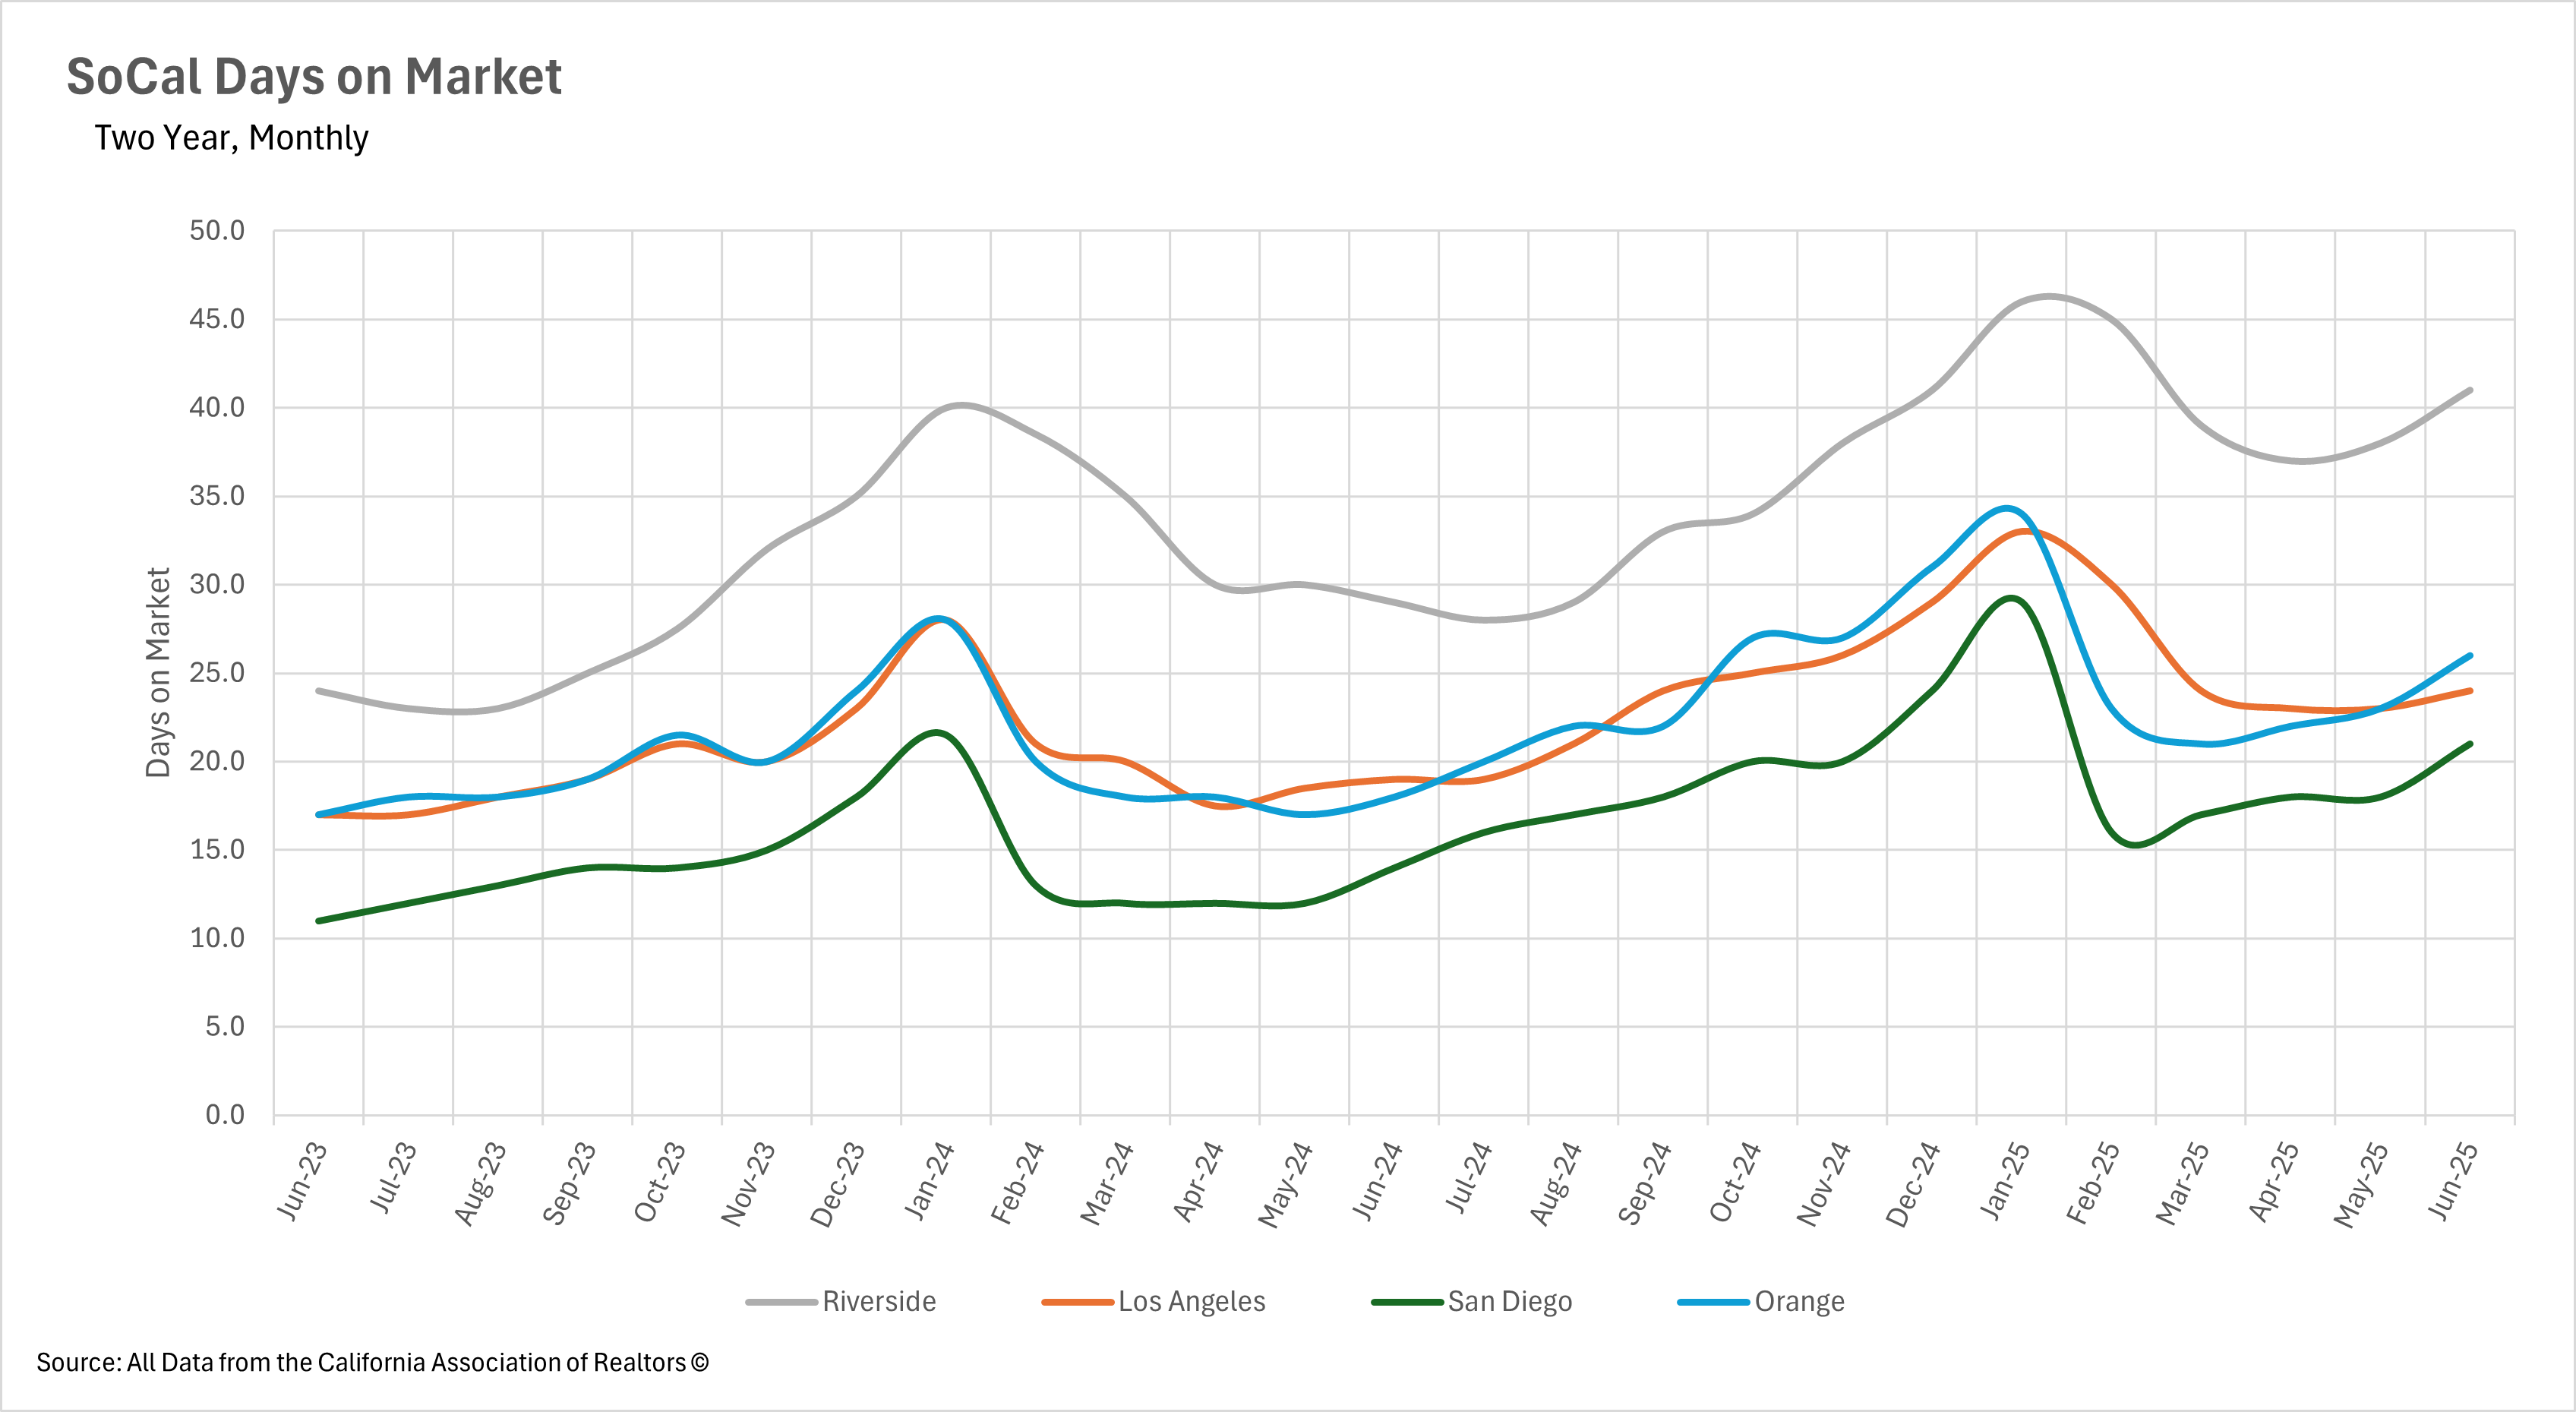
The dramatic increase in available inventory has translated directly into extended marketing periods across all Southern California counties, with properties taking significantly longer to sell than in previous years. Orange County has experienced the most pronounced change, with homes now spending a median of 26 days on the market, a substantial 44.44% increase from June 2024's 18 days. Los Angeles County shows homes taking 24 days to sell, representing a 26.32% year-over-year increase, while San Diego properties spend 21 days on market, up 50% from last year. Riverside County homes take the longest at 41 days, though this represents a more moderate 23.33% annual increase. These extended timelines reflect the new market reality where buyers, armed with significantly more choices, are taking a more deliberate and methodical approach to their home purchases. The trend toward longer selling times continues to accelerate in most markets, indicating that this isn't a temporary seasonal adjustment but rather a fundamental shift in how real estate transactions occur in the region.
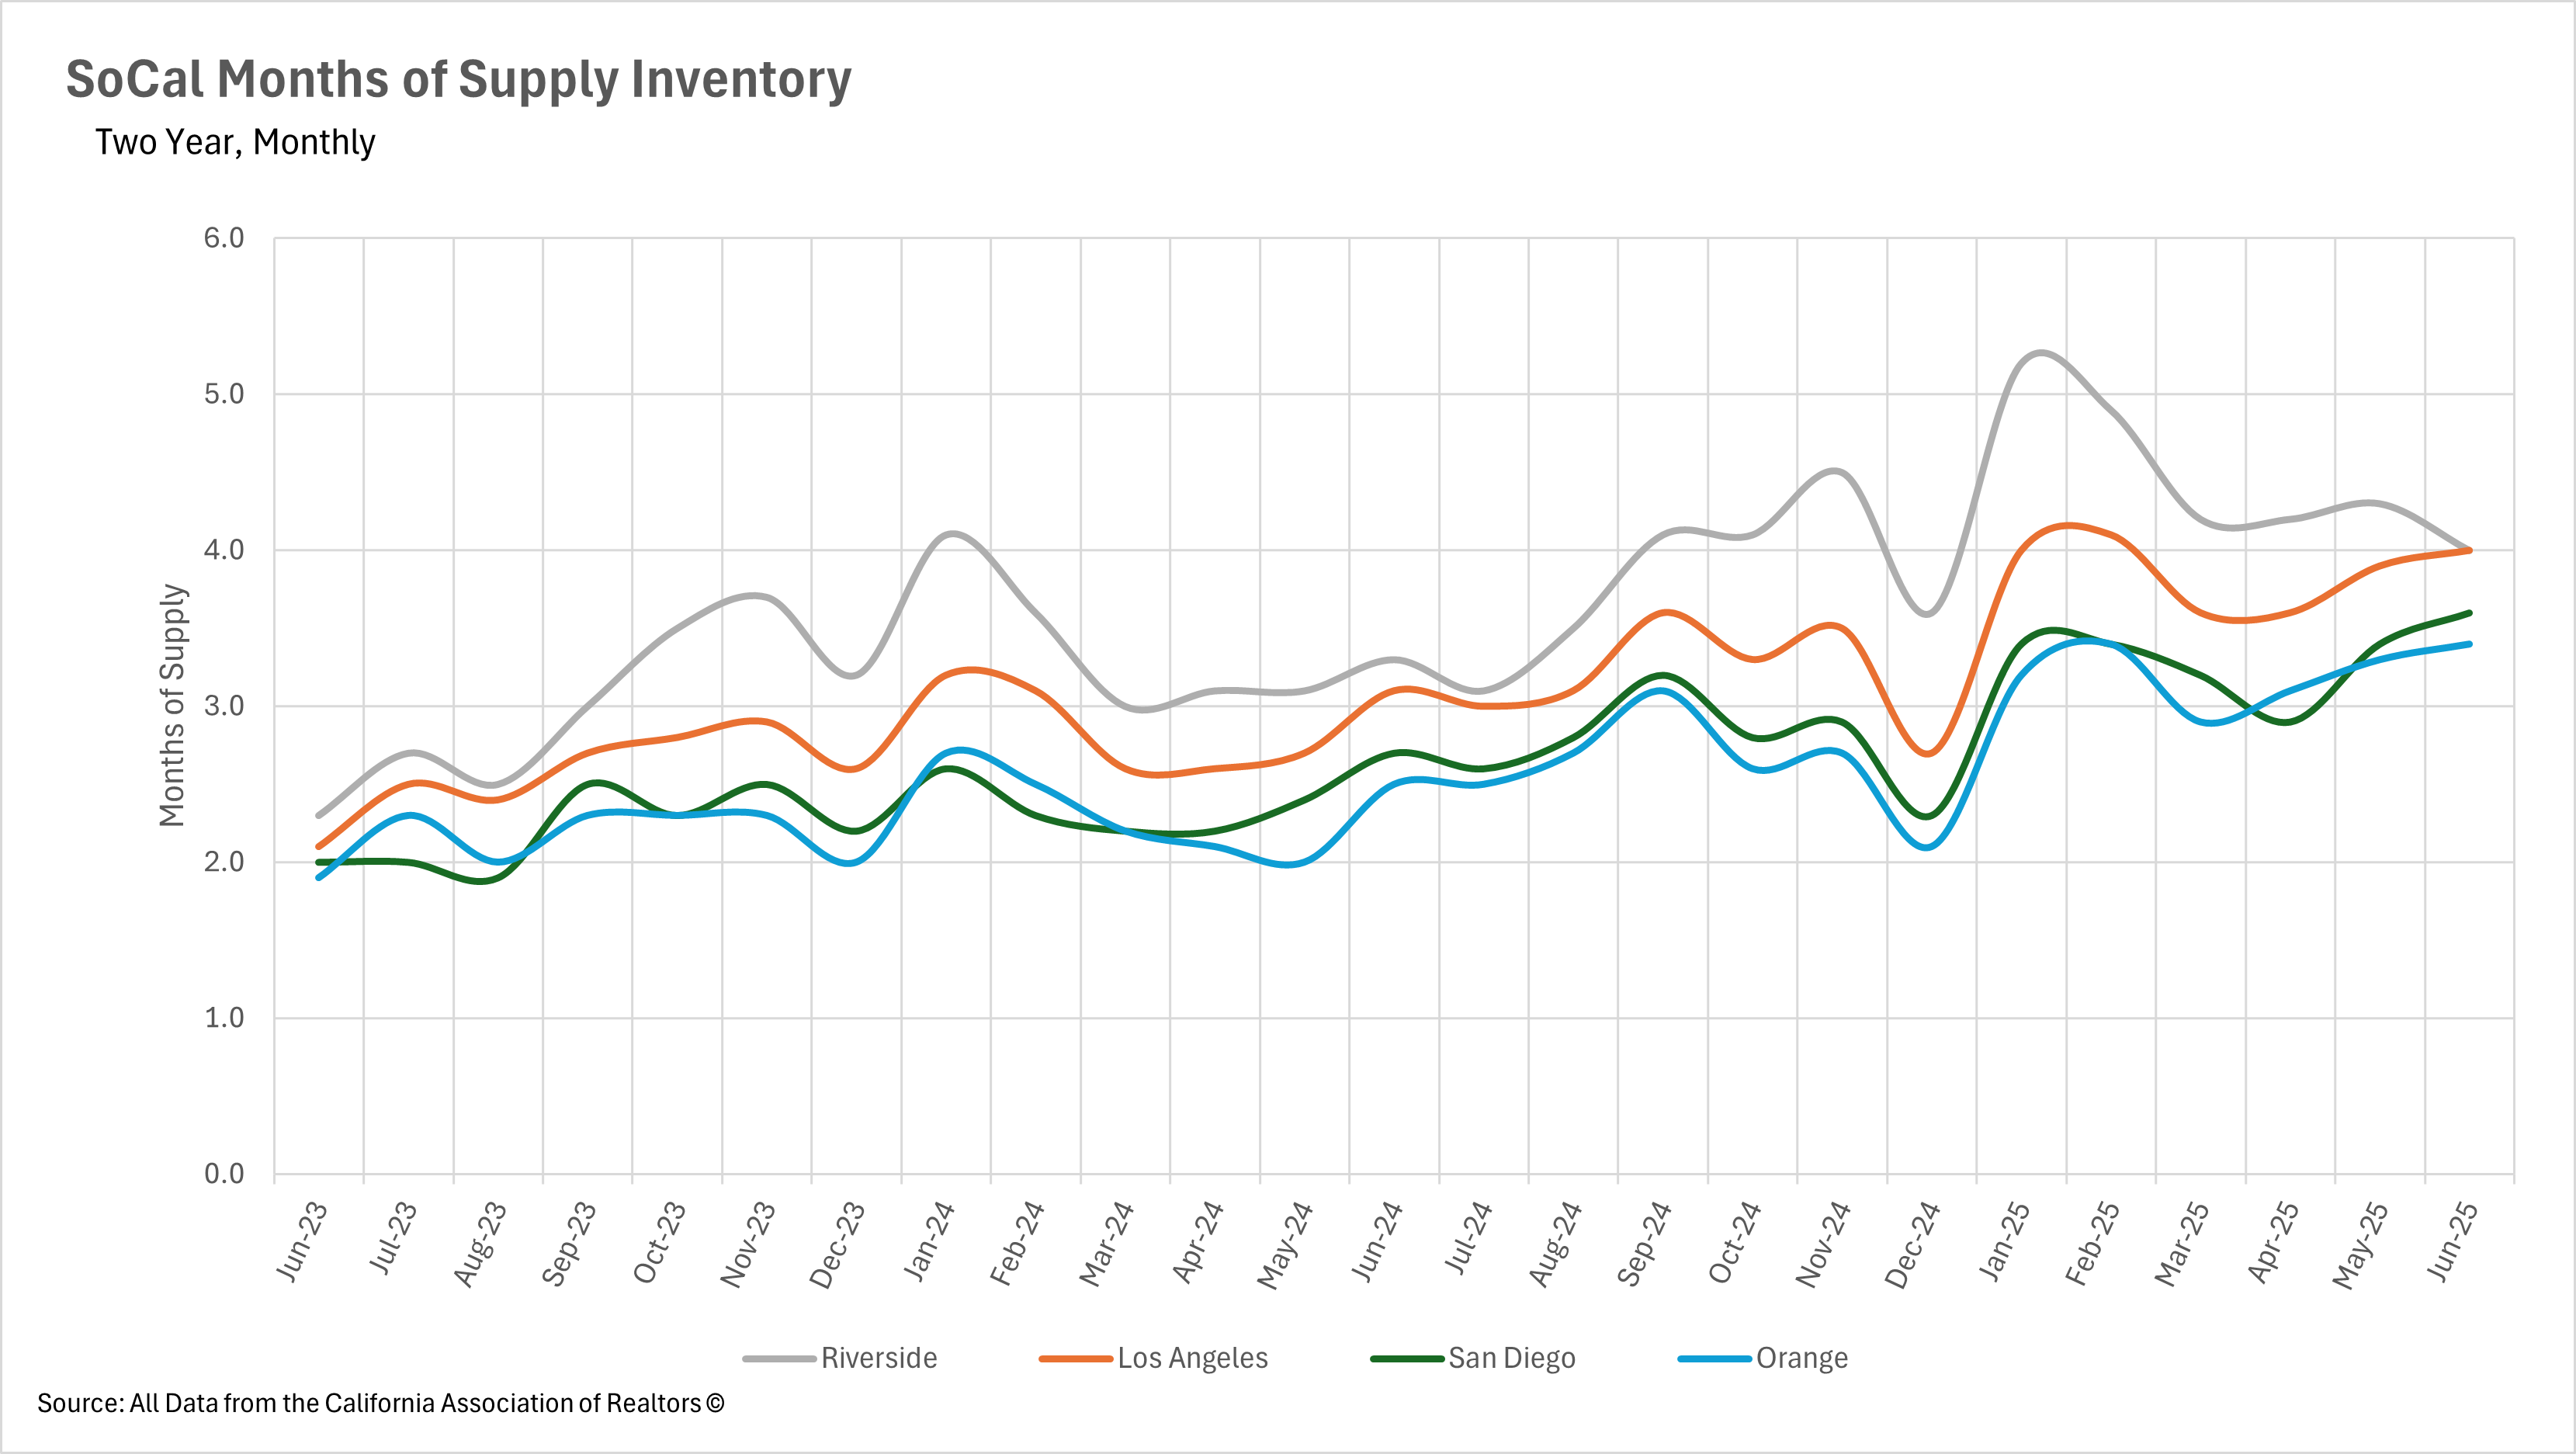
The most significant transformation in Southern California real estate is the complete establishment of buyer's market conditions across all major counties, representing a dramatic reversal from the seller-dominated landscape of previous years. When measuring Months of Supply Inventory (MSI), with three months historically representing a balanced California market, every county now operates well above this threshold. Los Angeles and Riverside counties tie for the strongest buyer's market position at 4.0 months of supply each, representing substantial increases of 29.03% and 35.48% respectively compared to the same period last year. San Diego County sits at 3.6 months of supply, showing a 33.33% year-over-year increase and representing its transition into balanced-to-buyer-favoring territory. Orange County maintains a buyer's market at 3.4 months of supply, with a significant 36% annual increase. This fundamental shift means buyers now have unprecedented leverage in negotiations, time to make thoughtful decisions, and the ability to be highly selective in their purchases. For sellers, this new reality requires strategic adjustments in pricing, presentation, and realistic timeline expectations as the rapid-fire, multiple-offer environment of recent years has given way to a more deliberate, buyer-controlled marketplace.
Stay up to date on the latest real estate trends.

July 2026

A Closer Look at Dallas Rental Prices, Hidden Costs, and What Renters Need to Know Before Moving
June 2026
May 2026

April 2026
March 2026

February 2026
January 2026

Trusted Experts in the Palisades, Santa Monica, and Brentwood Real Estate Markets
You’ve got questions and we can’t wait to answer them.