Market Update Los Angeles
Note: You can find the charts & graphs for the Big Story at the end of the following section.
*National Association of REALTORS® data is released two months behind, so we estimate the most recent month’s data when possible and appropriate.
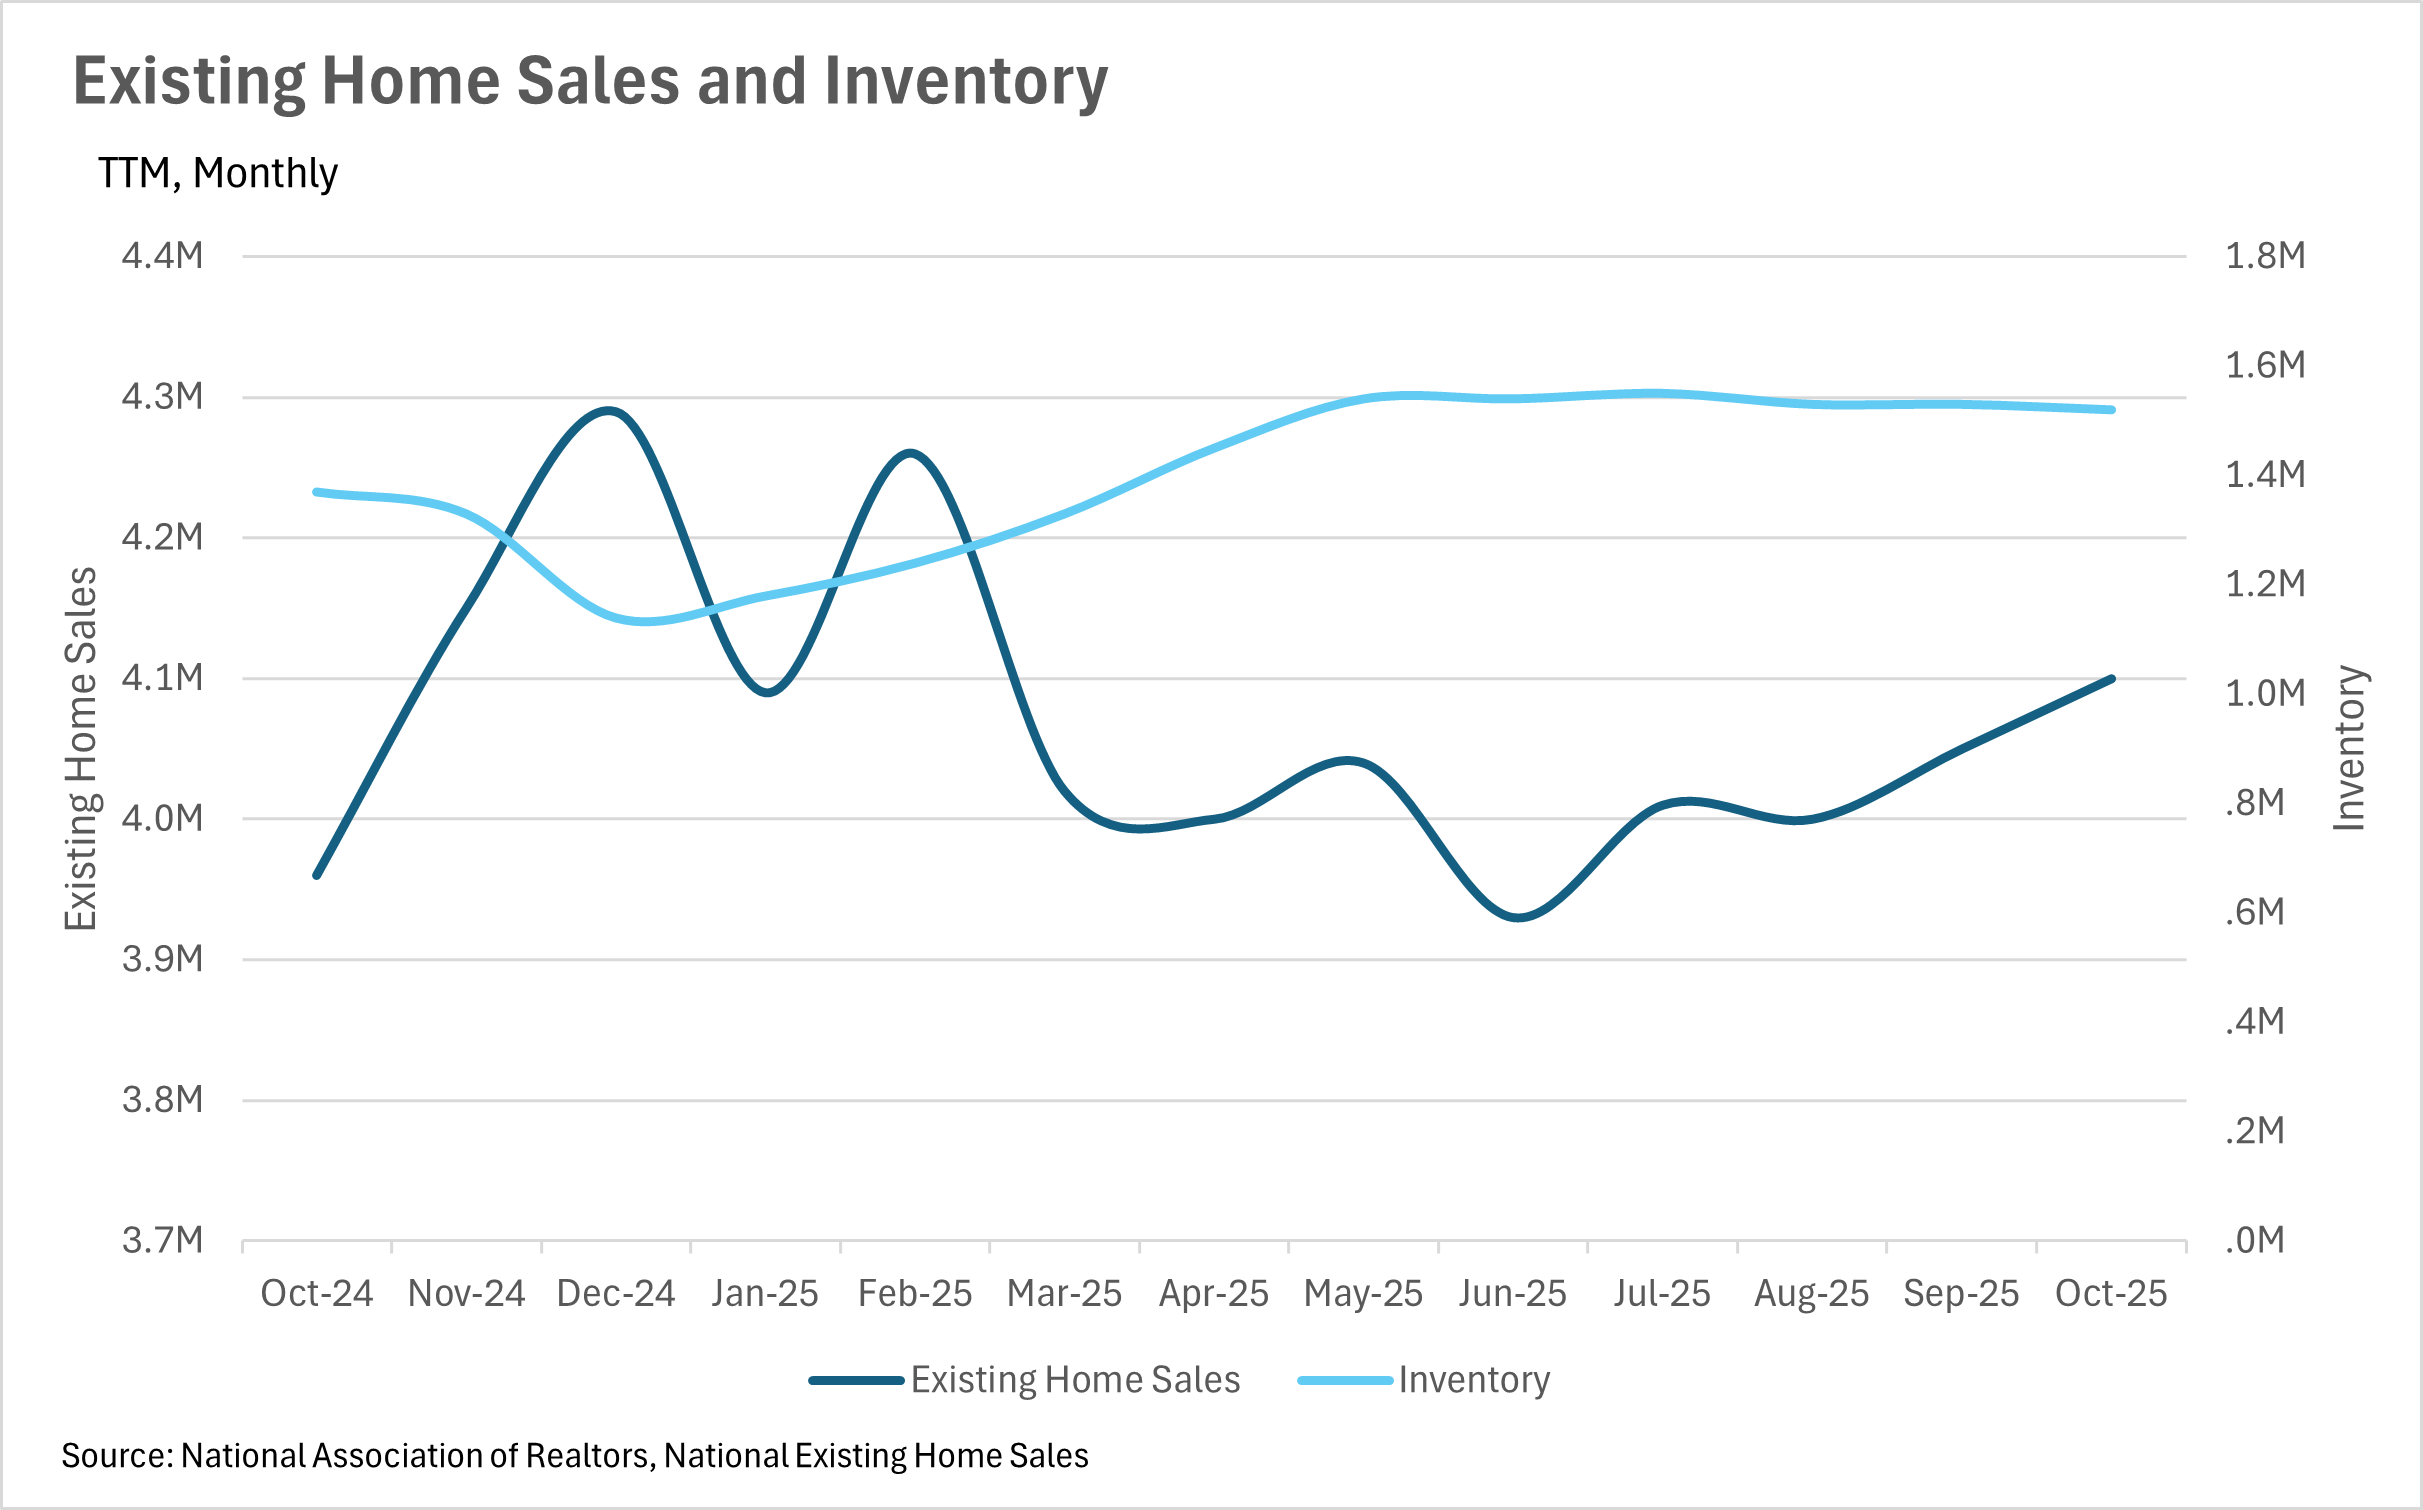
Unfortunately, we have yet to see mortgage rates drop below the 6% mark, as the Federal Reserve continues its cutting cycle, after its third consecutive cut to the federal funds rate in December. Although many are hopeful that we will continue to see rate cuts into 2026, the future of the federal funds rate is relatively uncertain. While there’s still roughly a month and a half before the next interest rate decision, CME’s FedWatch tool is predicting roughly a 25% chance that we see another rate cut in January. As we all know, the federal funds rate is the most important factor in the determination of interest rates, so paying attention to what the Fed is doing is pivotal! We’ll likely see an increase in the probability of another rate cut if some of the new/delayed economic data that’s coming out provides a cause for concern.
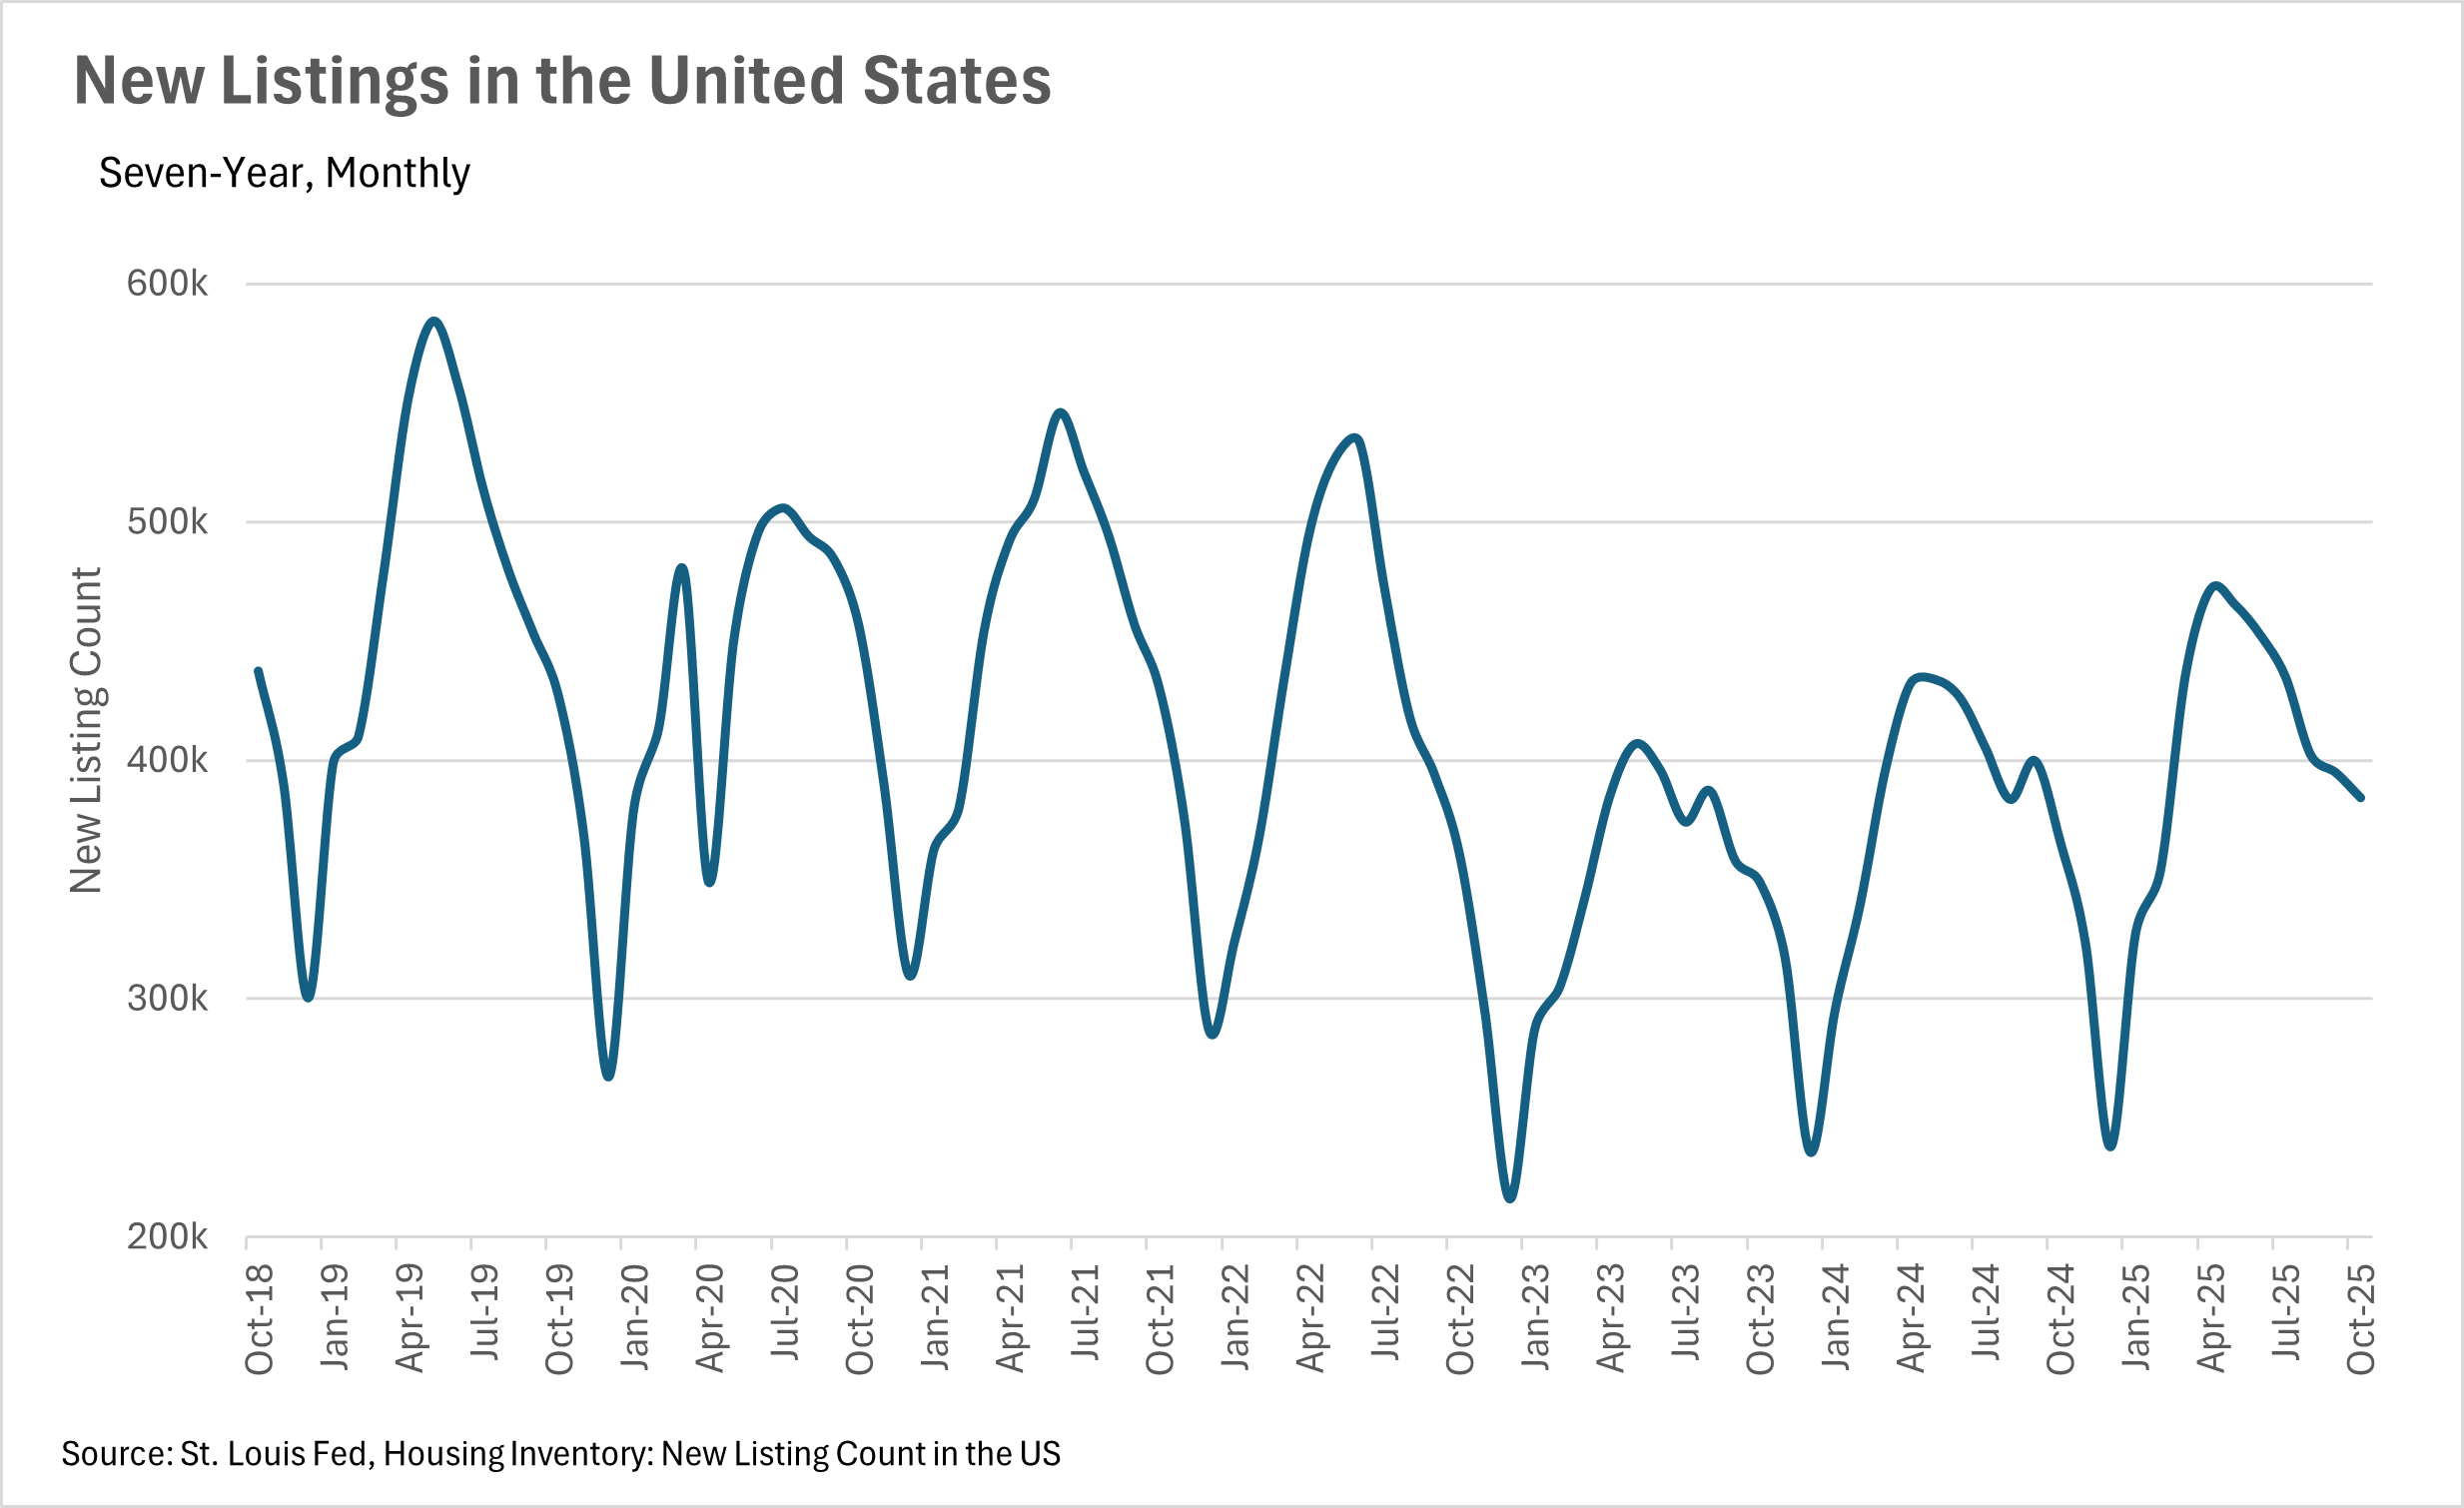
Throughout much of the year, inventories at a national level have remained remarkably steady, with most months hovering near the 1.5 million mark. With that being said, in the month of October, we saw inventory levels at roughly 1,520,000, representing a 10.95% increase on a year-over-year basis. During that same time period, we saw more than 384,000 new homes hit the market, representing an increase of 5.08% on a year-over-year basis. We also saw the median sale price for a home increase by 2.06%, bringing the median home value to $415,200.
Right now, we’re in the midst of a relatively interesting period of time, economically speaking. During the government shutdown, not only were there very few publicly released economic datapoints, but many offices responsible for collecting data were unable to. This means we’re receiving economic data that has been tremendously delayed. Uncertainty like this, of course, does not bode well with countless entities, like lenders, markets, and most importantly, the Federal Reserve. Since the Fed is so reliant on public data that has been inaccessible/delayed given the government shutdown, it’s hard to tell what they will do next with interest rates. Luckily for homebuyers and sellers alike, we saw another quarter-point cut in December, but overall, it’s unclear whether or not this cut cycle will continue.
However, this is just what we’re seeing at a national level. As we all know, real estate is incredibly localized, so be sure to check out your local lowdown below!

Note: You can find the charts/graphs for the Local Lowdown at the end of this section.
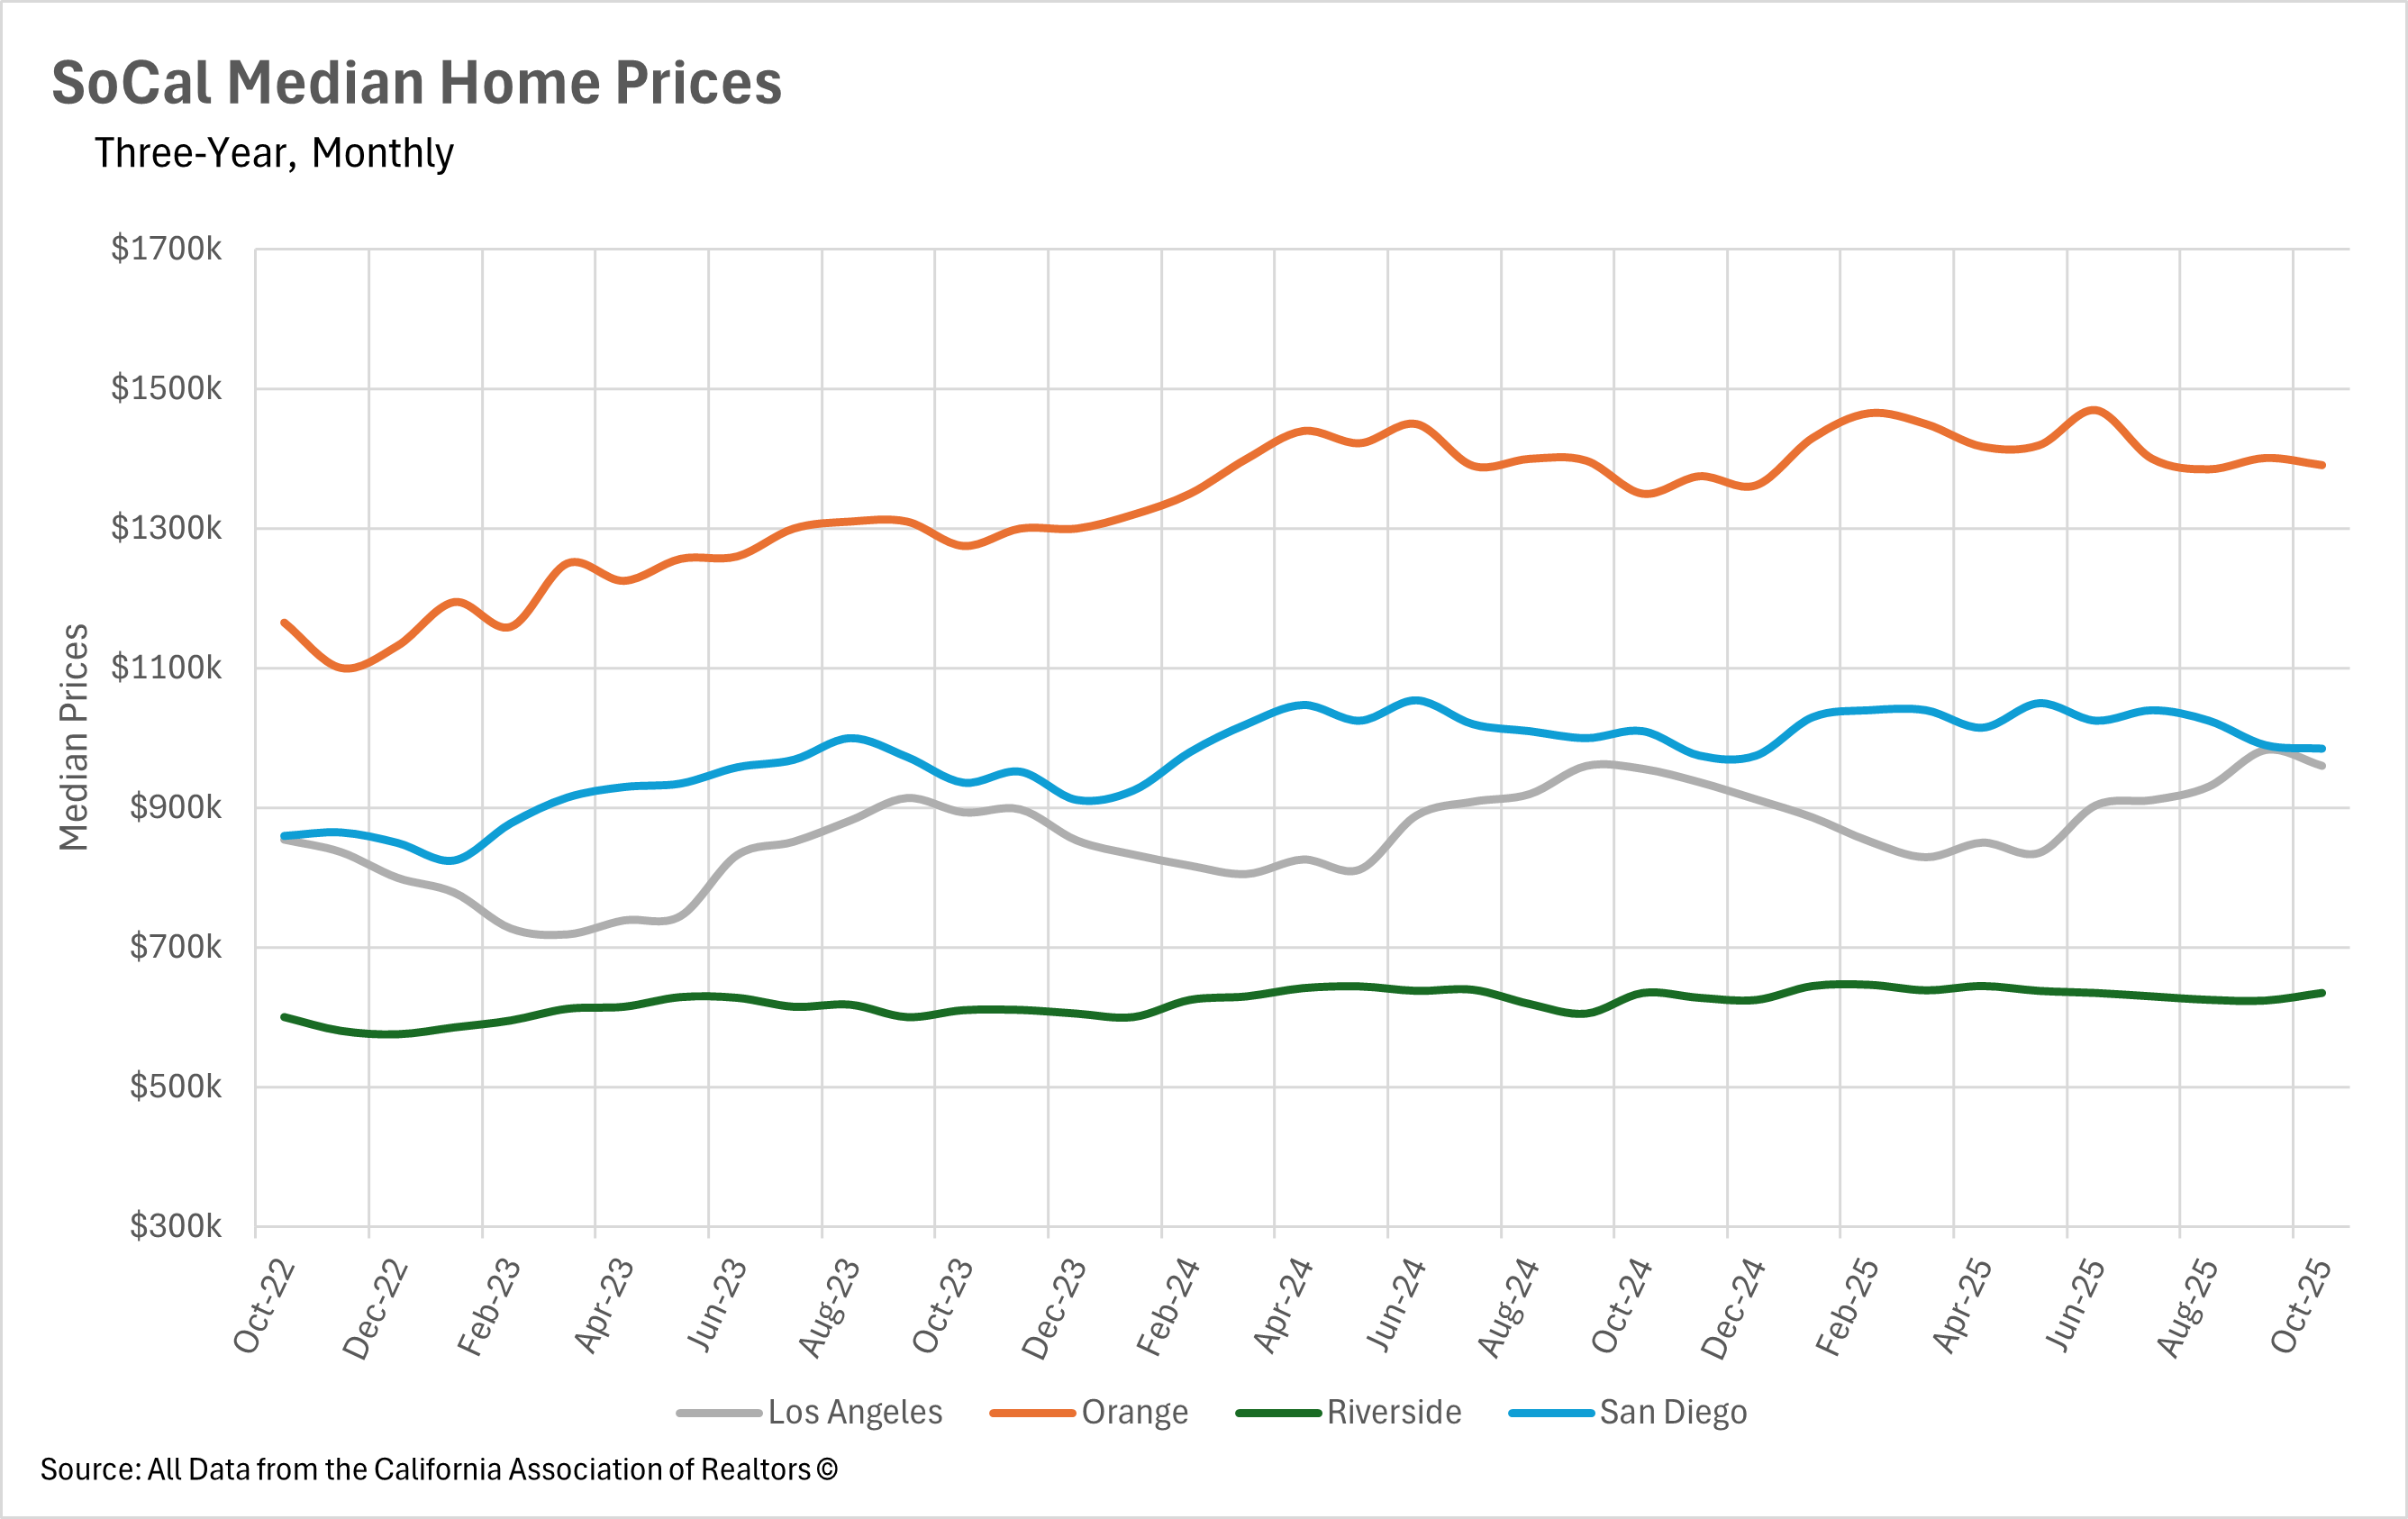
The Southern California housing market is telling four distinctly different stories as we move through the fall of 2025, with each major region experiencing its own unique pricing dynamic. Orange County has emerged as the region's strongest performer, with October's median price of $1,391,000 representing a solid 3.04% year-over-year increase and marking the strongest annual growth since March 2025. This represents a dramatic improvement from September's minimal 0.27% growth and suggests the market has found a new equilibrium that balances buyer caution with sustained underlying demand.
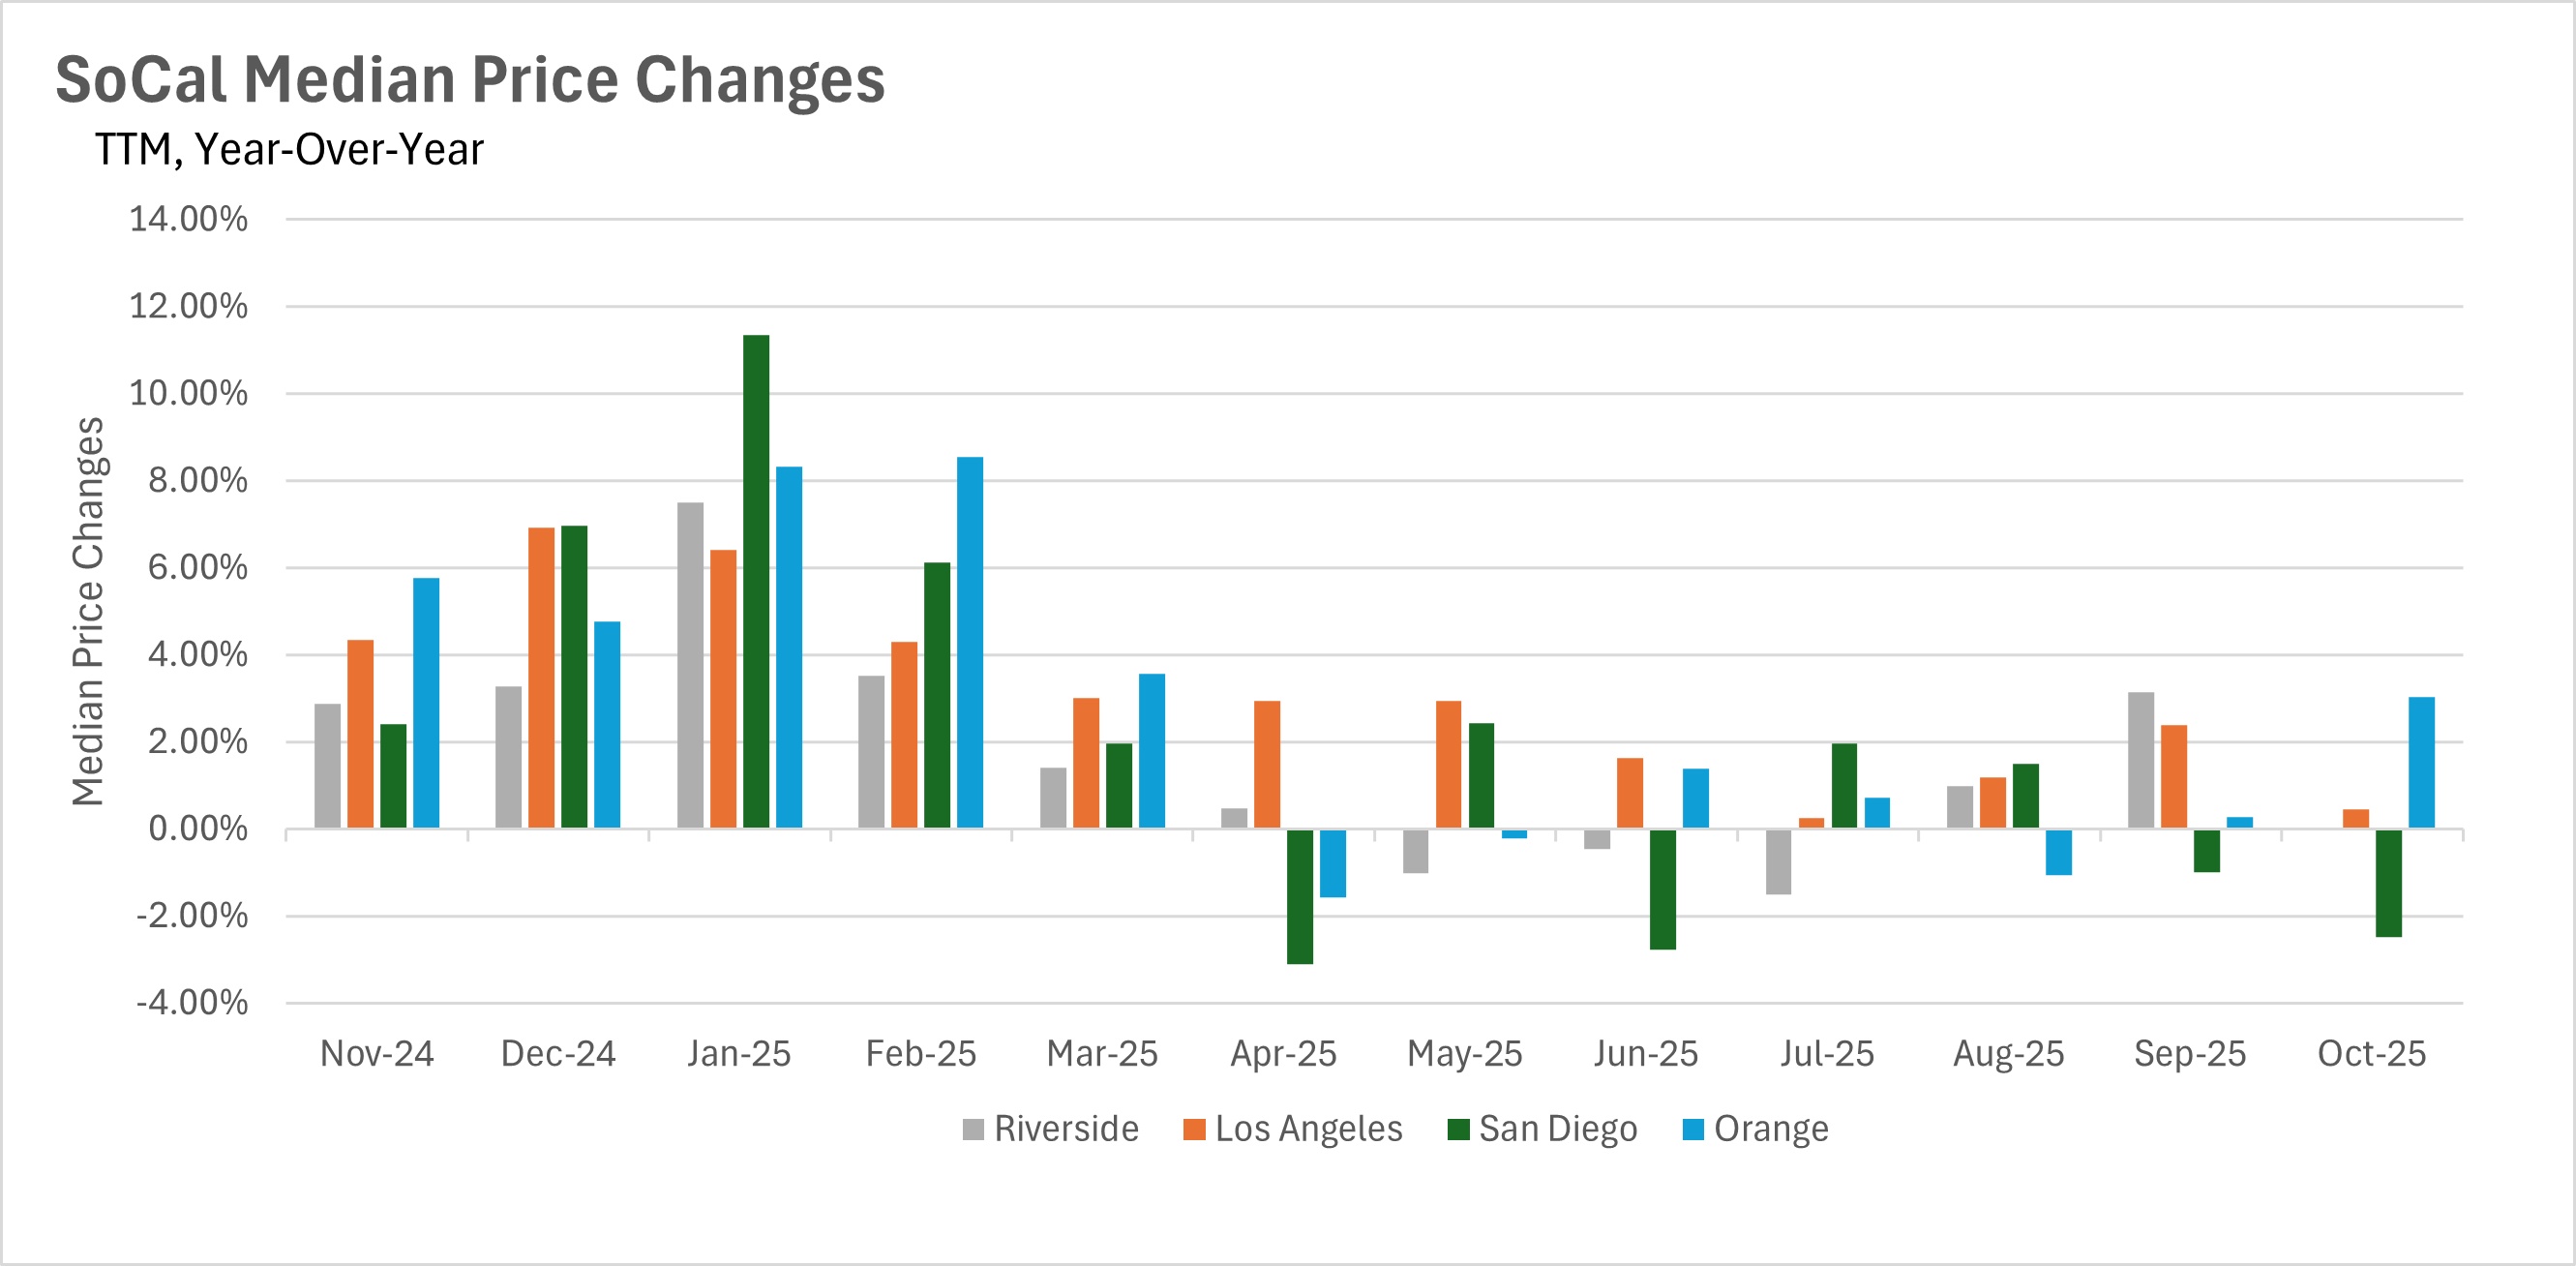
Los Angeles County presents a more muted picture, with October's median of $960,620 showing only 0.46% year-over-year growth after pulling back from September's temporary surge to $983,230. This near-flat appreciation continues the pattern of minimal price movement that has characterized much of 2025, with current values essentially hovering at levels seen twelve months ago. San Diego has entered correction territory, with October's median price of $985,000 marking a 2.48% year-over-year decline and representing the second consecutive month of negative comparisons after an explosive 11.35% surge to start the year. Riverside shows the region's most volatile pattern, with October's $634,990 median posting 0.00% year-over-year growth after alternating between modest gains and losses throughout 2025, including negative year-over-year comparisons in May, June, and July.
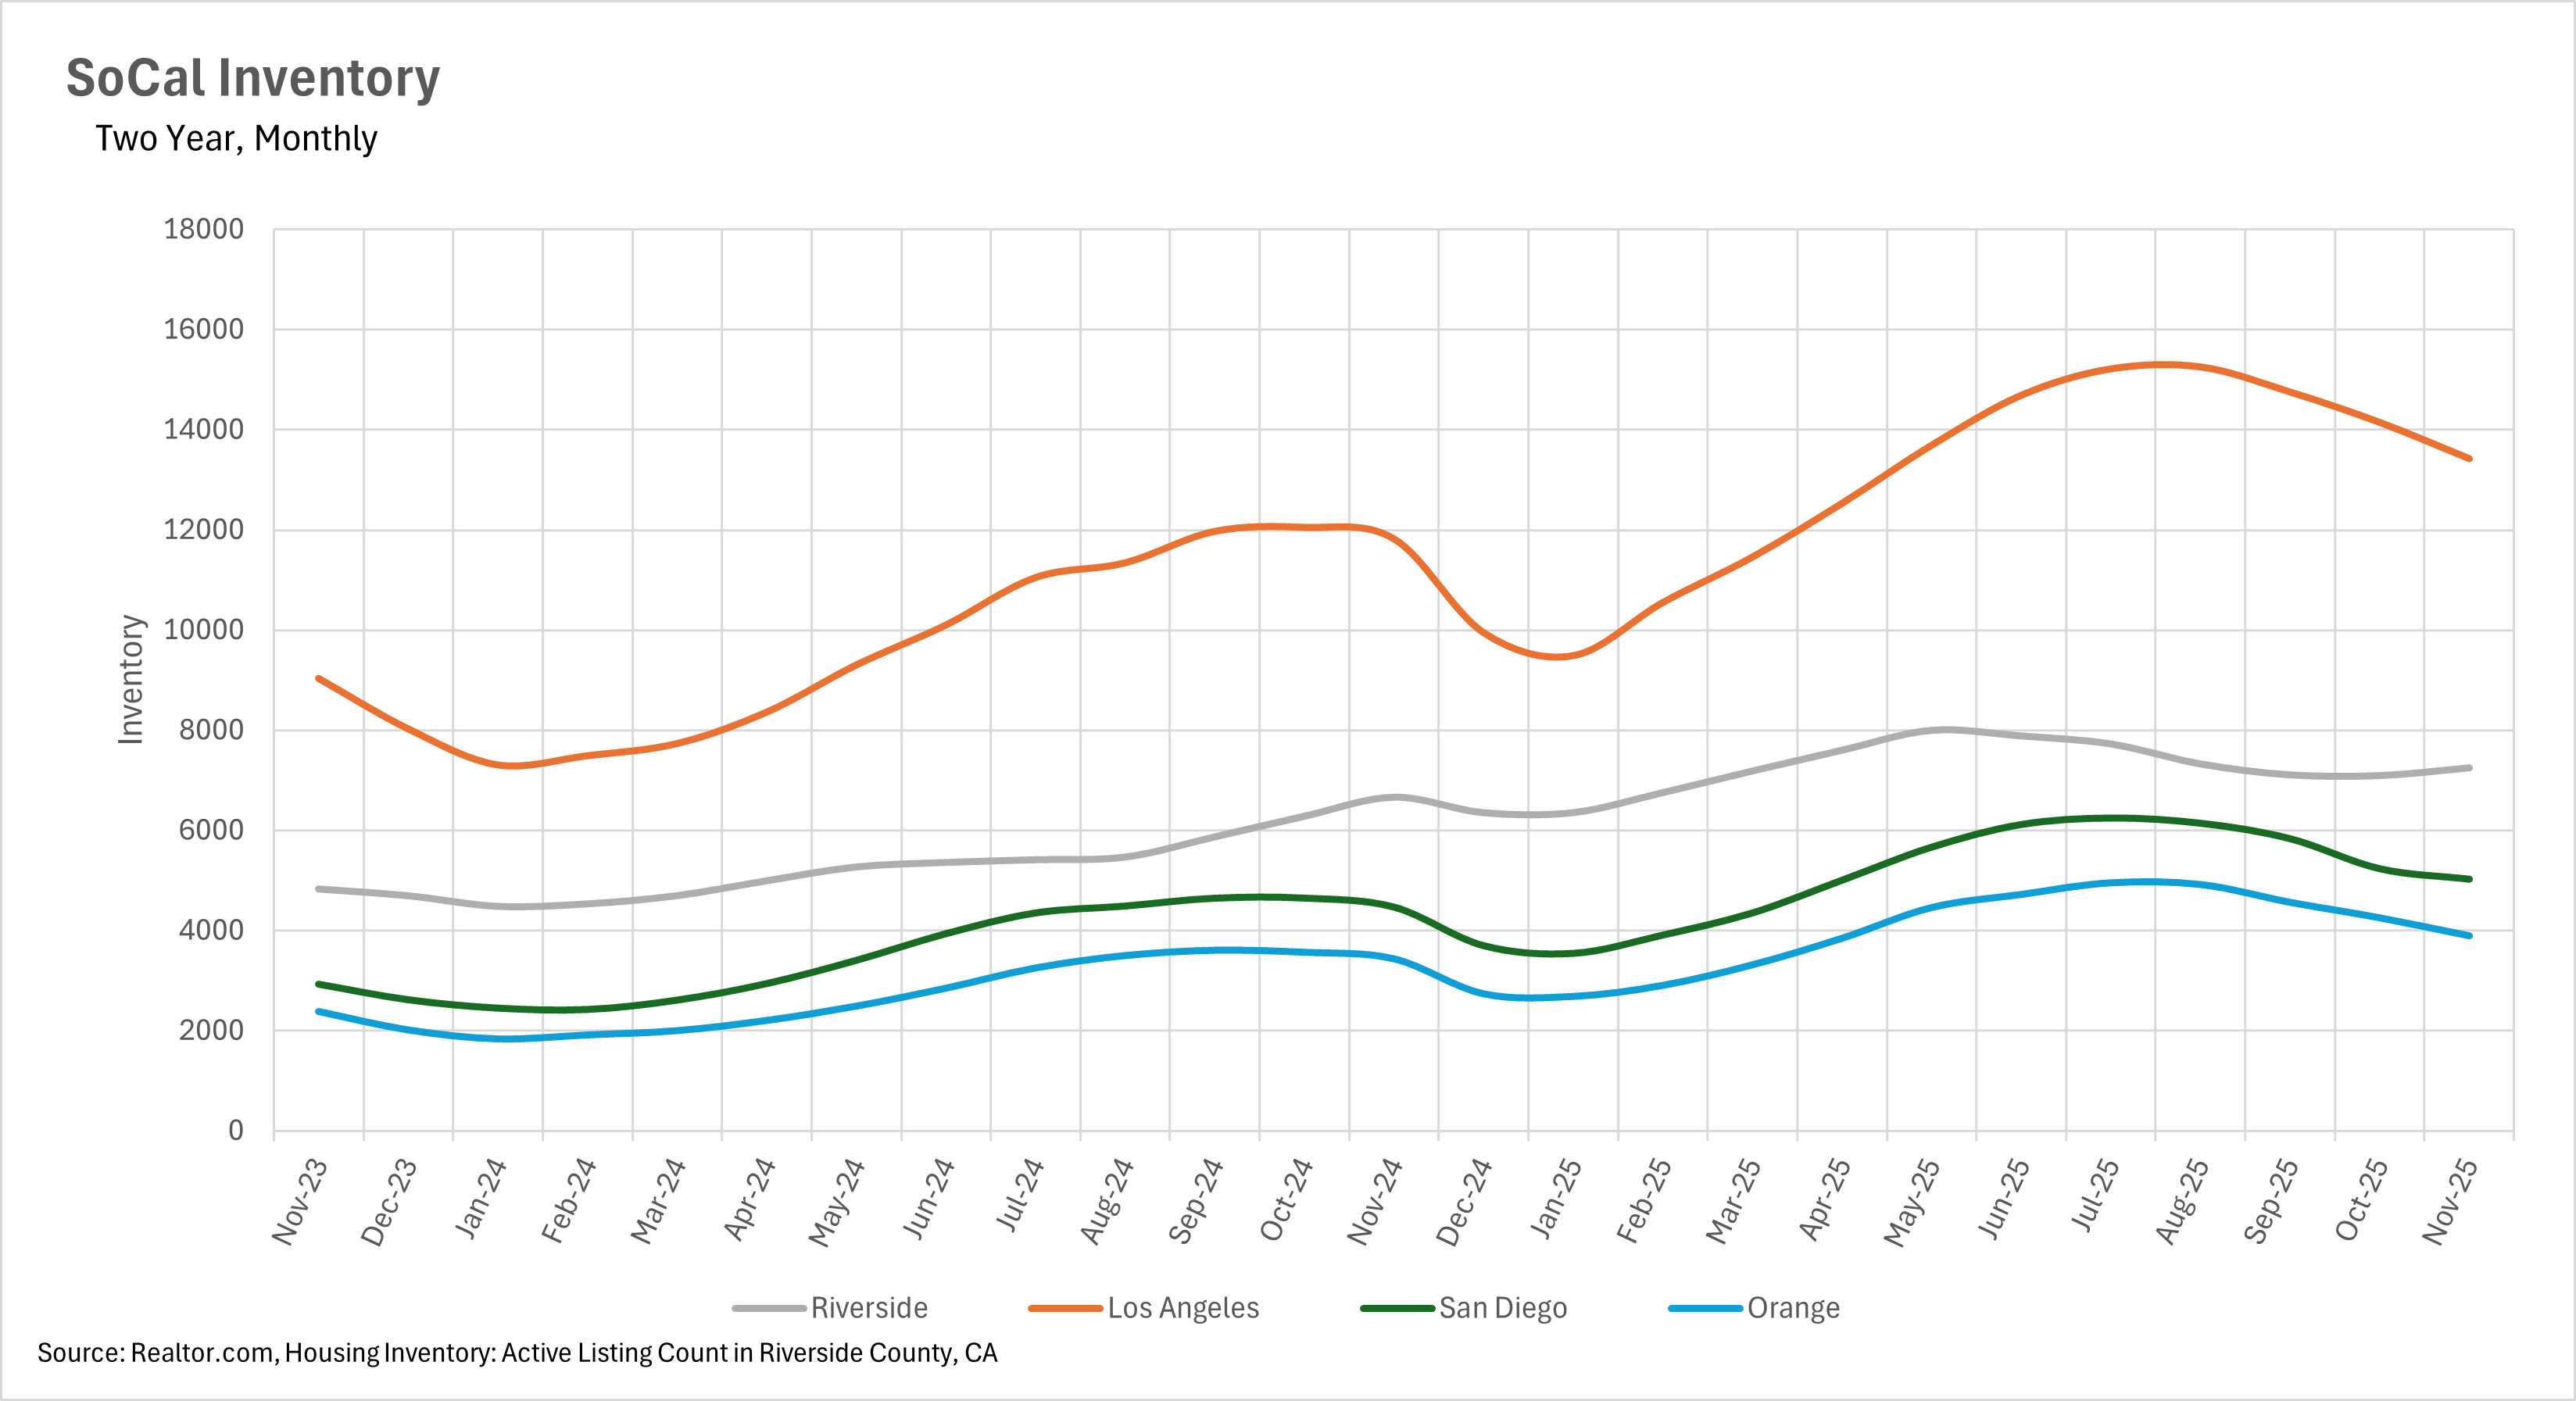
After experiencing dramatic inventory buildups throughout the spring and summer months, all major Southern California markets have entered a period of accelerated seasonal contraction as typical fall patterns reassert themselves. Orange County is experiencing the most rapid inventory decline, with November's 3,892 single-family homes representing a substantial 8.45% month-over-month decrease from October and marking the fourth consecutive month of declining inventory levels. This dramatic pullback demonstrates that seasonal patterns have fully reasserted themselves after the summer peak of nearly 5,000 homes.
Los Angeles followed with November showing 13,427 active listings, a 5.12% decrease from October's 14,151 homes and continuing the steady decline from August's peak of 15,258 listings. San Diego witnessed active listings dropping to 5,025 homes in November, a 3.97% decrease from October and marking the third consecutive month of inventory declines following July's peak of 6,245 listings. Riverside posted the most modest month-over-month decline at 2.98%, with November showing 7,245 homes on the market. Despite these consistent monthly contractions across all markets, inventory levels remain significantly elevated on a year-over-year basis throughout the region. Riverside maintains the highest year-over-year increase at 21.02%, followed by Orange County at 13.40%, Los Angeles at 13.53%, and San Diego showing the most moderation at 12.47%.
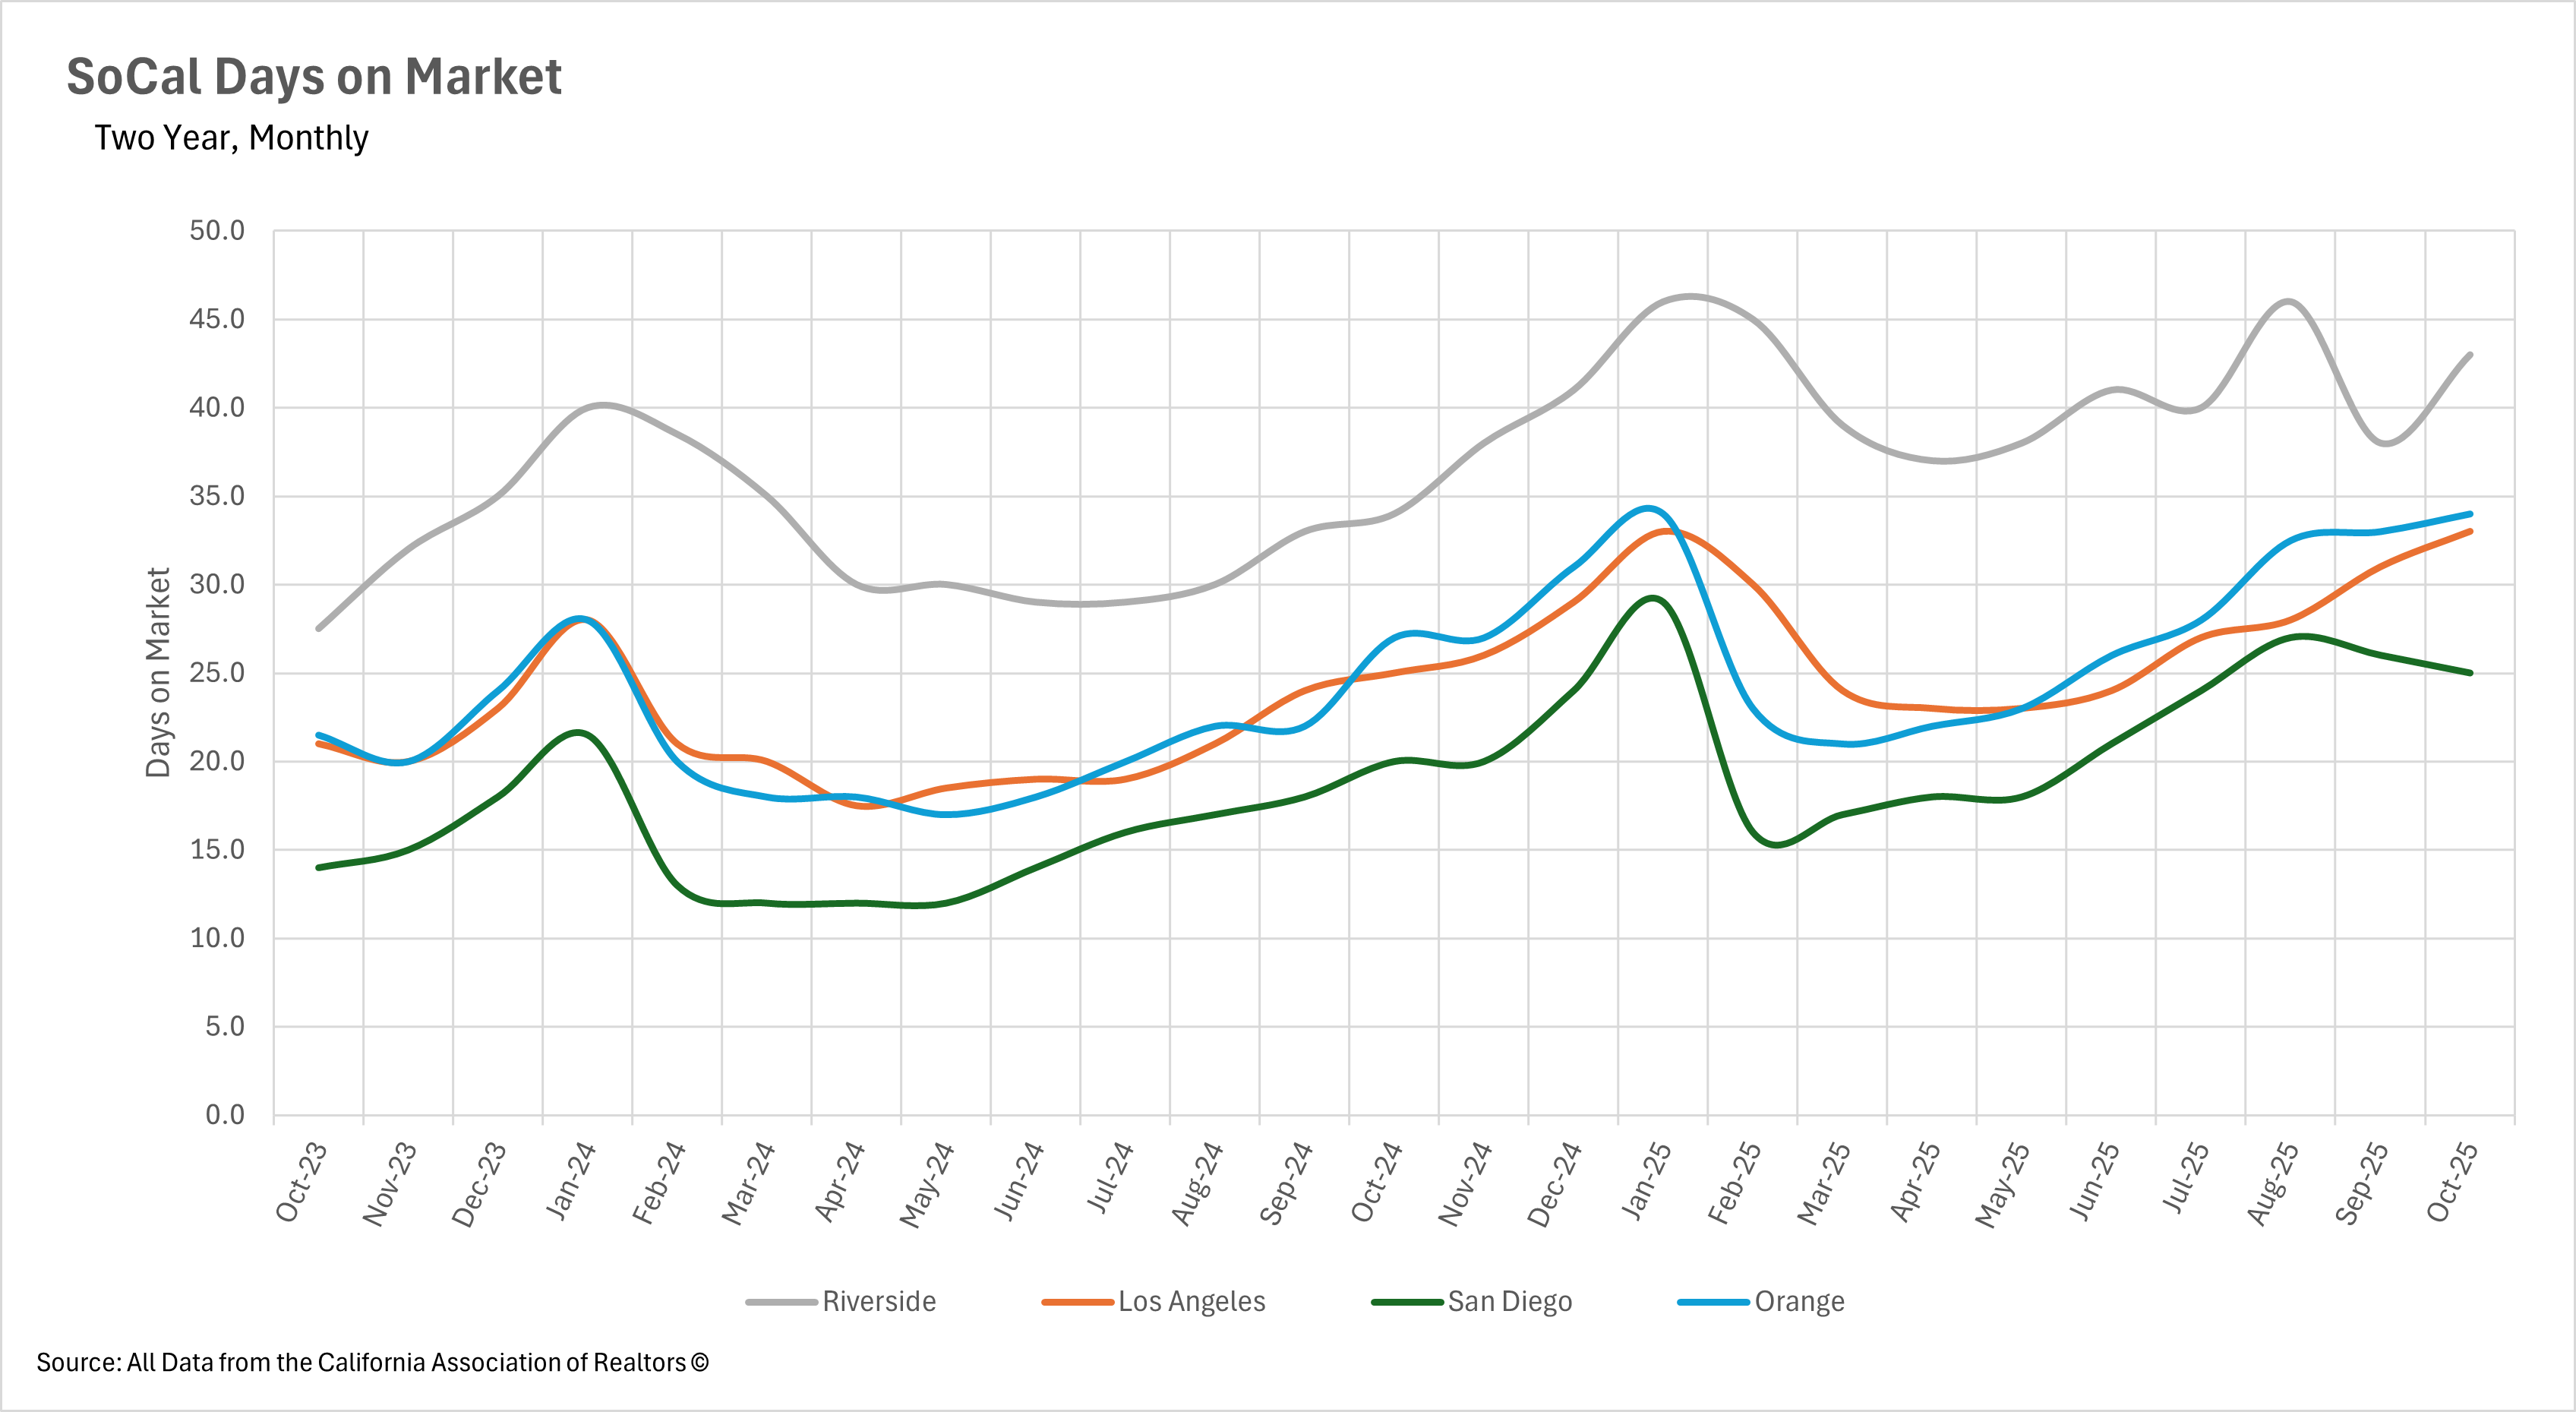
The most striking indicator of transformed market dynamics across Southern California is the dramatic extension in the time properties spend on market, a trend that has persisted and even worsened despite declining inventory levels throughout the fall. Riverside currently experiences the longest selling times in the region, with properties spending a median of 43 days on market in October, representing an extraordinary 53.33% year-over-year increase from October 2024's 28 days and a substantial 15% month-over-month increase from September. Los Angeles follows closely with homes spending 33 days on market in October, marking a 32.00% year-over-year increase from 25 days and a 6.45% month-over-month increase from September's already elevated 31 days.
Orange County properties now sit for 34 days before selling, up 25.93% from October 2024's 27 days and showing a 3.03% month-over-month increase even as inventory contracts. San Diego provides the only encouraging sign in this metric, with October's 25 days on market representing a 3.85% month-over-month improvement from September's 26 days, though still up 25% year-over-year compared to October 2024's 20 days. The persistence and even acceleration of these extended timelines across most markets, even as inventory declines and some markets show price strength, indicates a fundamental shift in buyer behavior and market psychology. Purchasers throughout Southern California are clearly taking advantage of their improved negotiating position, conducting thorough due diligence, and refusing to be rushed into decisions despite having fewer options than they did at peak inventory levels.
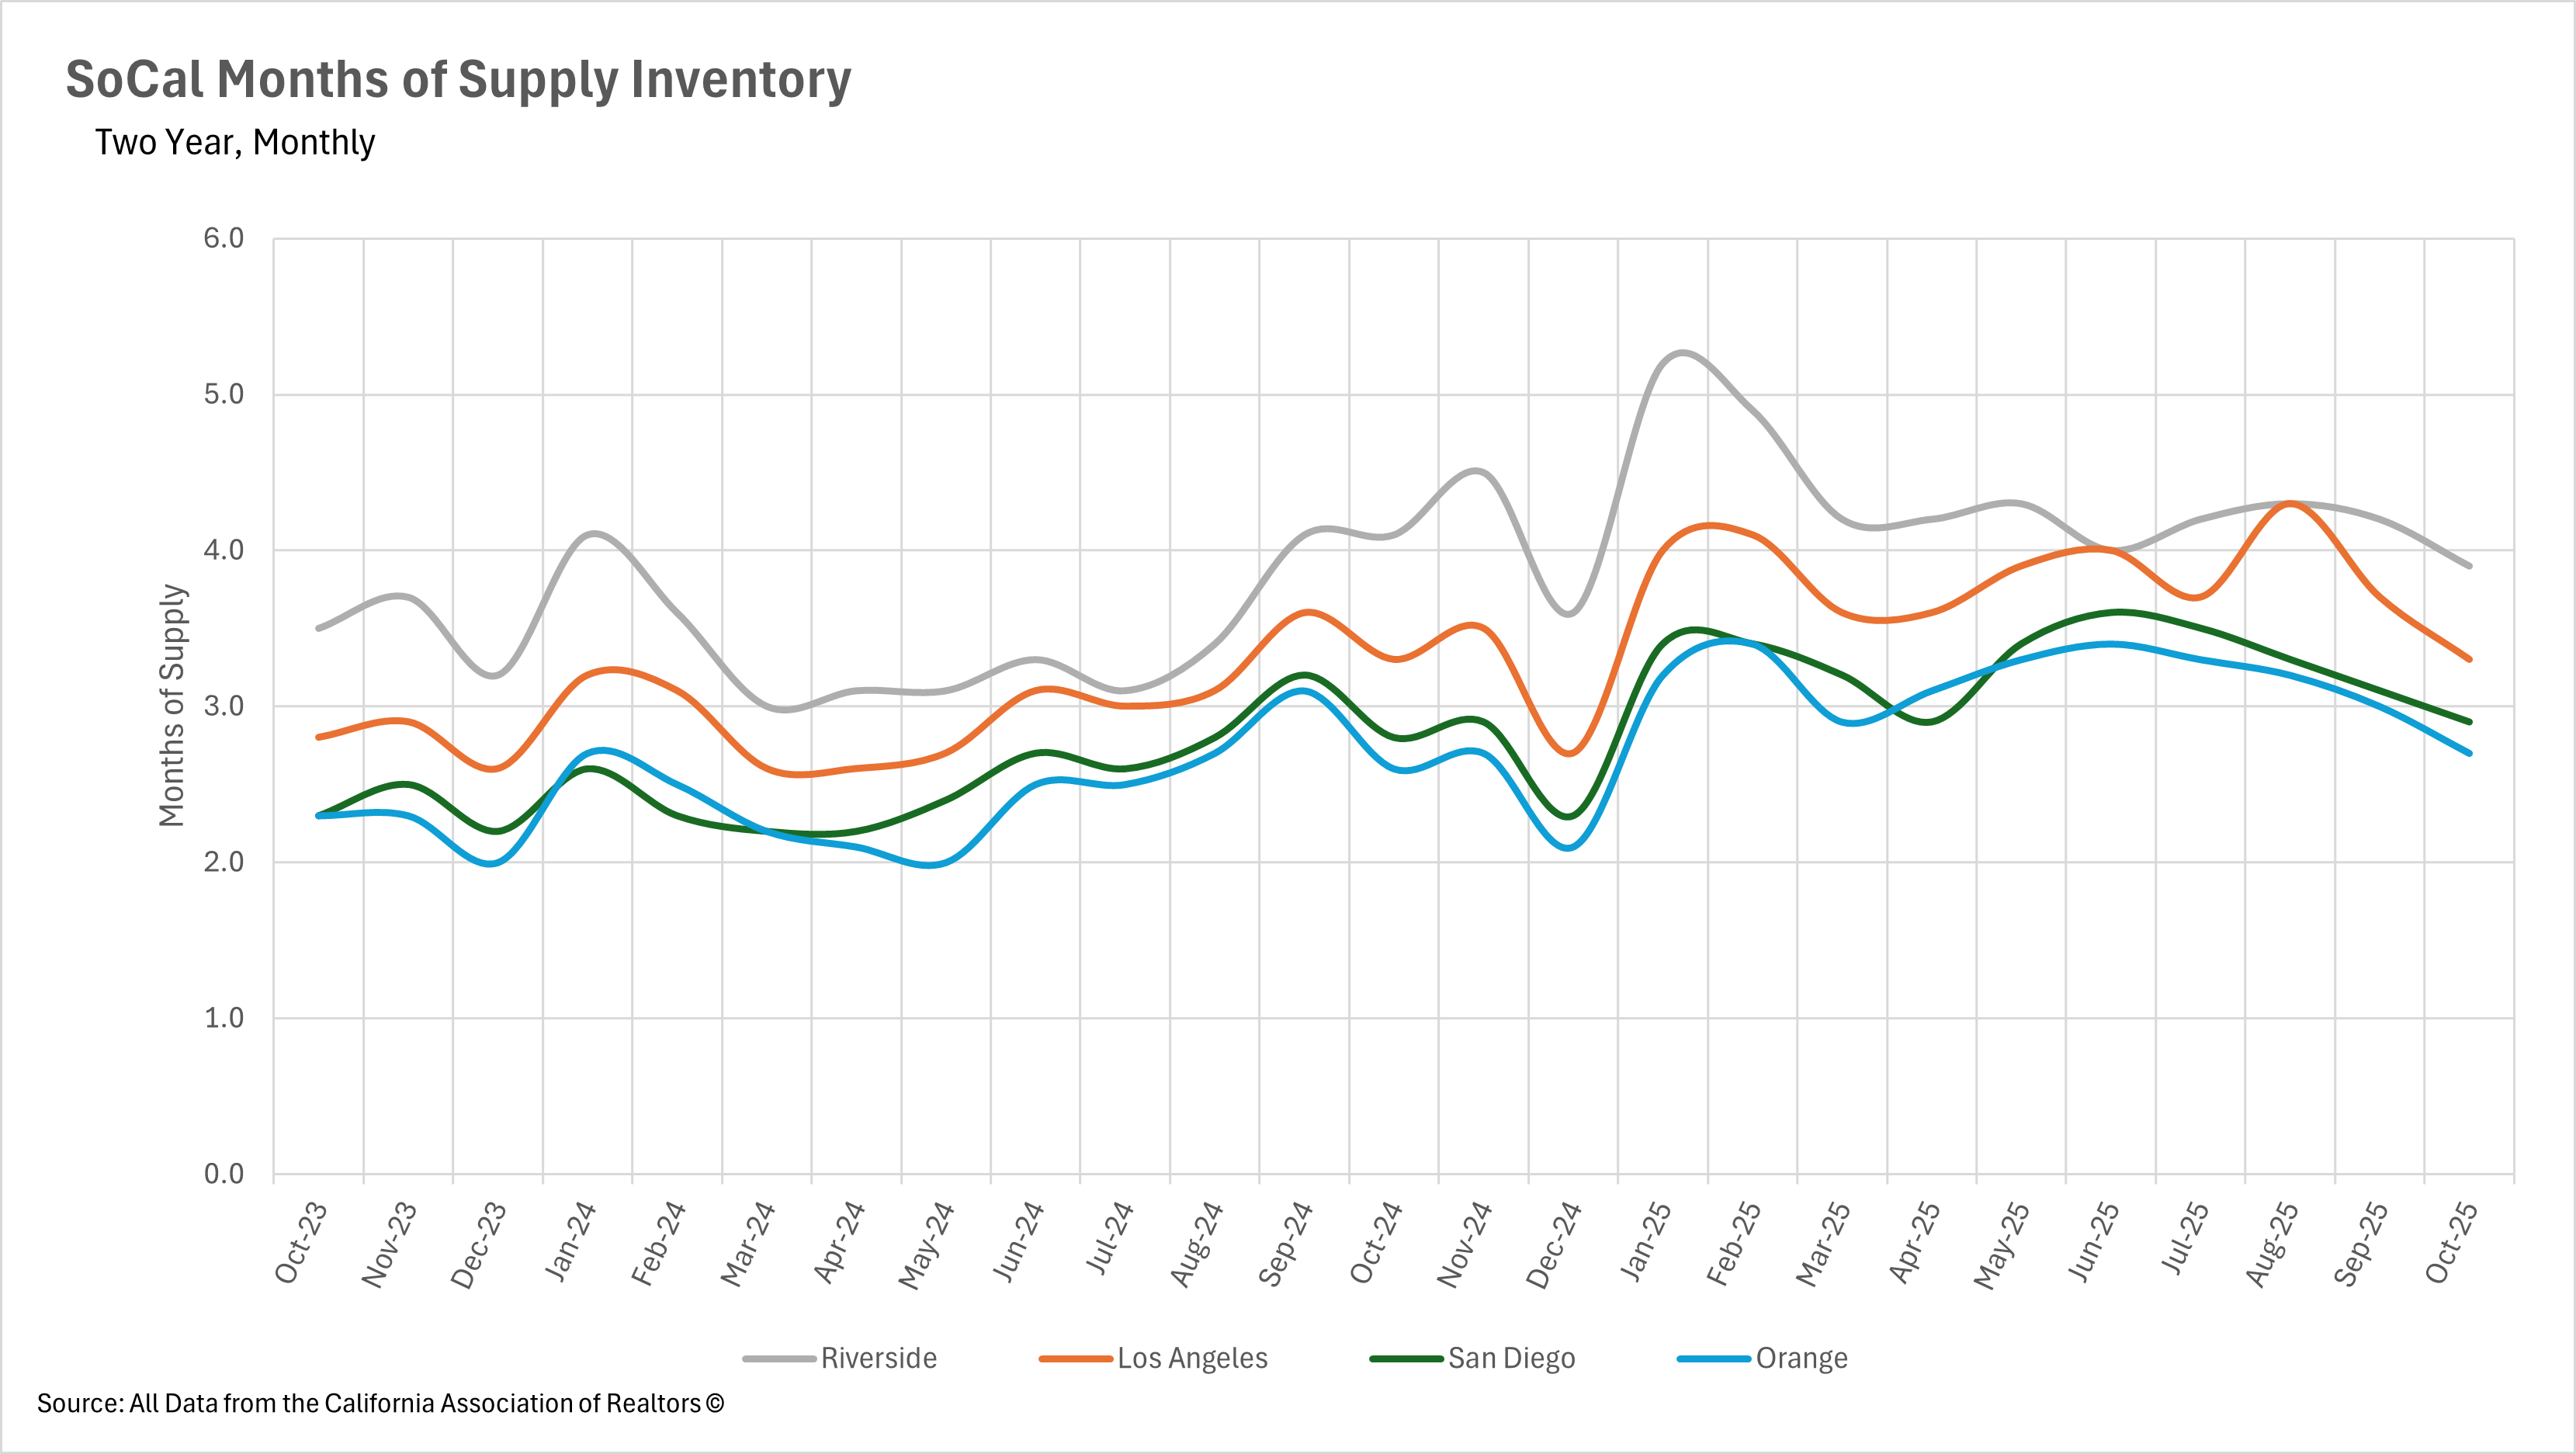
When determining whether a market is a buyers' market or a sellers' market, we look to the Months of Supply Inventory (MSI) metric. The state of California has historically averaged around three months of MSI, so any area with at or around three months of MSI is considered a balanced market. Any market that has lower than three months of MSI is considered a sellers' market, whereas markets with more than three months of MSI are considered buyers' markets.
Southern California's housing markets are experiencing a notable shift in their fundamental dynamics as fall progresses, with most major markets trending away from the buyer-favorable conditions that characterized much of 2025. San Diego has made the most decisive shift, transitioning back into sellers' market territory with 2.9 months of supply in October, representing a 6.45% month-over-month decline and just a modest 3.57% year-over-year increase. This marks the first time since spring that the market has fallen below the three-month balanced threshold, suggesting that the window of opportunity for buyers to negotiate aggressively may be closing. Orange County follows a similar pattern, trending back toward sellers' market territory with 2.7 months of supply in October, representing a significant 10% month-over-month decrease from September's 3.0 months and a modest 3.85% year-over-year increase. The sharp monthly decline demonstrates that the market is normalizing more quickly than many expected, with the traditional fall slowdown in new listings outpacing the slowdown in buyer demand. Los Angeles has made remarkable progress toward balance, with 3.3 months of inventory showing a dramatic 10.81% month-over-month decrease from September's 3.7 months and, most notably, representing 0.00% change compared to October 2024 - marking the first time all year that the year-over-year comparison has been flat. Riverside stands as the region's outlier, maintaining buyers' market status with 3.9 months of supply in October, though this represents improvement from summer peaks and shows a 2.38% month-over-month decline. The convergence toward more balanced or seller-favorable conditions across most of Southern California suggests that the market correction has largely run its course, though the extended selling times indicate that buyers still maintain meaningful negotiating leverage despite improving supply dynamics.
Stay up to date on the latest real estate trends.

July 2026

A Closer Look at Dallas Rental Prices, Hidden Costs, and What Renters Need to Know Before Moving

June 2026

May 2026

April 2026

March 2026

February 2026
January 2026

Trusted Experts in the Palisades, Santa Monica, and Brentwood Real Estate Markets
You’ve got questions and we can’t wait to answer them.