Market Update Los Angeles

Note: You can find the charts & graphs for the Big Story at the end of the following section.
*National Association of REALTORS® data is released two months behind, so we estimate the most recent month’s data when possible and appropriate.
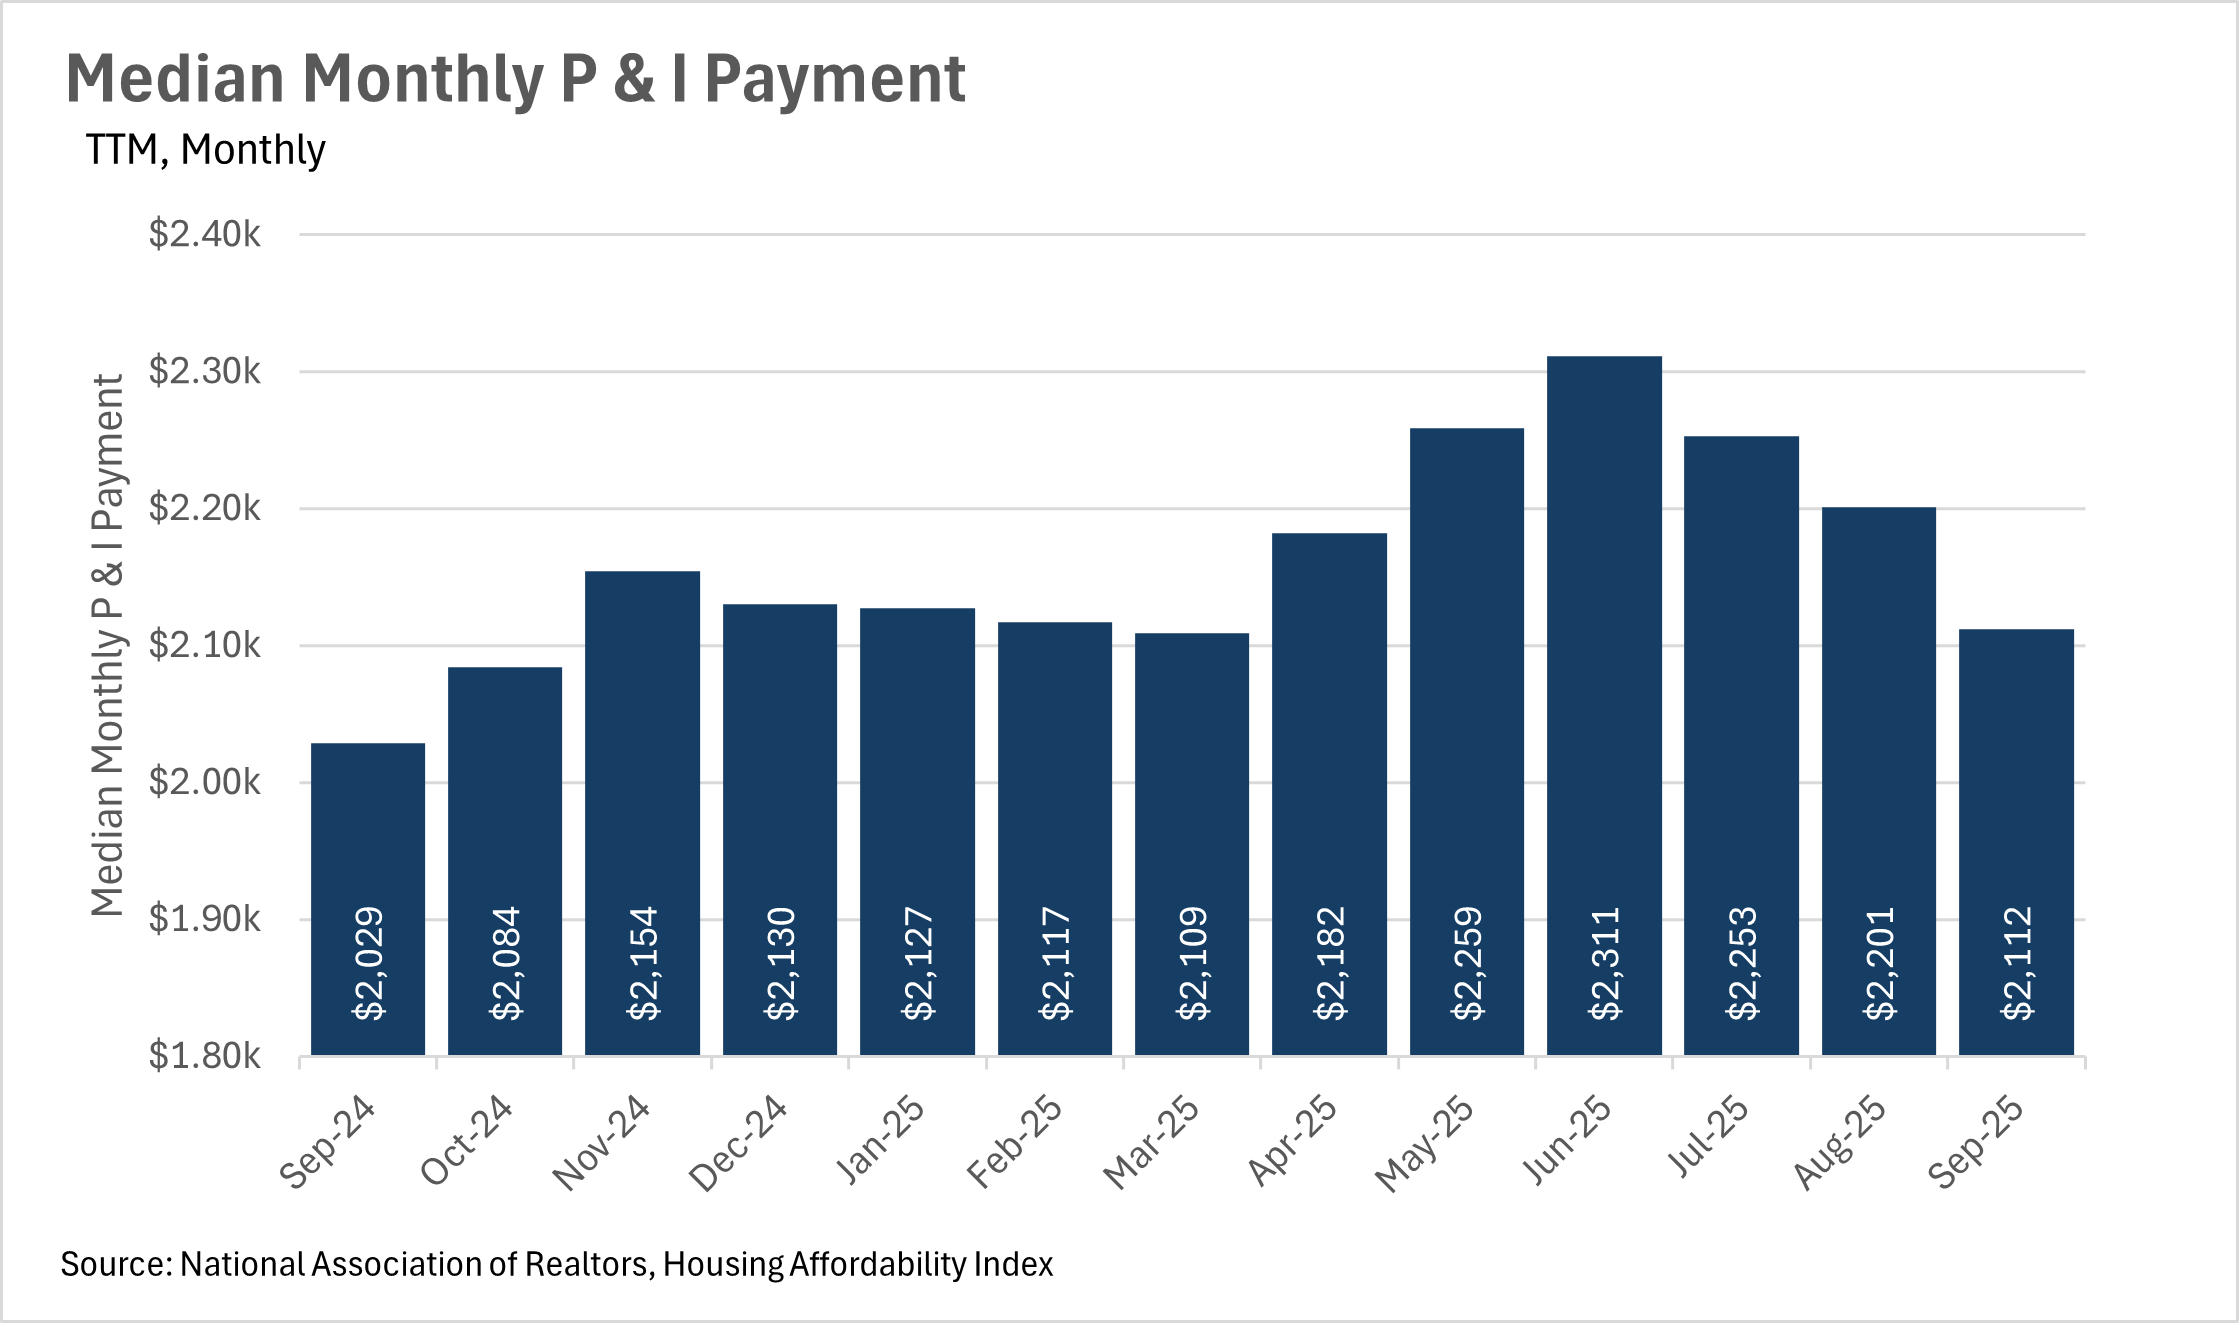
Median monthly P&I payments are on the decline, as one might expect when interest rates are falling. This, of course, is great for new buyers that are in the market for a home. If we see an influx of new buyers, there is the possibility that we might see a less stagnant market when the spring time rush comes in early 2026. Unfortunately though, interest rates are still much too high for many people who locked in rates in the 2-3% range to justify moving to a new home and taking on a considerably higher mortgage payment each month. We likely won’t see these homes/homeowners enter the market until rates come down substantially more than they already have.
In the Fed’s October FOMC meeting, they decided to cut the federal funds rate by another quarter point, making the overnight interest rate range between 3.75% and 4.00%. This led mortgage rates to fall in unison, which is great news for prospective buyers and recent buyers that made the bet that they would be able to refinance at a lower rate sooner rather than later. It’ll be important to look at the economic data that’s released once the government shutdown ends, as this data is what the Fed bases their interest rate decisions on. Once we receive some more clarity regarding economic data, then we’ll have a better idea of whether or not to expect a rate cut in December.
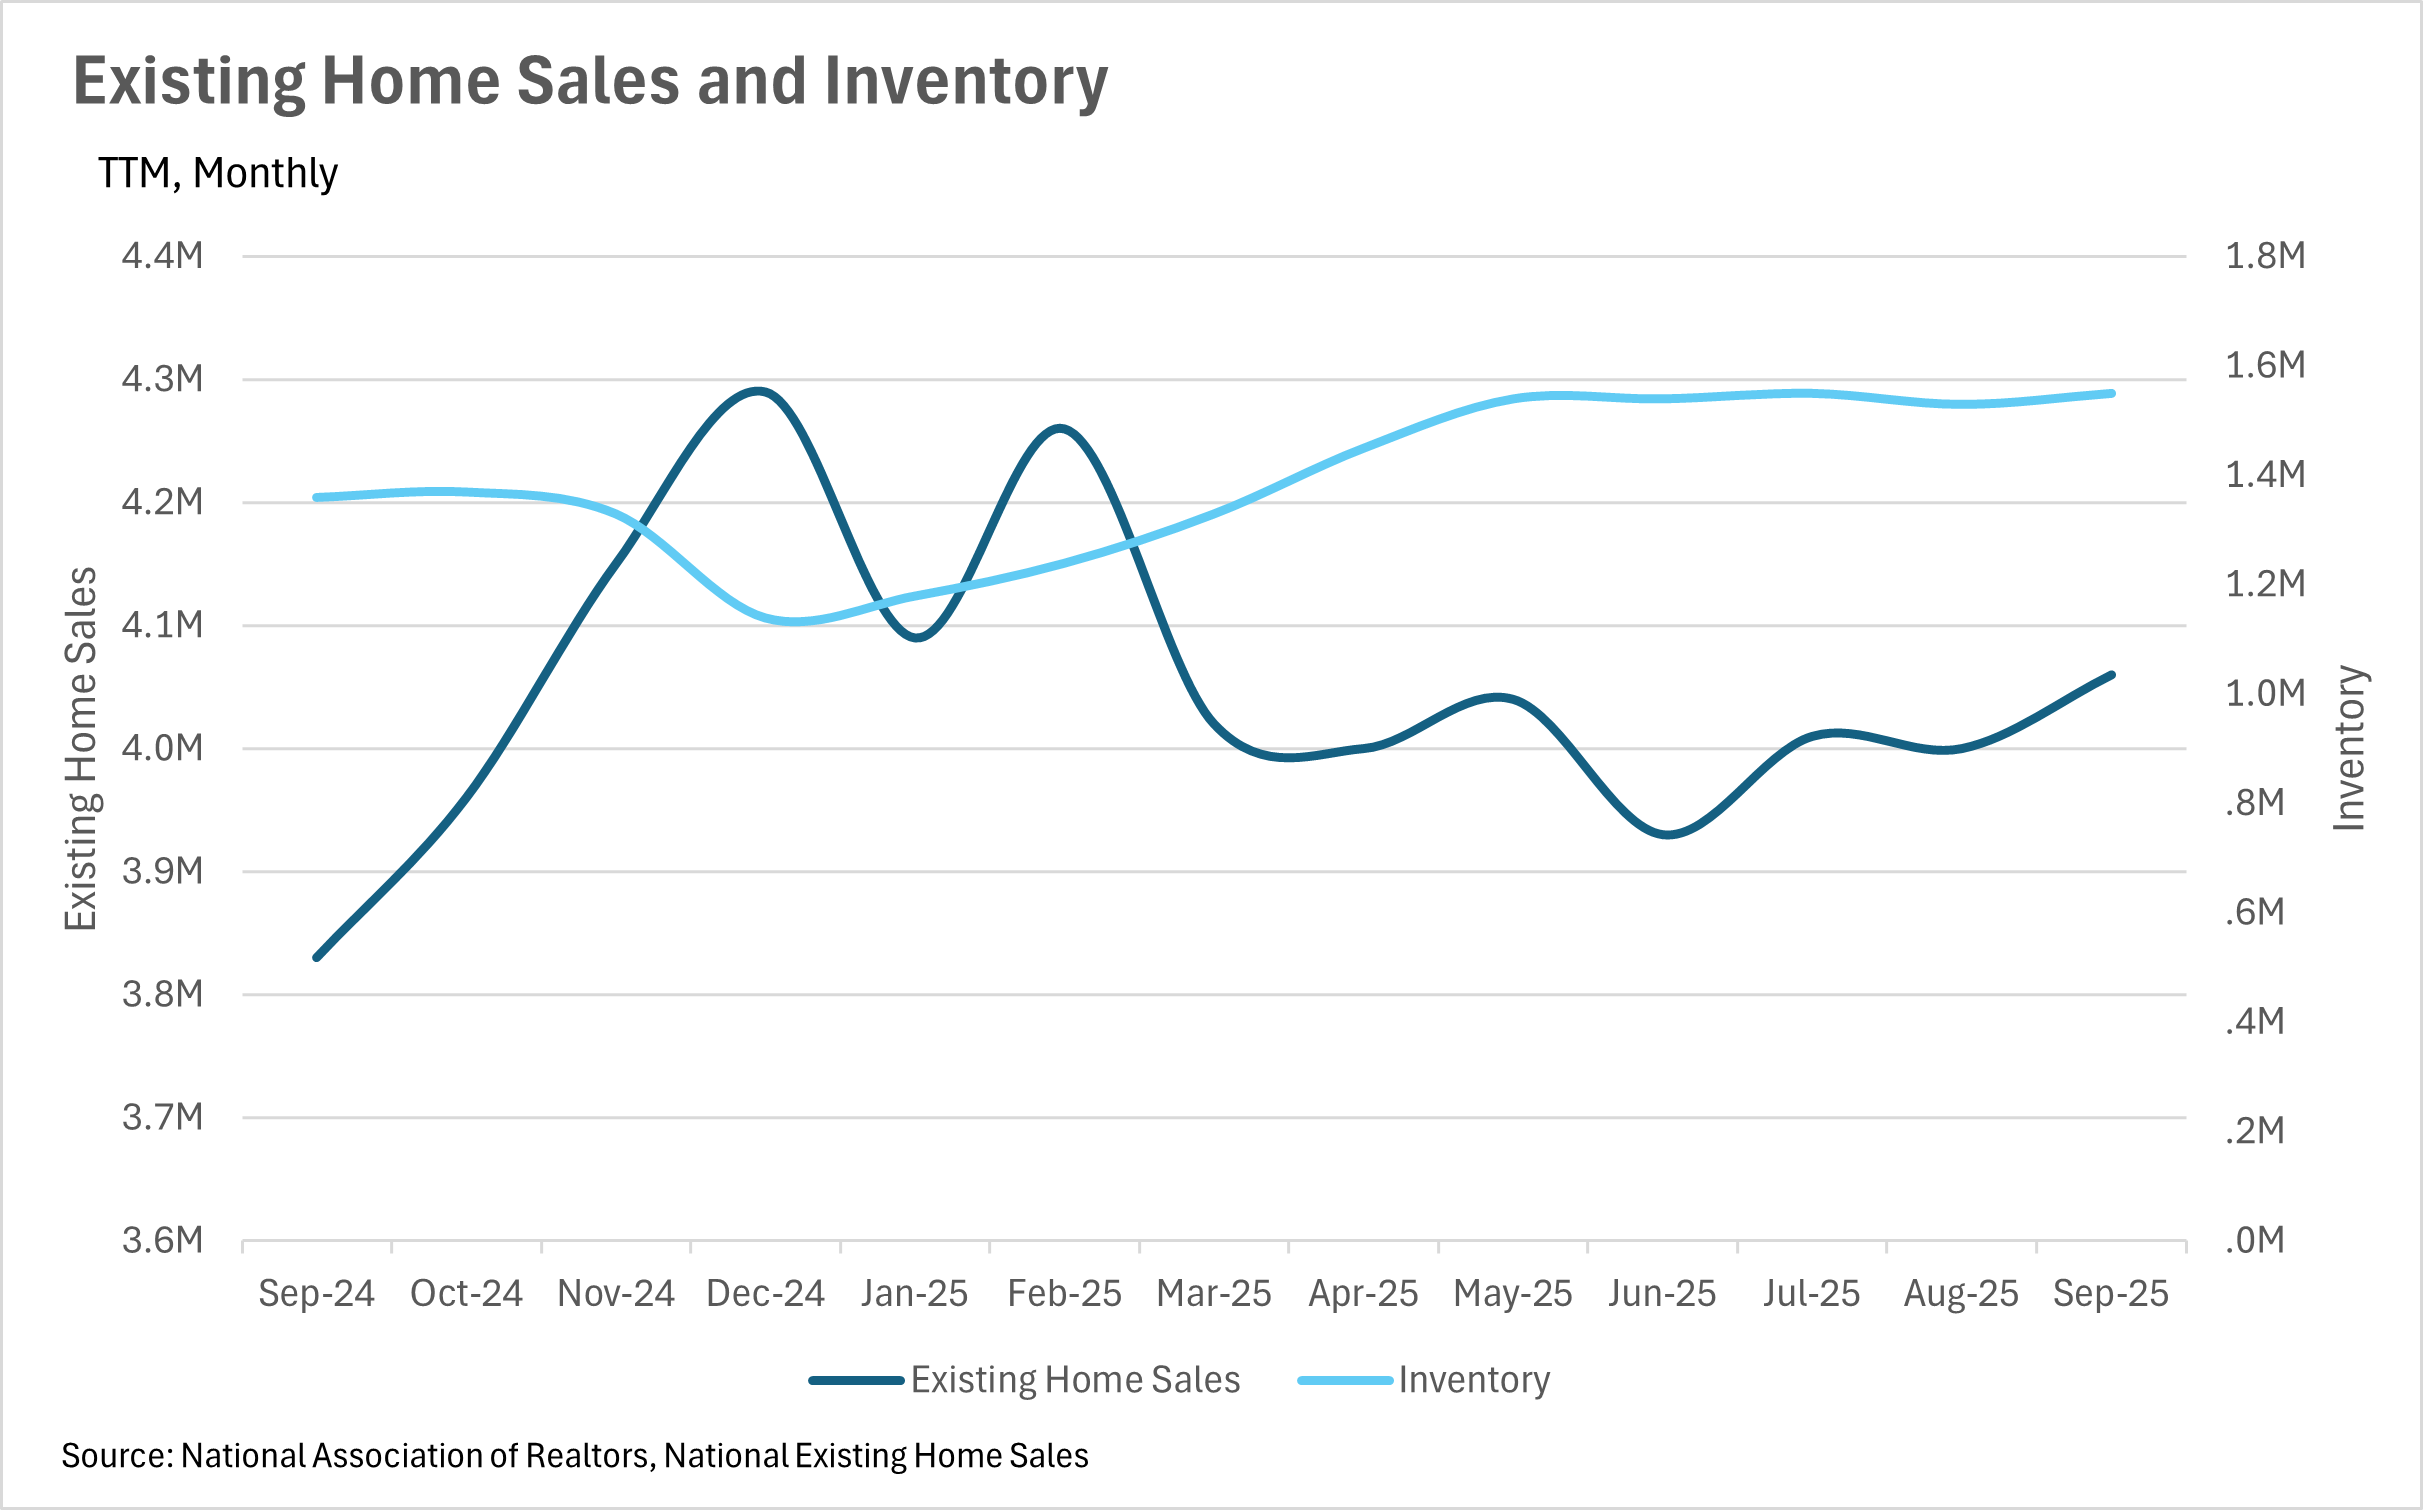
Inventories have remained incredibly strong throughout this year, as inventory growth has consistently outstripped existing home sale growth. This past month, we saw inventories grow by 13.97% on a year-over-year basis, while there were only 6.01% more existing homes sold. It’ll be interesting to see where inventories go over the course of the winter, since they usually decline meaningfully.
As we mentioned above, we might have another rate cut ahead of us, as CME’s FedWatch predicts a 65% chance of a 25 basis point rate cut in the Fed’s December meeting. However, it is worth noting that once the government shutdown-related “economic data moratorium” that we’ve been facing is lifted, this probability can shift very rapidly. If economic data is considerably better or worse than anticipated, then this may change how the Fed looks at the cutting cycle that we’re currently in. This means it’ll be very important to keep your eye out for key inflation and labor data once it eventually comes out.
All of this is just what we’re seeing at a national level, though. As we all know, real estate is incredibly localized, which is why you should take a look at your local lowdown below:
Note: You can find the charts/graphs for the Local Lowdown at the end of this section.
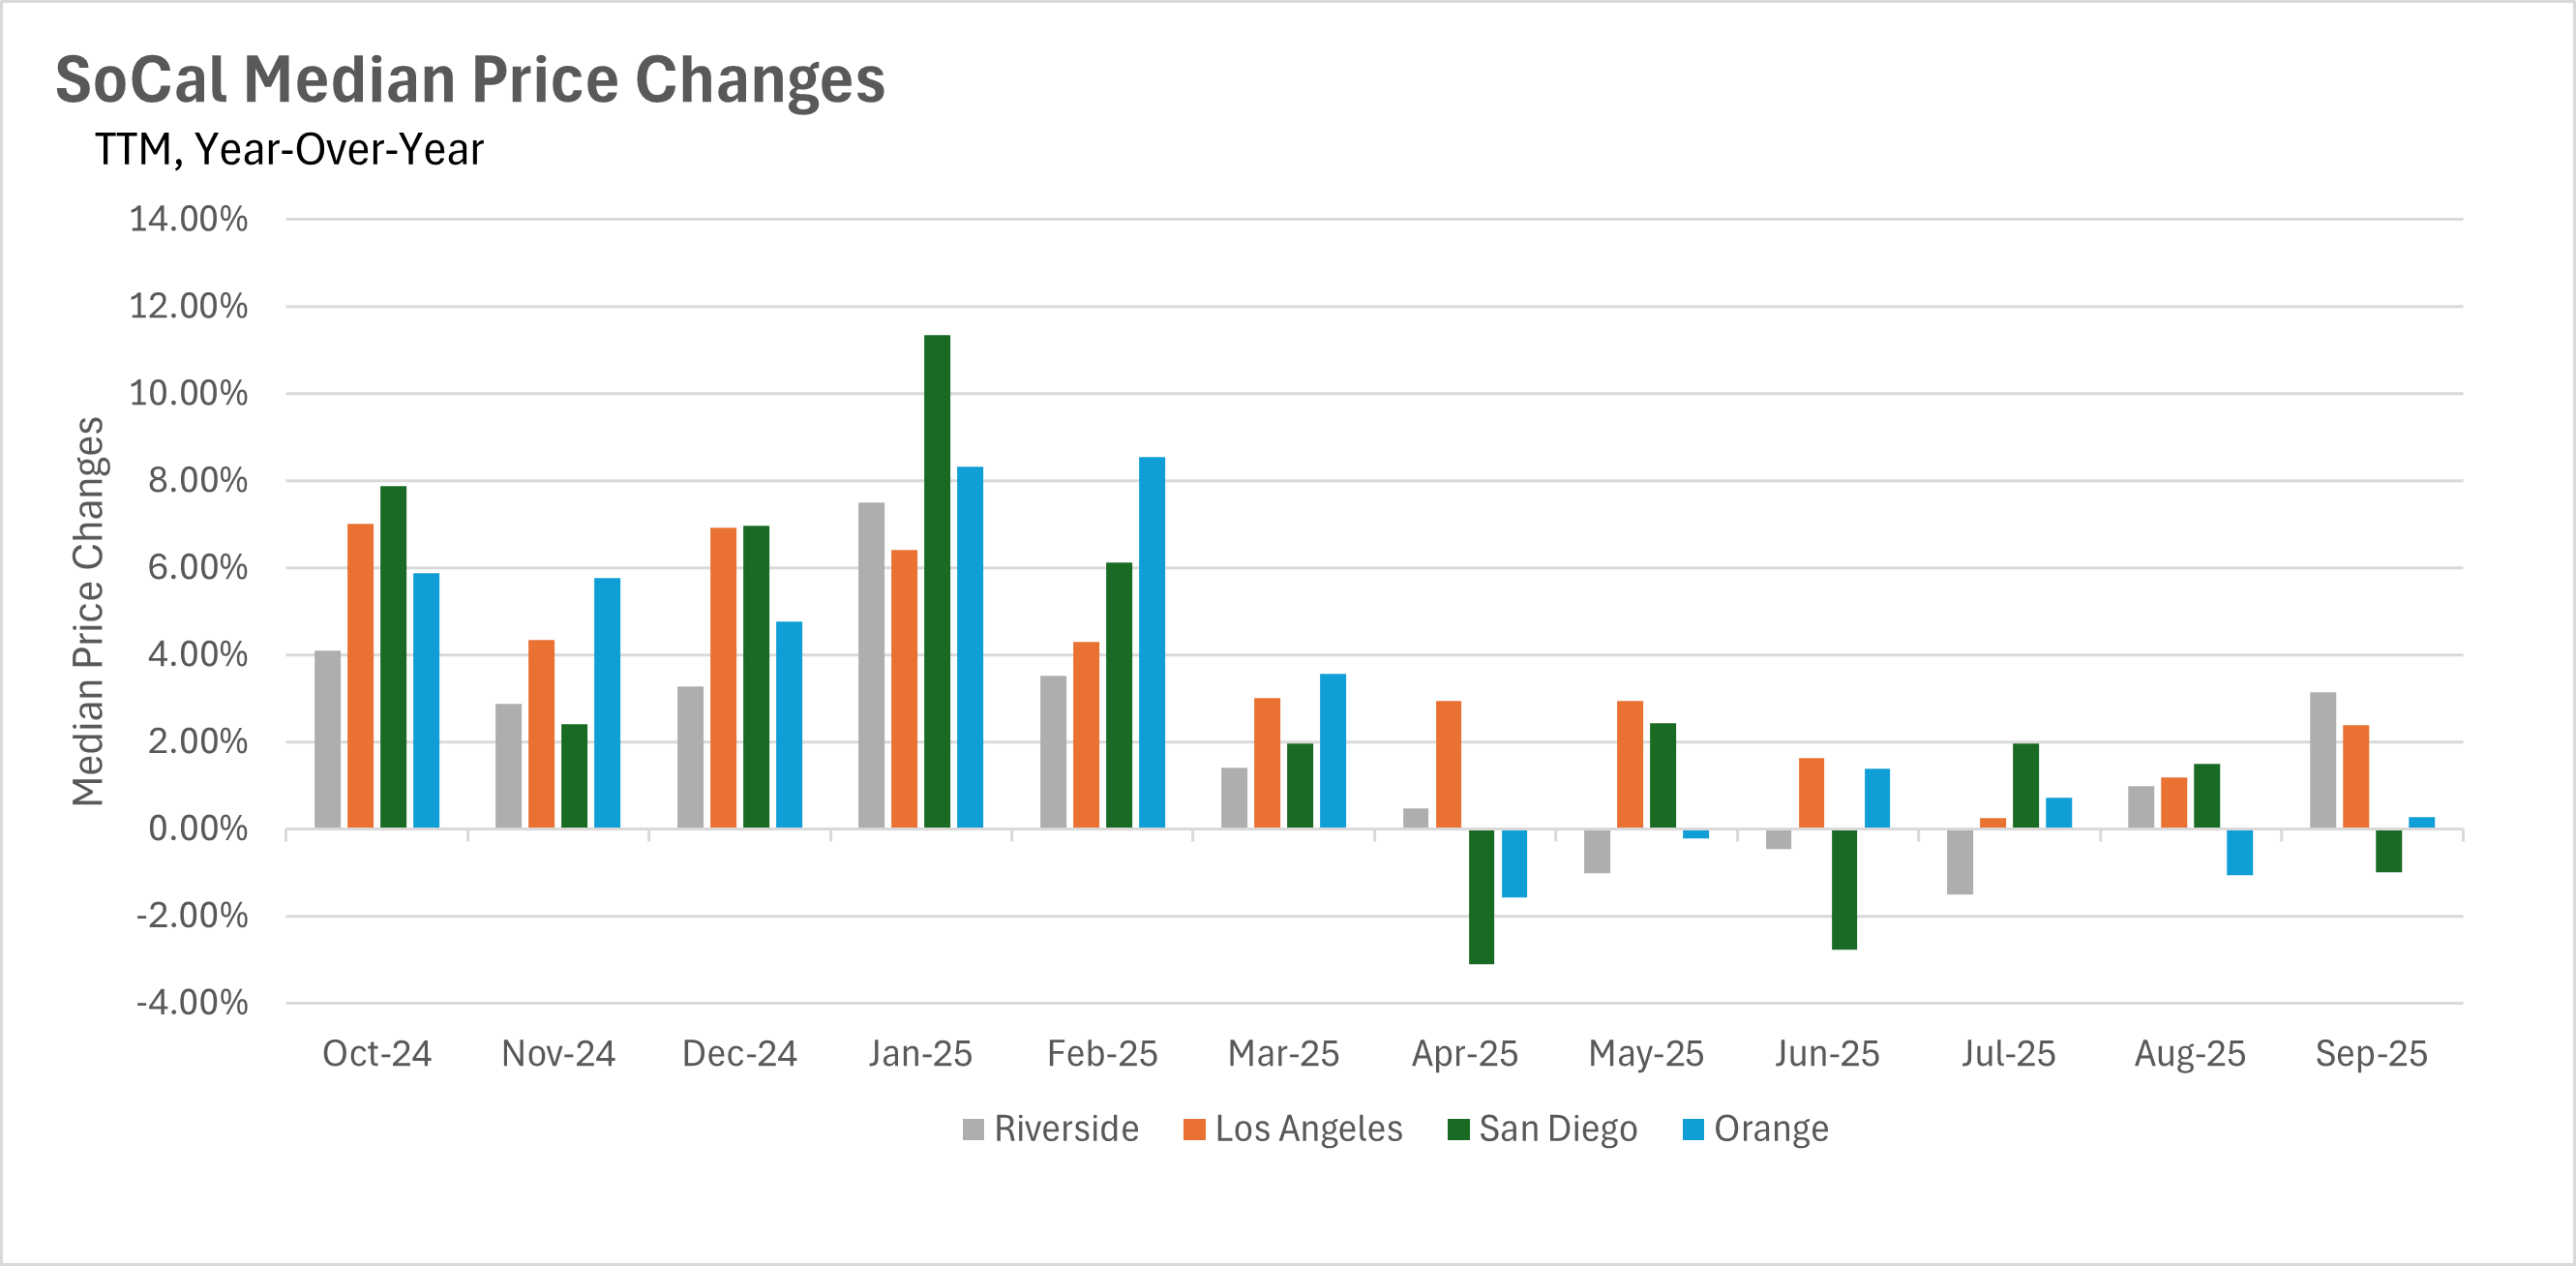
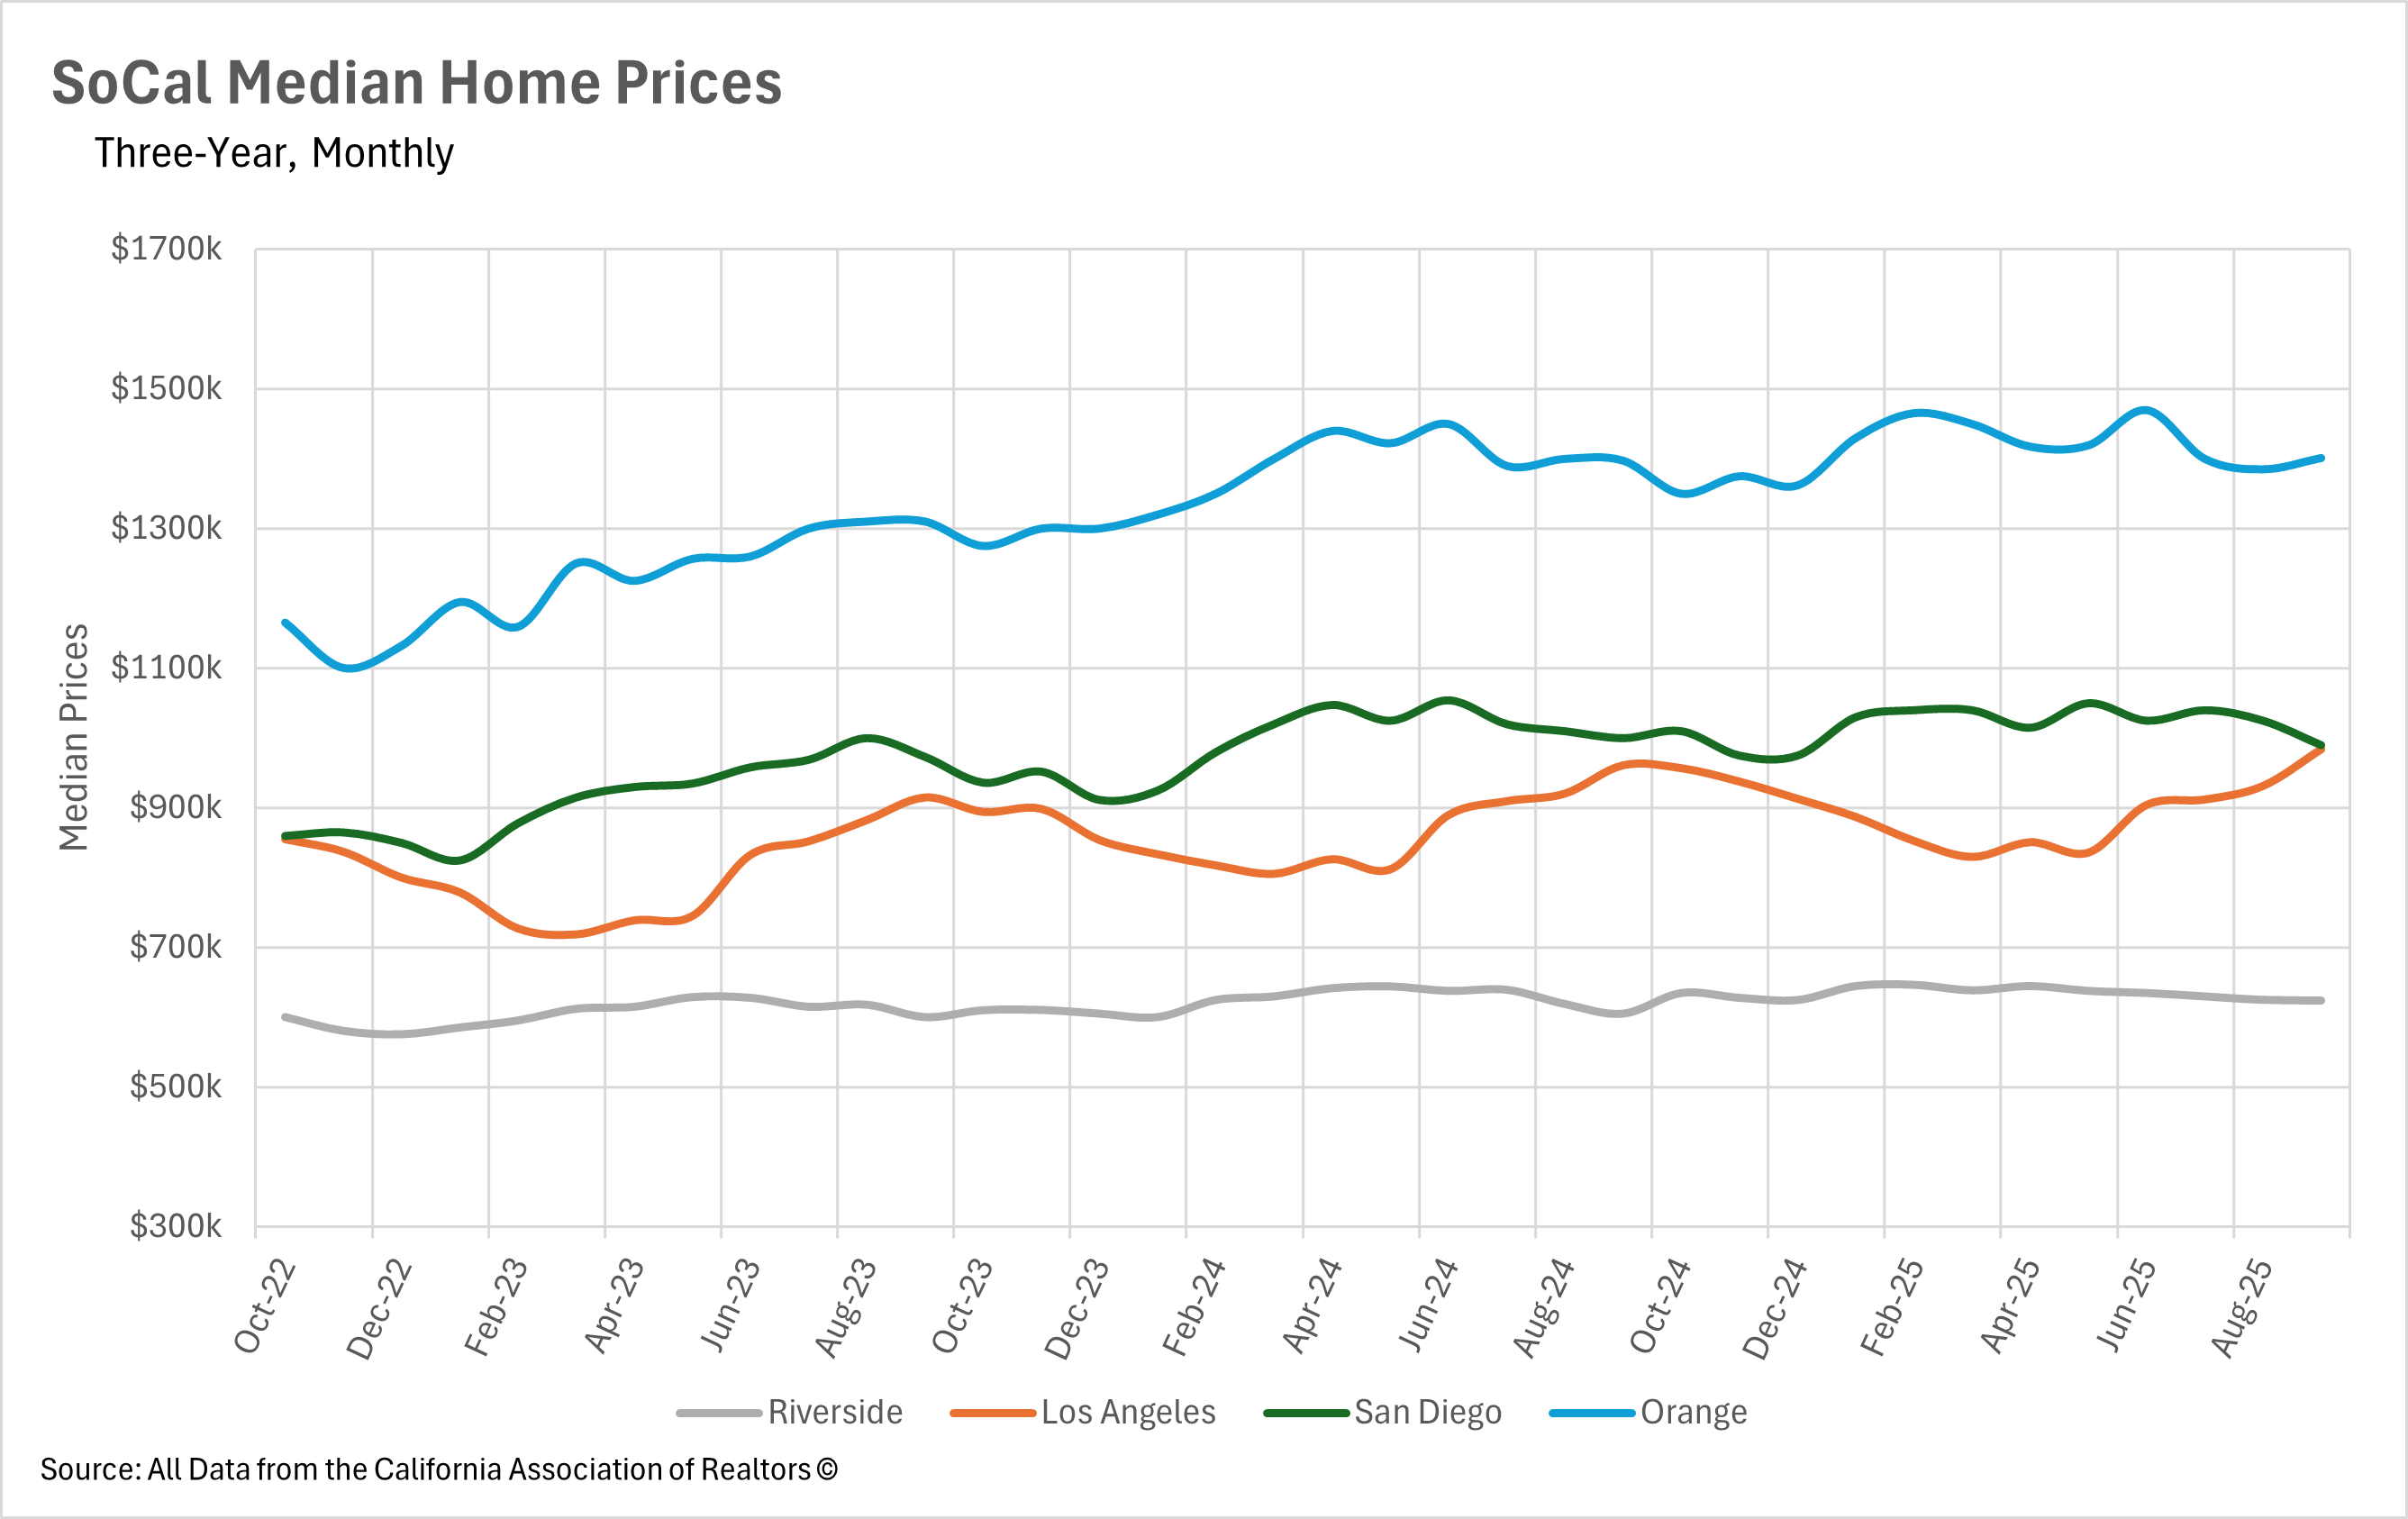
Southern California's housing markets are painting dramatically different pictures as we move through fall 2025, with each major region following its own distinct pricing trajectory. Los Angeles County delivered the most striking performance, with September's median price surging to $983,230 from August's $930,720, representing a substantial 2.38% year-over-year increase and marking the highest median sale price seen throughout 2025. This remarkable month-over-month appreciation of over $52,000 demonstrates the resilience of Los Angeles real estate values and suggests renewed momentum heading into the fall season.
In sharp contrast, San Diego experienced a notable correction with September's median price falling to $990,000, marking a 1.00% year-over-year decline and the first negative year-over-year comparison in several months after beginning the year with explosive double-digit growth. Orange County finds itself in near-equilibrium territory, with September's median of $1,401,250 representing just a minimal 0.27% increase compared to the prior year, a significant departure from the double-digit growth rates that characterized much of 2024. Meanwhile, Riverside continues to struggle with price momentum, posting a modest 3.14% year-over-year increase in September to $624,000, following several months of negative year-over-year comparisons including May's -1.01% and July's -1.51% declines.
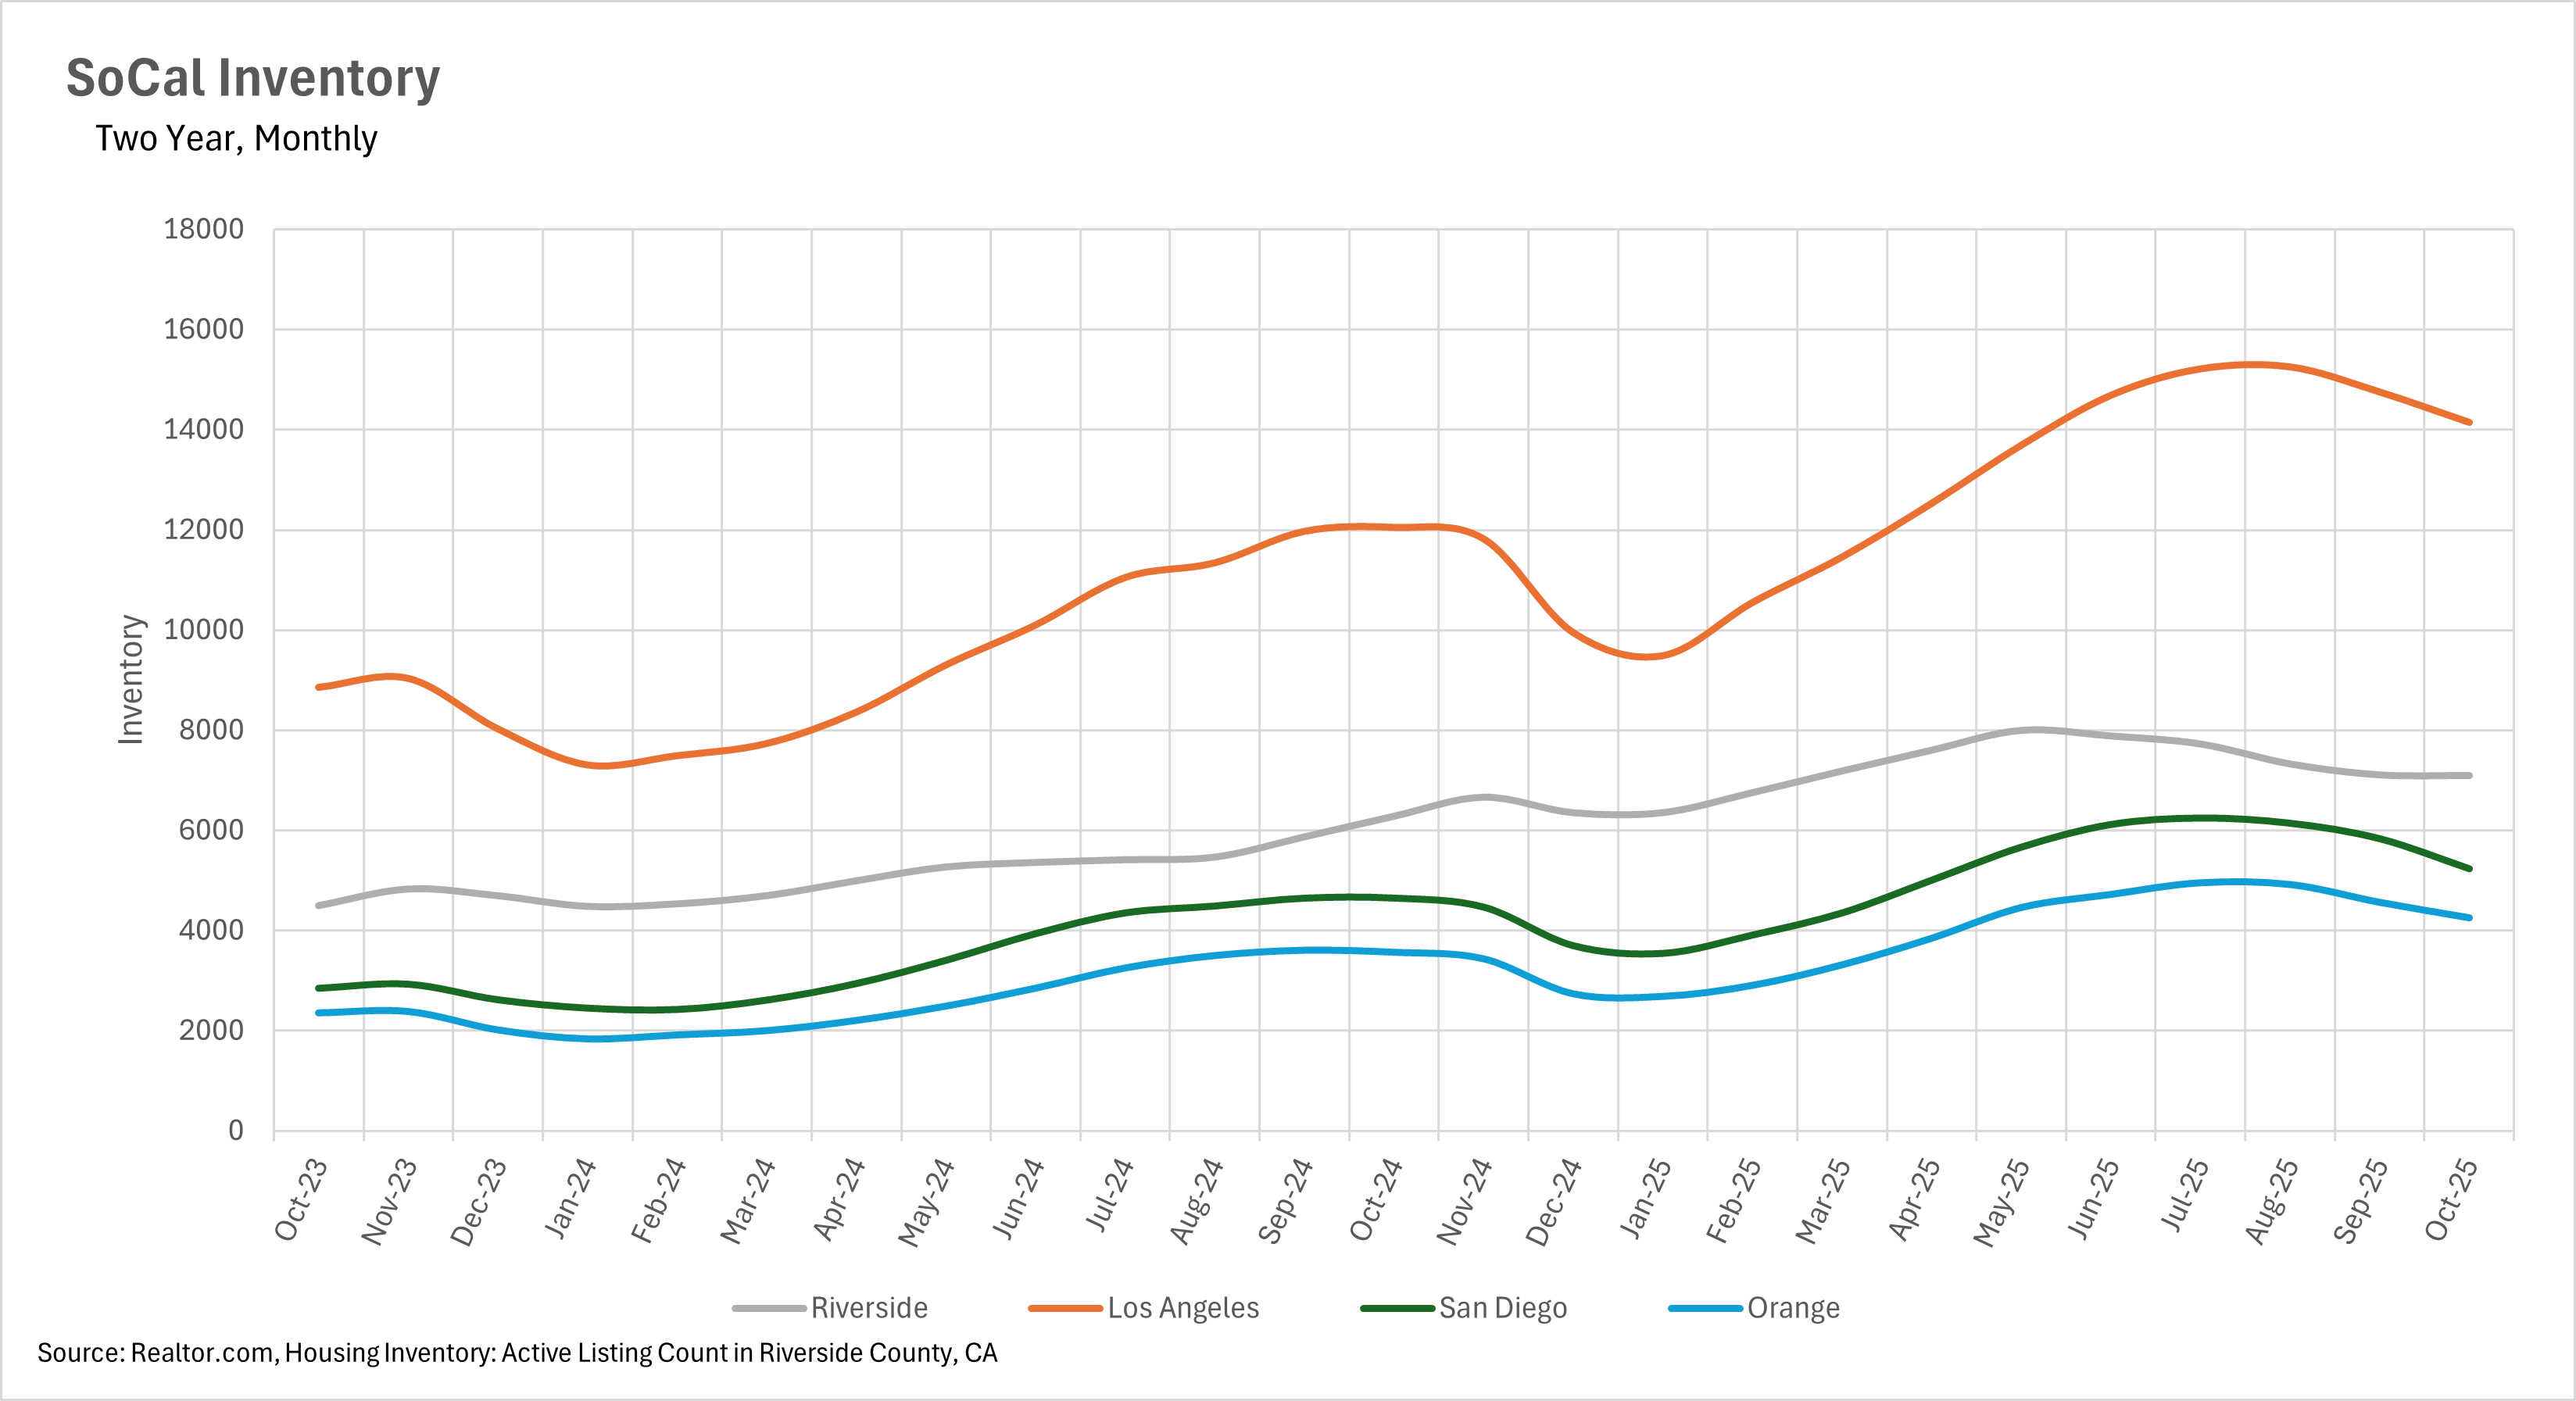
After experiencing dramatic inventory buildups throughout the spring and summer months, Southern California's housing markets have entered a period of accelerated inventory contraction as seasonal patterns reassert themselves. San Diego witnessed the most dramatic pullback, with October active listings plummeting 10.29% month-over-month to 5,233 homes, representing the most significant monthly inventory contraction in recent months and marking a clear shift in market dynamics. Los Angeles followed a similar pattern with October showing 14,151 active listings, a 4.11% decrease from September's 14,757 homes and continuing the downward trend from August's peak of 15,258 listings.
Orange County's inventory also continues its seasonal normalization, with October's 4,251 single-family homes representing a 6.80% month-over-month decline and marking the third consecutive month of declining inventory levels. Riverside experienced a more modest 5.15% month-over-month decrease in October to 7,092 listings. Despite these consistent month-over-month declines across all markets, inventory levels remain significantly elevated on a year-over-year basis, with Los Angeles still 17.38% higher than last year, Orange County up 19.31%, Riverside leading with a 33.90% increase, and San Diego maintaining a 12.61% year-over-year elevation.
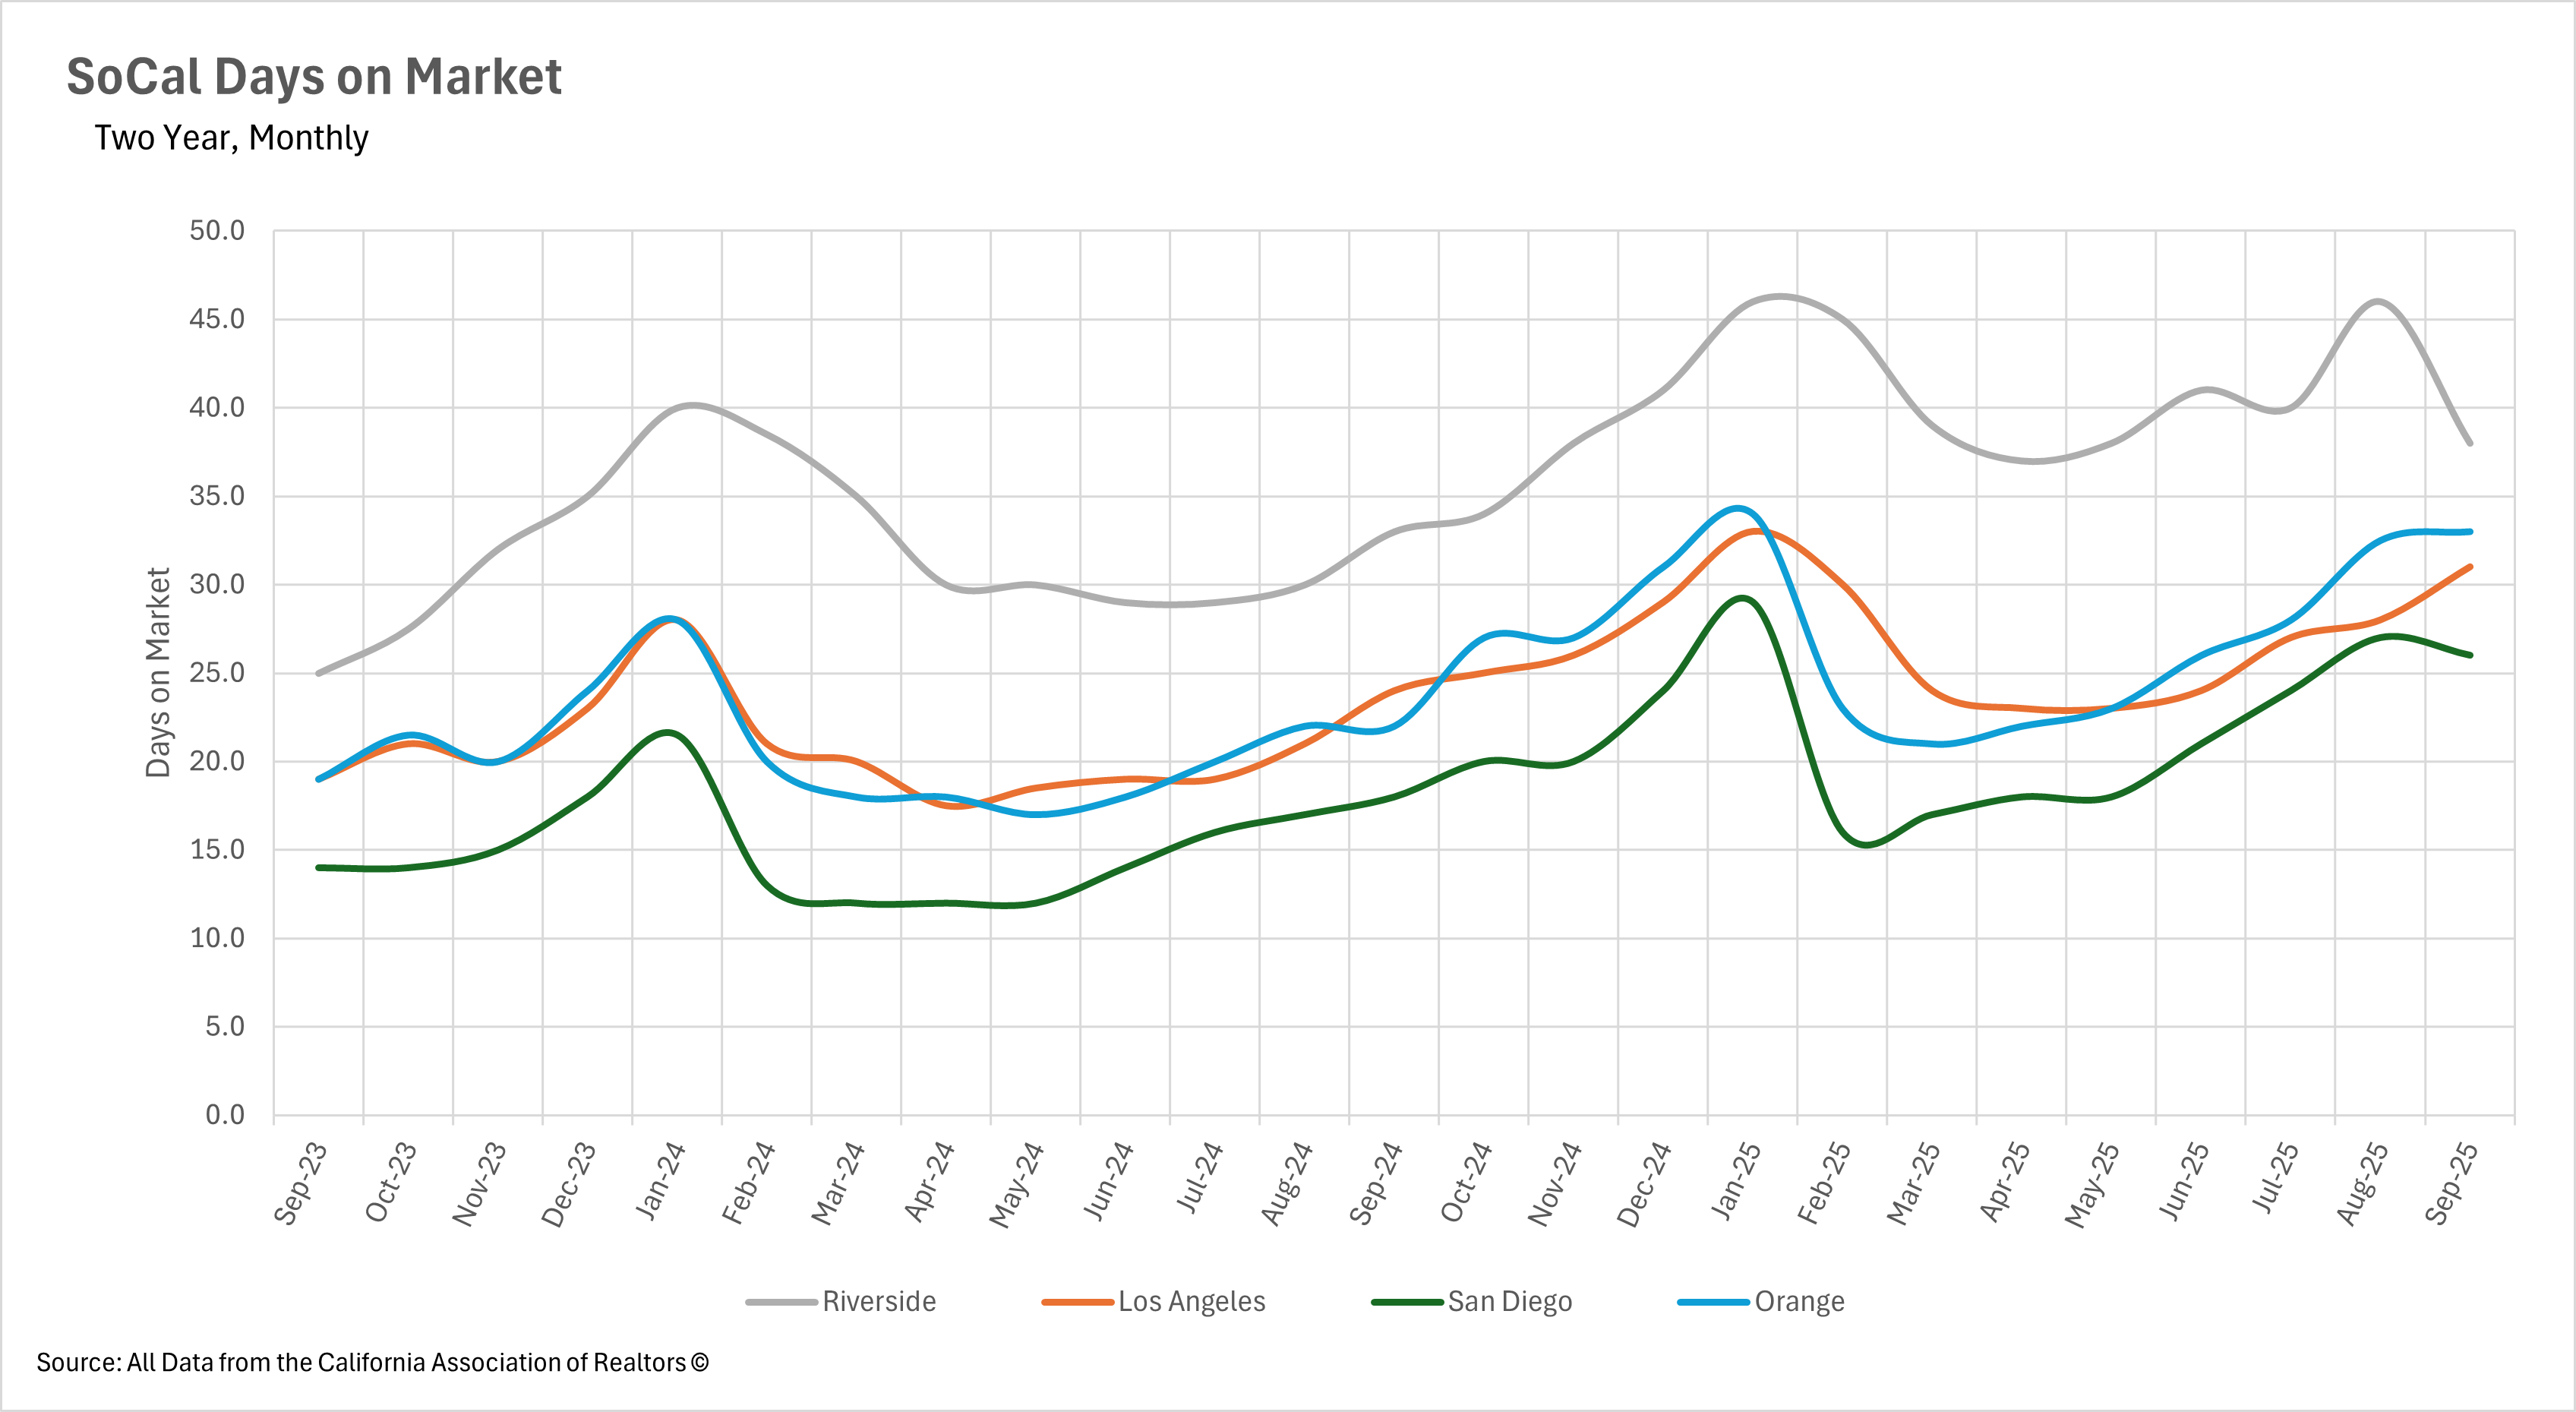
Perhaps the most striking indicator of the transformed market dynamics across Southern California is the dramatic extension in the time properties spend on the market, a trend that has persisted even as inventory levels have begun their seasonal decline. Orange County currently leads the region with the longest selling times, with properties now spending a median of 33 days on market, representing an extraordinary 50% increase from September 2024's 22 days and demonstrating that buyers have taken full control of the transaction pace. Los Angeles mirrors this pattern with September showing 31 days on market, a substantial 29.17% increase compared to the prior year's 24 days and marking one of the longest market times seen in recent years.
Riverside posts the highest days on market across all tracked regions at 38 days in September, representing a significant 37.93% year-over-year increase and up dramatically from the 25 days recorded in September 2023. San Diego provides the only bright spot in this metric, showing modest improvement with September's 26 days representing a 3.70% month-over-month decline from August's 27 days, though still up substantially at 44.44% year-over-year compared to September 2024's 18 days. The persistence of these extended timelines even as inventory contracts and prices show strength in some markets indicates a fundamental shift in buyer behavior, where purchasers are taking considerably more time to evaluate properties and negotiate terms regardless of competition levels.
When determining whether a market is a buyers' market or a sellers' market, we look to the Months of Supply Inventory (MSI) metric. The state of California has historically averaged around three months of MSI, so any area with at or around three months of MSI is considered a balanced market. Any market that has lower than three months of MSI is considered a sellers' market, whereas markets with more than three months of MSI are considered buyers' markets.
Southern California's housing markets have settled into distinctly different market classifications, reflecting the diverse dynamics playing out across the region. Los Angeles has made remarkable progress toward balance with 3.7 months of inventory currently available, showing a dramatic 13.95% decrease from August's 4.3 months and representing just a 2.78% increase compared to September 2024's 3.6 months. While buyers still maintain some advantages with supply slightly above the three-month threshold, the trend is clearly moving in sellers' favor. Orange County has achieved perfect market equilibrium, returning to balanced territory with exactly 3.0 months of supply in September 2025, representing a significant 6.25% month-over-month decrease and, remarkably, a 3.23% year-over-year decrease from September 2024's 3.1 months.
San Diego similarly maintains balanced market conditions with 3.1 months of supply in September, showing continued improvement from the peak of 3.6 months seen in June and marking a turning point with a 3.13% year-over-year decline. In contrast, Riverside remains firmly in buyers' market territory with 4.2 months of supply in September, still well above the three-month balanced threshold despite showing some modest improvement from earlier peaks. The divergent market classifications across Southern California suggest that buyers and sellers must approach negotiations with strategies tailored to their specific local market conditions rather than assuming regional uniformity.
Stay up to date on the latest real estate trends.

July 2026

A Closer Look at Dallas Rental Prices, Hidden Costs, and What Renters Need to Know Before Moving

June 2026

May 2026

April 2026
March 2026

February 2026
January 2026

Trusted Experts in the Palisades, Santa Monica, and Brentwood Real Estate Markets
You’ve got questions and we can’t wait to answer them.