Market Update Dallas

Note: You can find the charts & graphs for the Big Story at the end of the following section.
*National Association of REALTORS® data is released two months behind, so we estimate the most recent month’s data when possible and appropriate.
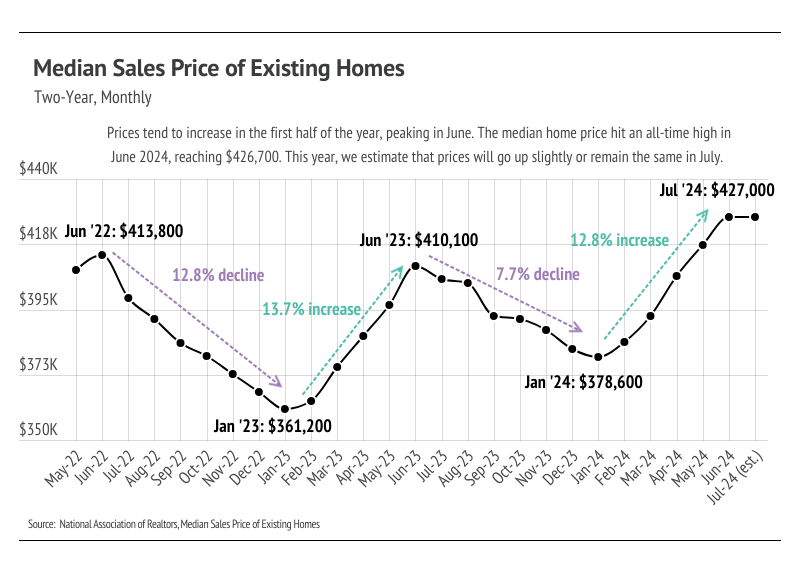
In June, prices rose for the fifth month in a row, reaching all-time highs. Typically, home prices begin to fall in July, but this year may be different. Currently, we estimate data to show that the national median home price rose very slightly in July. We are confident, at least, that prices have not fallen 5% from June to July, which means that July was the 13th consecutive month of year-over-year price growth. Despite the seasonal price dip, which is surely coming in the second half of the year, year-over-year price growth will almost certainly continue for months to come.
So why won’t prices see a major shift downward in the second half of the year? Seasonal trends already dictate that prices will decline starting around now. Combine that with high mortgage rates, slowing sales, and the highest inventory in four years, and it seems like we have the perfect recipe for prices to fall significantly. While home prices tend to increase over time, the pandemic buying boom set the stage for prices to rise more quickly than expected, and to stay high. In a funny way, higher interest rates have been incentivizing higher prices due to the cost of selling and buying at the same time. From June 2019 to March 2022, the average 30-year mortgage rate was less than 4%, and the averages for all of 2020 and 2021 were 3.11% and 2.95%, respectively. All that to say, those buyers who purchased their homes through financing, as most buyers do, in 2020 or 2021, and who plan to buy their next homes through financing at a much higher rate — they need to sell their current homes for much higher to combat the cost of financing new ones.
To further the point, the cost of financing the median home in June 2024 has increased 83% compared to June 2021, even though the sticker price of the median home is only up 16%. However, let’s say you bought the median home in June 2021 with 20% down, and then in June 2024, both sold your old median price home and bought the June 2024 median price home, your mortgage would only go up 55% rather than 83% because of the $60,000 price appreciation, which would bring you to ~30% equity in the new home. To be clear, 55% is still a lot, but it’s better than 83%.
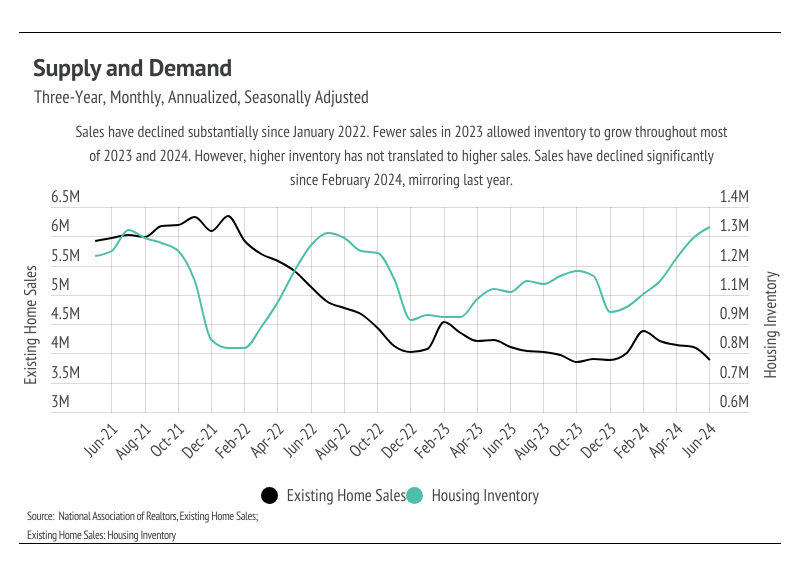
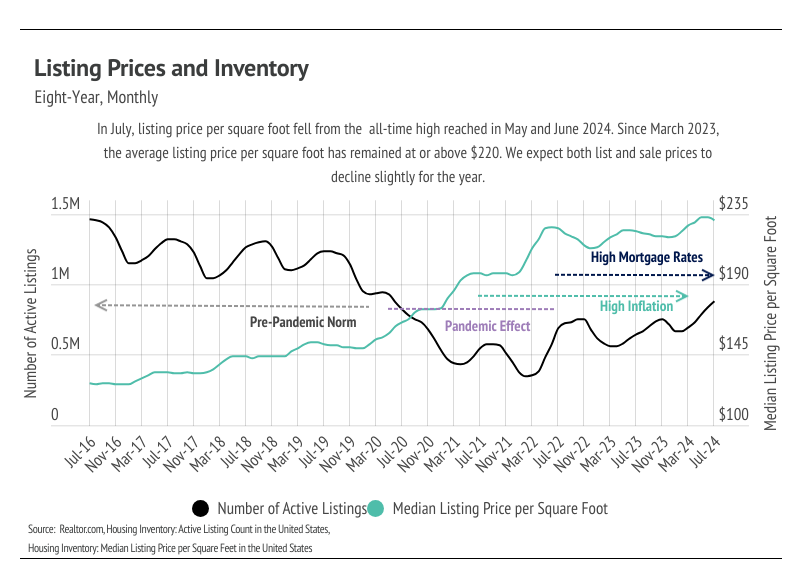
Overall, inventory growth is great news for the undersupplied U.S. housing market. According to data from realtor.com, inventory reached its highest level since June 2020. The increasing inventory level should cause rising home prices to slow. In the pre-pandemic seasonal trends, sales, new listings, inventory, and price would roughly all rise in the first half of the year and decline in the second half of the year. Sales and new listings have been far lower than usual since mortgage rates started climbing, which is to be expected. Because we don’t anticipate sales to pick up until the spring of 2025, inventory could easily continue to grow in the second half of the year. Fed rate cuts will come right when the market really starts to slow down, so they probably won’t drive the market into a buying frenzy in the fourth quarter.
Different regions and individual houses vary from the broad national trends, so we’ve included a Local Lowdown below to provide you with in-depth coverage for your area. As always, we will continue to monitor the housing and economic markets to best guide you in buying or selling your home.
Note: You can find the charts/graphs for the Local Lowdown at the end of this section.
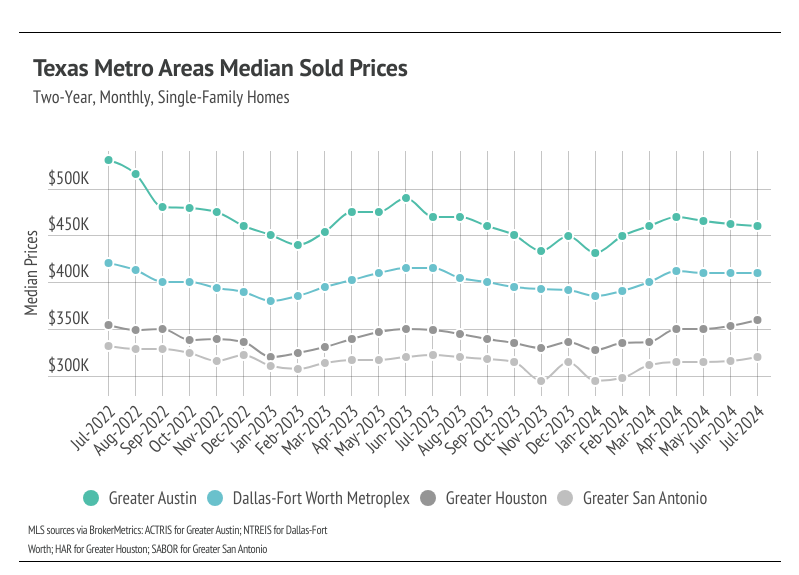
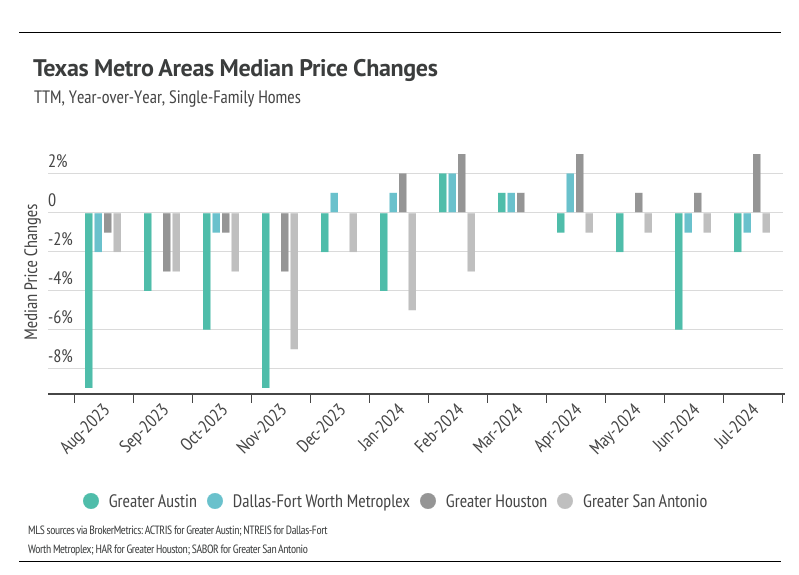
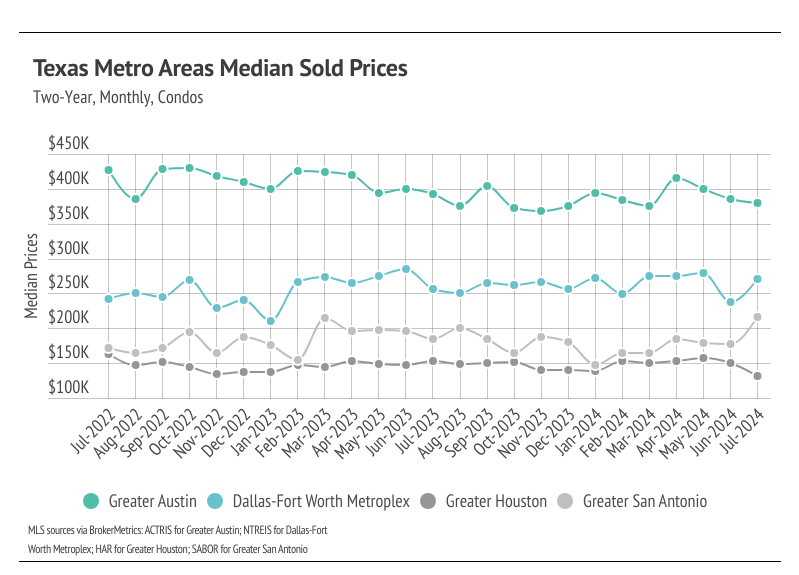
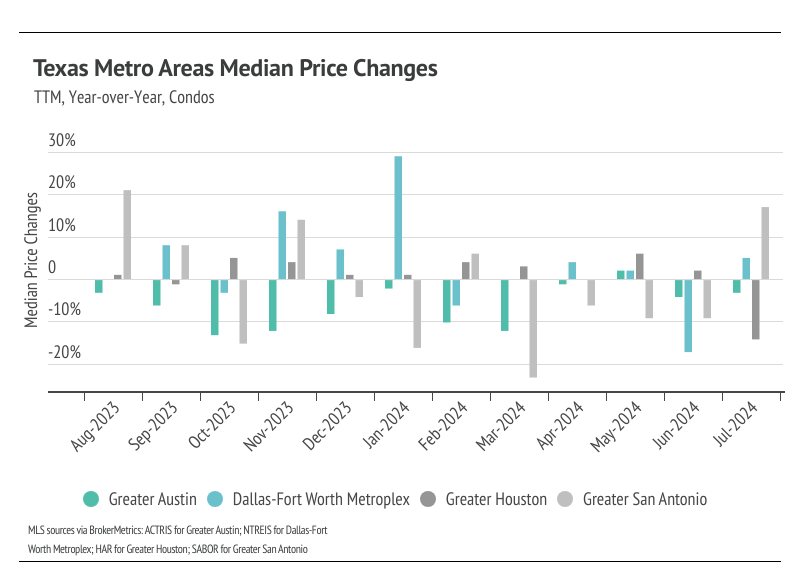
In Texas, home prices haven’t been largely affected by rising mortgage rates with the exception of Greater Austin, which has had a major price contraction from May 2022 to February 2023. Broadly, price contractions are normal in the fall and winter months of any year, so it’s hard to conclude that higher rates had any meaningful effect on price across most of Texas’ major metros. Since February 2023, prices have been fairly stable across markets, however. We expected prices to remain below peak in the winter, but as seasonal demand increased in the spring, prices started to increase. However, we don’t expect record high prices for the rest of this year. The inventory buildup in 2023 and 2024 has created a healthier market, satiating demand as it has grown. We do expect some minor price contraction in the coming months.
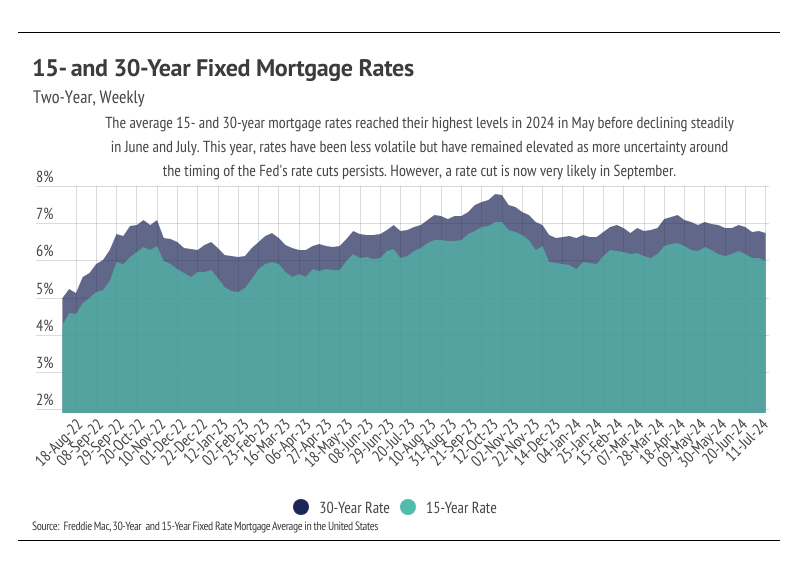
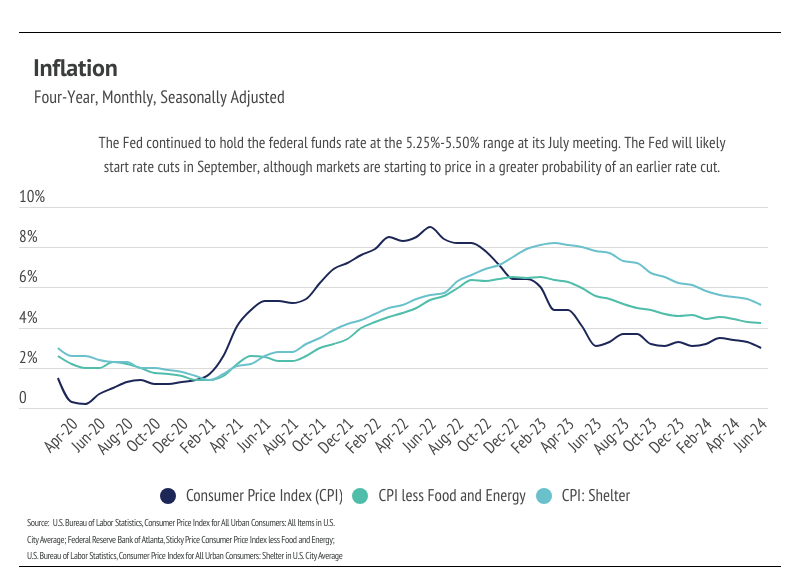
High mortgage rates soften both supply and demand, but home buyers and sellers seemed to tolerate rates near 6%. Now that rates are declining again, sales could get a little boost, but the housing market typically begins to slow this time of year.
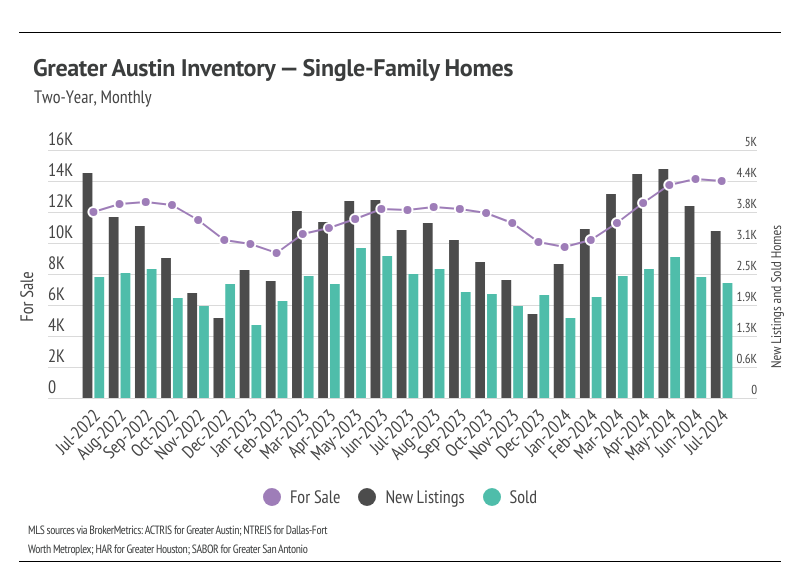
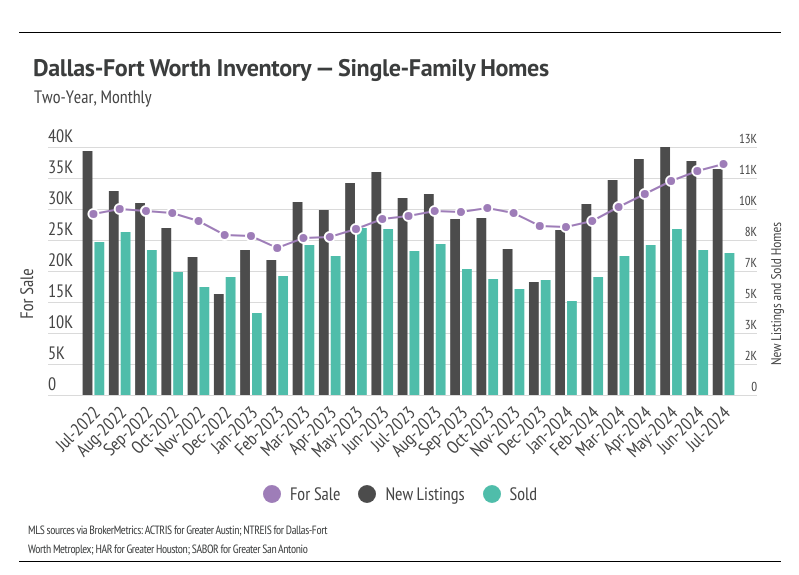
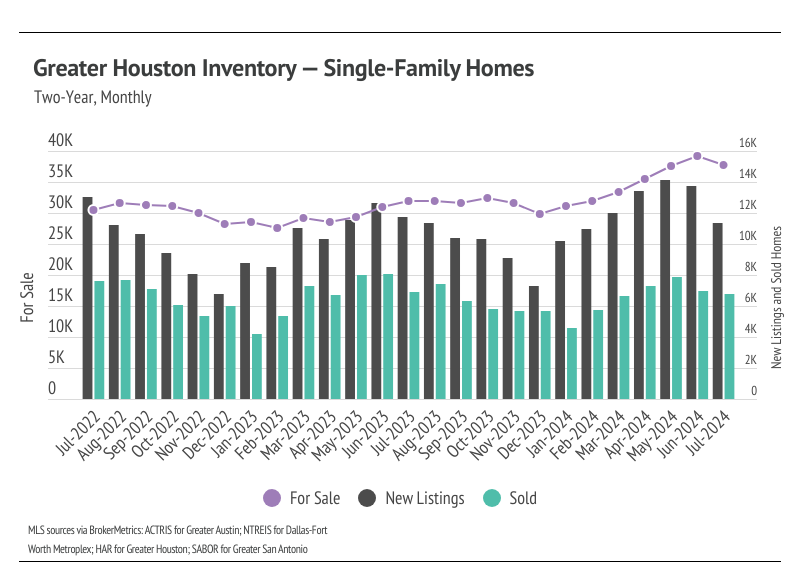
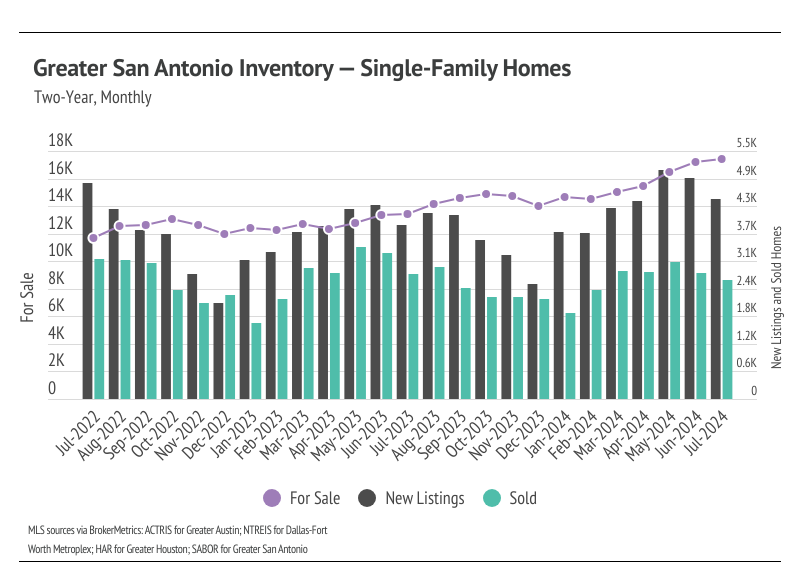
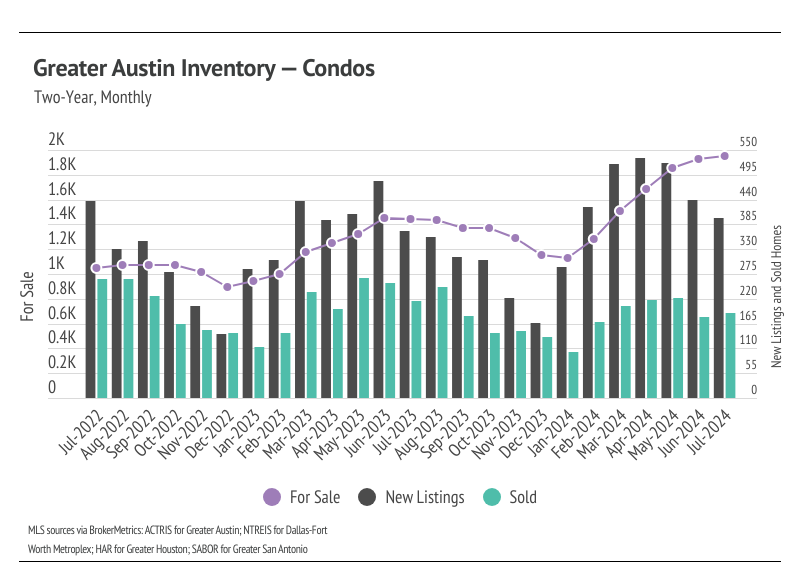
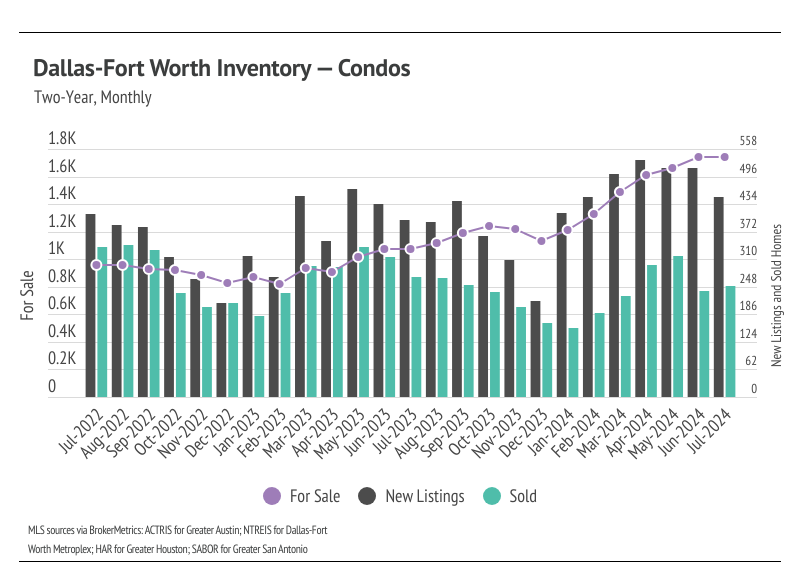
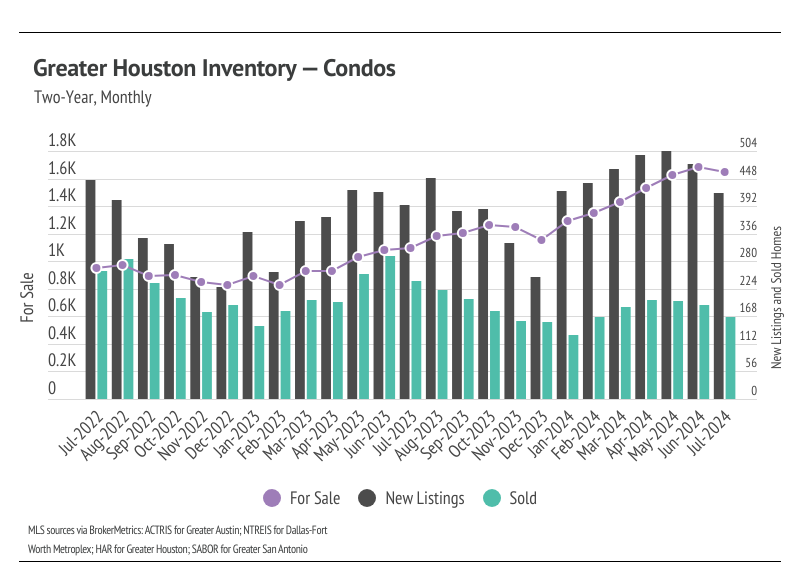
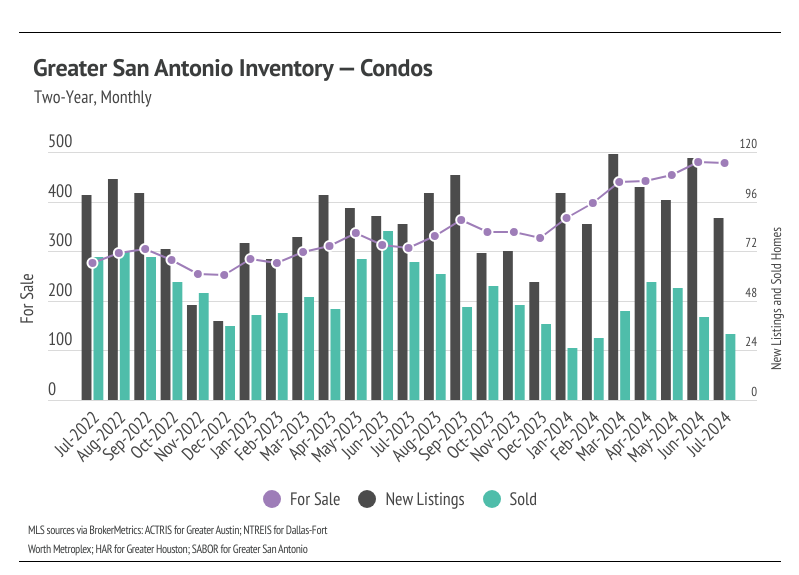
Inventory trended higher into the fall of 2023 and winter 2023/2024, which is far from the seasonal norm. Typically, inventory peaks in July or August and declines through December or January. Inventory levels in Texas’ major metro areas are unusual in the United States, in that they actually built up to pre-pandemic levels in 2023, moving higher primarily due to softening demand caused by higher interest rates. During Q4 2023, inventory peaked in October before declining slightly in November and December, as sales and new listings declined.
In 2024, inventory began to increase once again. Notably, inventory across markets reached a two-year high in May and then again in June. The number of new listings coming to market is a significant predictor of sales, and the substantial increase in new listings so far in 2024 has led to an increase in sales through May month over month. In June and July, new listings and sales declined, which is the seasonal norm.
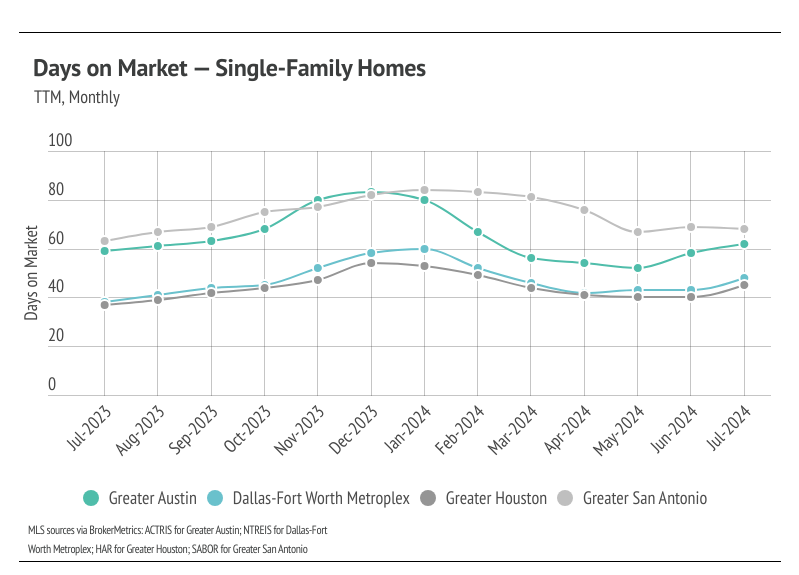
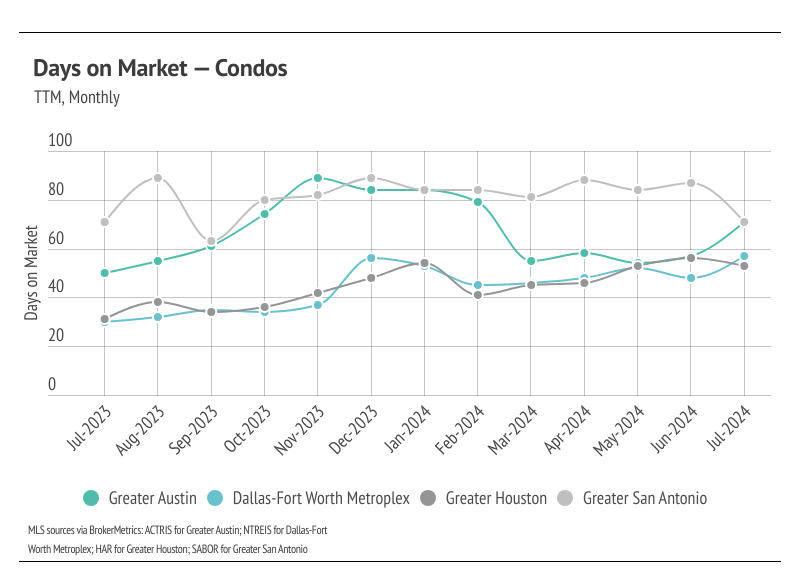
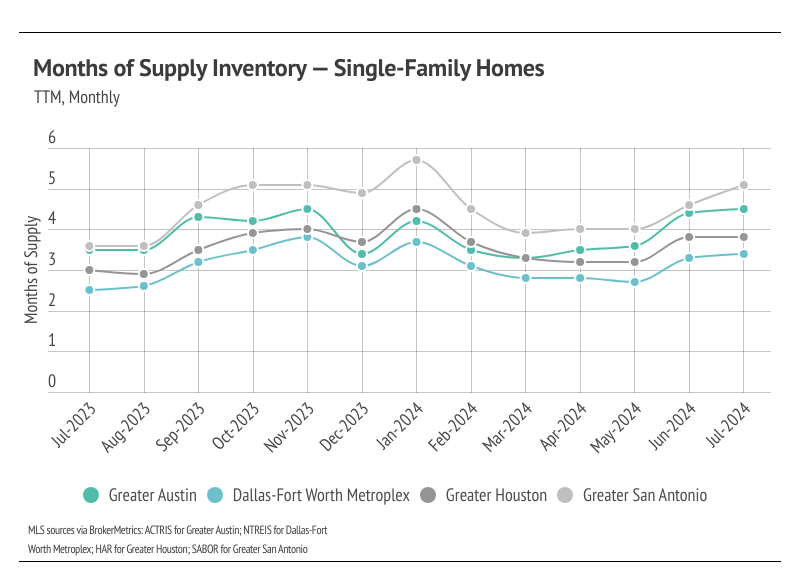
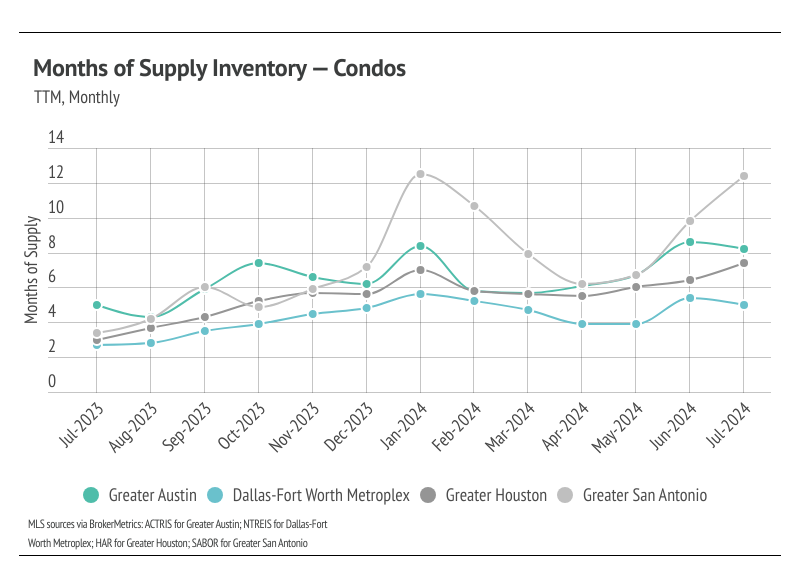
Months of Supply Inventory (MSI) quantifies the supply/demand relationship by measuring how many months it would take for all current homes listed on the market to sell at the current rate of sales. The long-term average MSI is around four to five months in Texas, which indicates a balanced market. An MSI lower than four indicates that there are more buyers than sellers on the market (meaning it’s a sellers’ market), while an MSI higher than five indicates there are more sellers than buyers (meaning it’s a buyers’ market). MSI trended higher from May 2023 to January 2024 largely due to the decline in sales and longer time on the market. However, in February and March 2024, MSI declined across markets as sales rose and homes sold at a faster rate. April and May MSI movements were mixed in Texas markets, and in June, MSI rose across markets. Currently, for single-family homes, MSI indicates that Greater San Antonio is balanced, while Greater Austin, Greater Houston, and Dallas-Fort Worth favor sellers. For condos, MSI indicates that the markets favor buyers except for Dallas-Fort Worth, which is more balanced.
Stay up to date on the latest real estate trends.

July 2026

A Closer Look at Dallas Rental Prices, Hidden Costs, and What Renters Need to Know Before Moving

June 2026

May 2026

April 2026

March 2026

February 2026
January 2026

Trusted Experts in the Palisades, Santa Monica, and Brentwood Real Estate Markets
You’ve got questions and we can’t wait to answer them.