Leave a Message

Thank you for your message. We will be in touch with you shortly.

June Palisades Pulse

June Palisades Pulse
🔹 Rebuilding Process

  • As of June 1, the City of Los Angeles has issued 82 permits across 64 addresses for Palisades homes, with hundreds more currently under review.
  • Pacific Coast Highway reopened last week to the general public,
  • Temescal Canyon Road is also undergoing street repair as they plan on reopening this month. It has been used for the past 5 months as a debris recycling site (concrete and steel). [See Instagram video on it]. Since Temescal is one of the three main thoroughfares in and out of the Palisades, it will be great to have it open again.
 

🔹 Real Estate Market Snapshot-Palisades Land Activity Since February 2025

  • 305 total land listings have come on the market
  • Active: 195
  • In Escrow: 29
  • Sold: 55
  • Cancelled/Withdrawn: 24
  • On Hold: 2
 
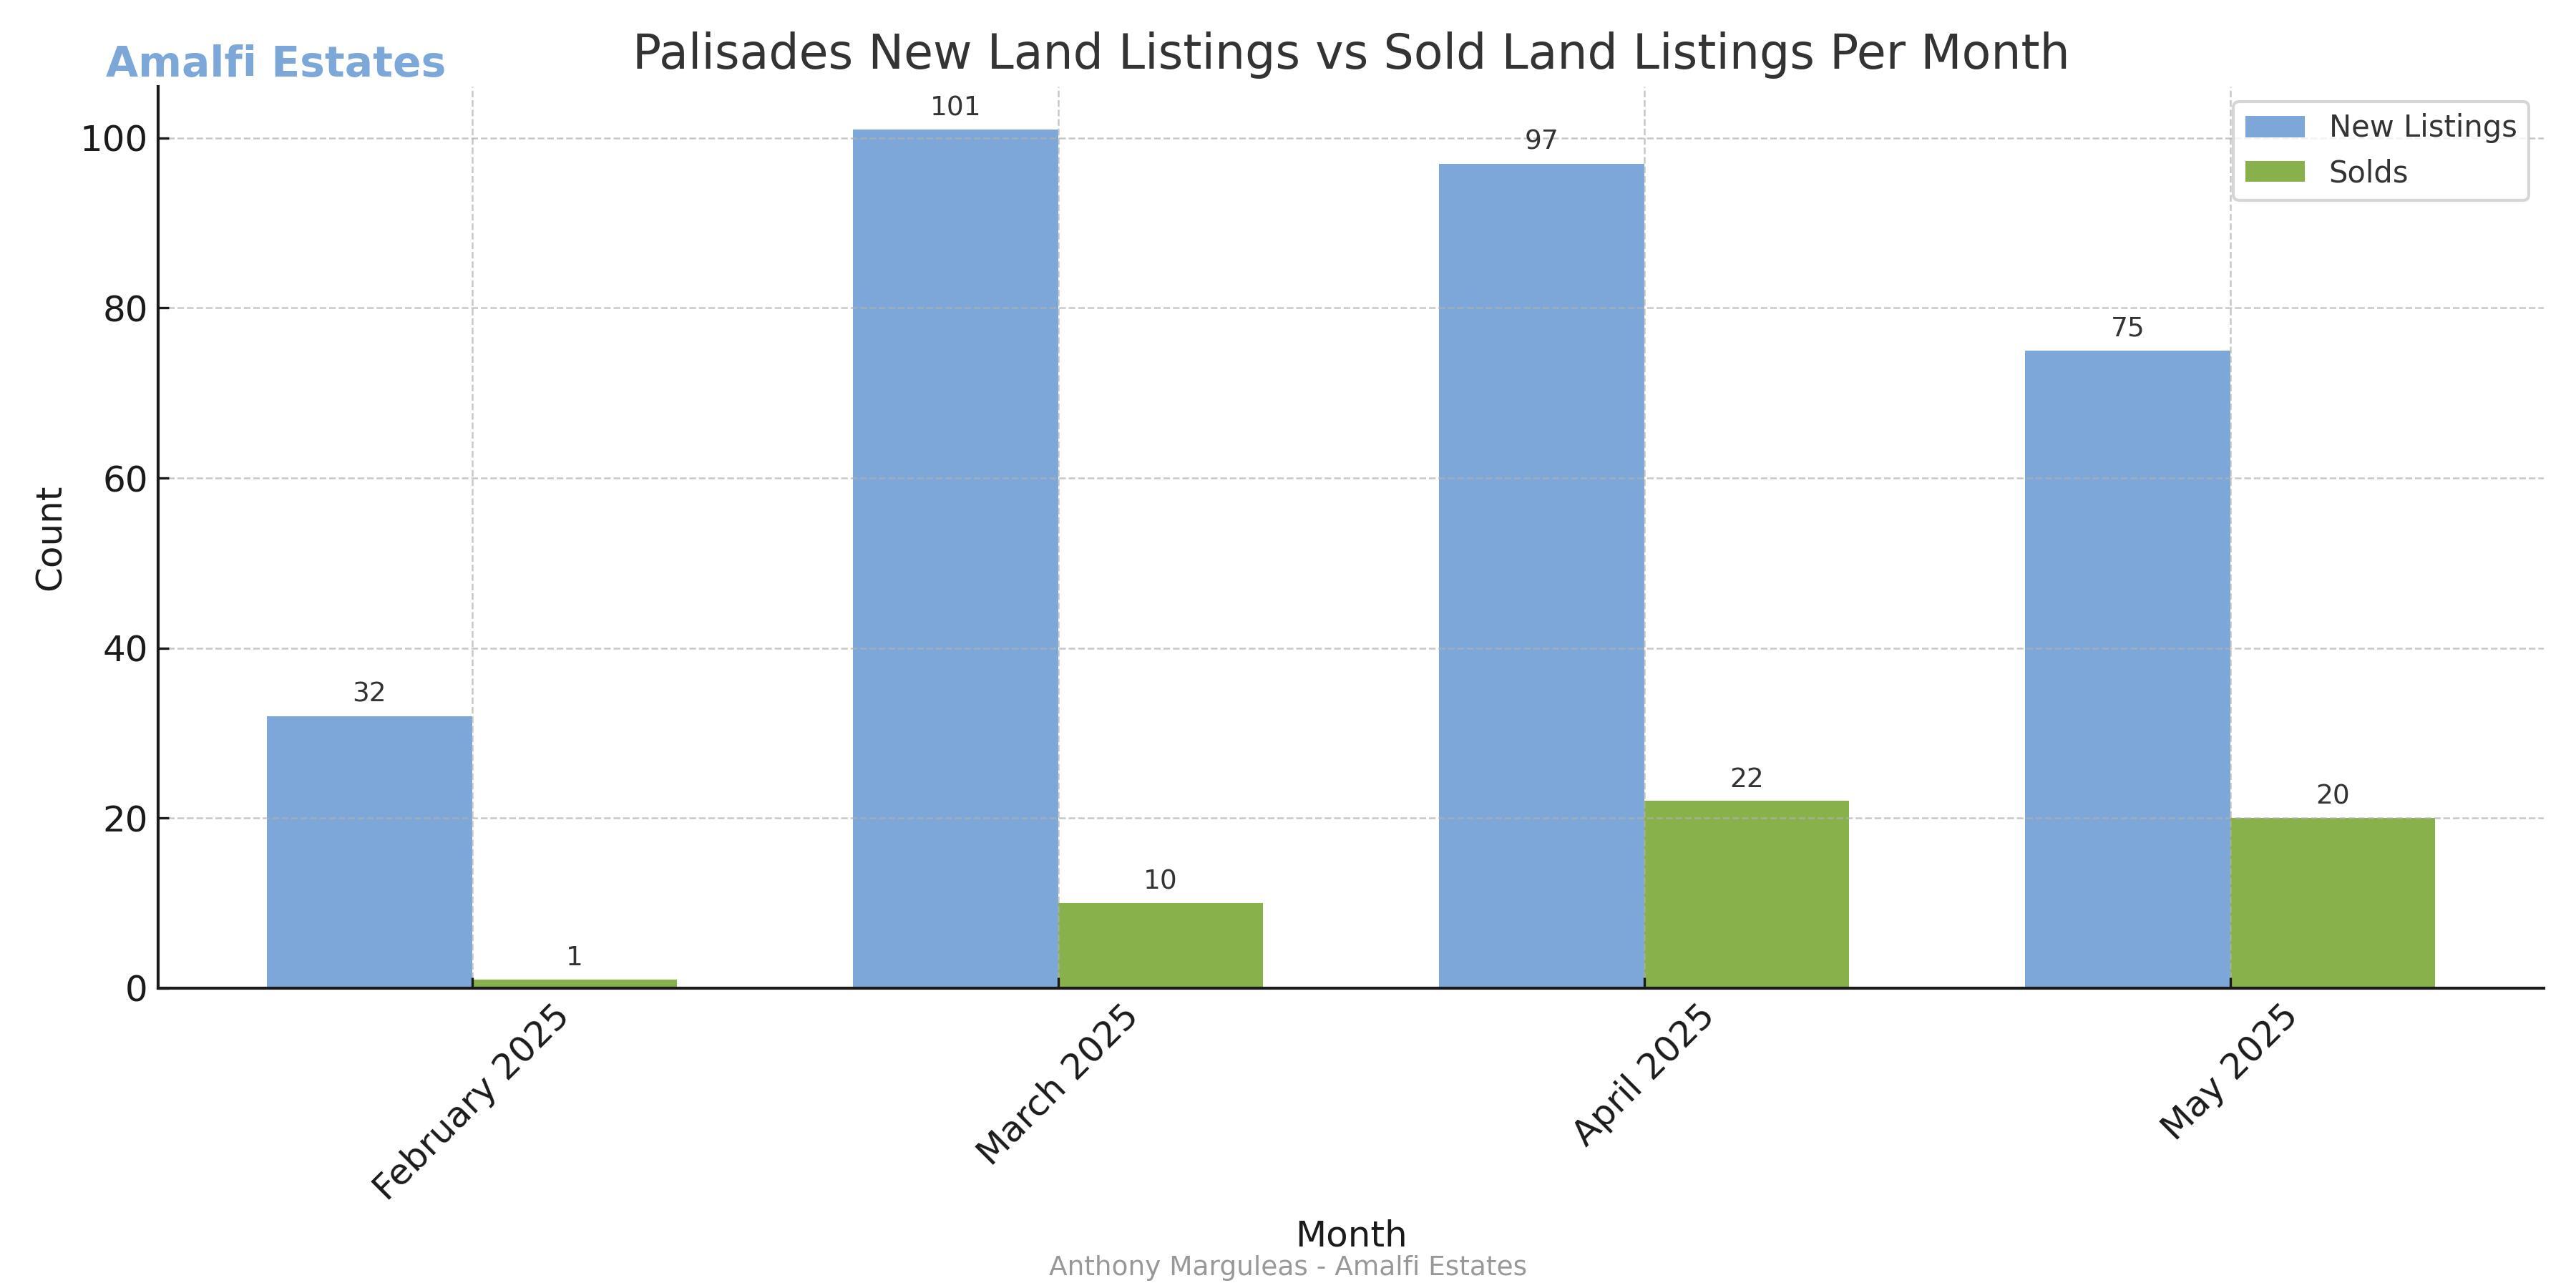
Inventory vs Sales
New land listings continue to outpace sold lots, even as buyer interest picks up. The encouraging news is that the gap is lessening.
 
One trend to keep an eye on is the number of active land listings, as seen in the April to May period, where it dropped 23% (97 new land listings compared to 75). The main reason the number of land listings has dropped is sellers realize their lots have lost 35-40% of their equity (except for the Huntington, which has held its value much better). Many are deciding whether they should sell now or wait for the market to recover in a few years (if they have the time and financial resources to do so).
 
With approximately 6,800 Palisades residences destroyed, we expect about 30% will not want to rebuild, so around 1,800 - 2,000 lots will eventually come on the market. Therefore, we need to see many more lots come on the market, or it will take 20 + months for Palisades' land inventory to peak. (20 months x 75 new land listings per month =1500 + the existing 300 that have already come on=1800 lots). We expect active inventory to increase from 195 currently to a peak of 1000 active lots (at one time) on the market before we can start shifting from a buyer's market.
 
This chart illustrates the narrowing gap in monthly sold listings as a percentage of new listings. It will be interesting to see what the next few months bring. We will need to see at least a 50% absorption rate.


🔹 Sold Listings as % of New Listings


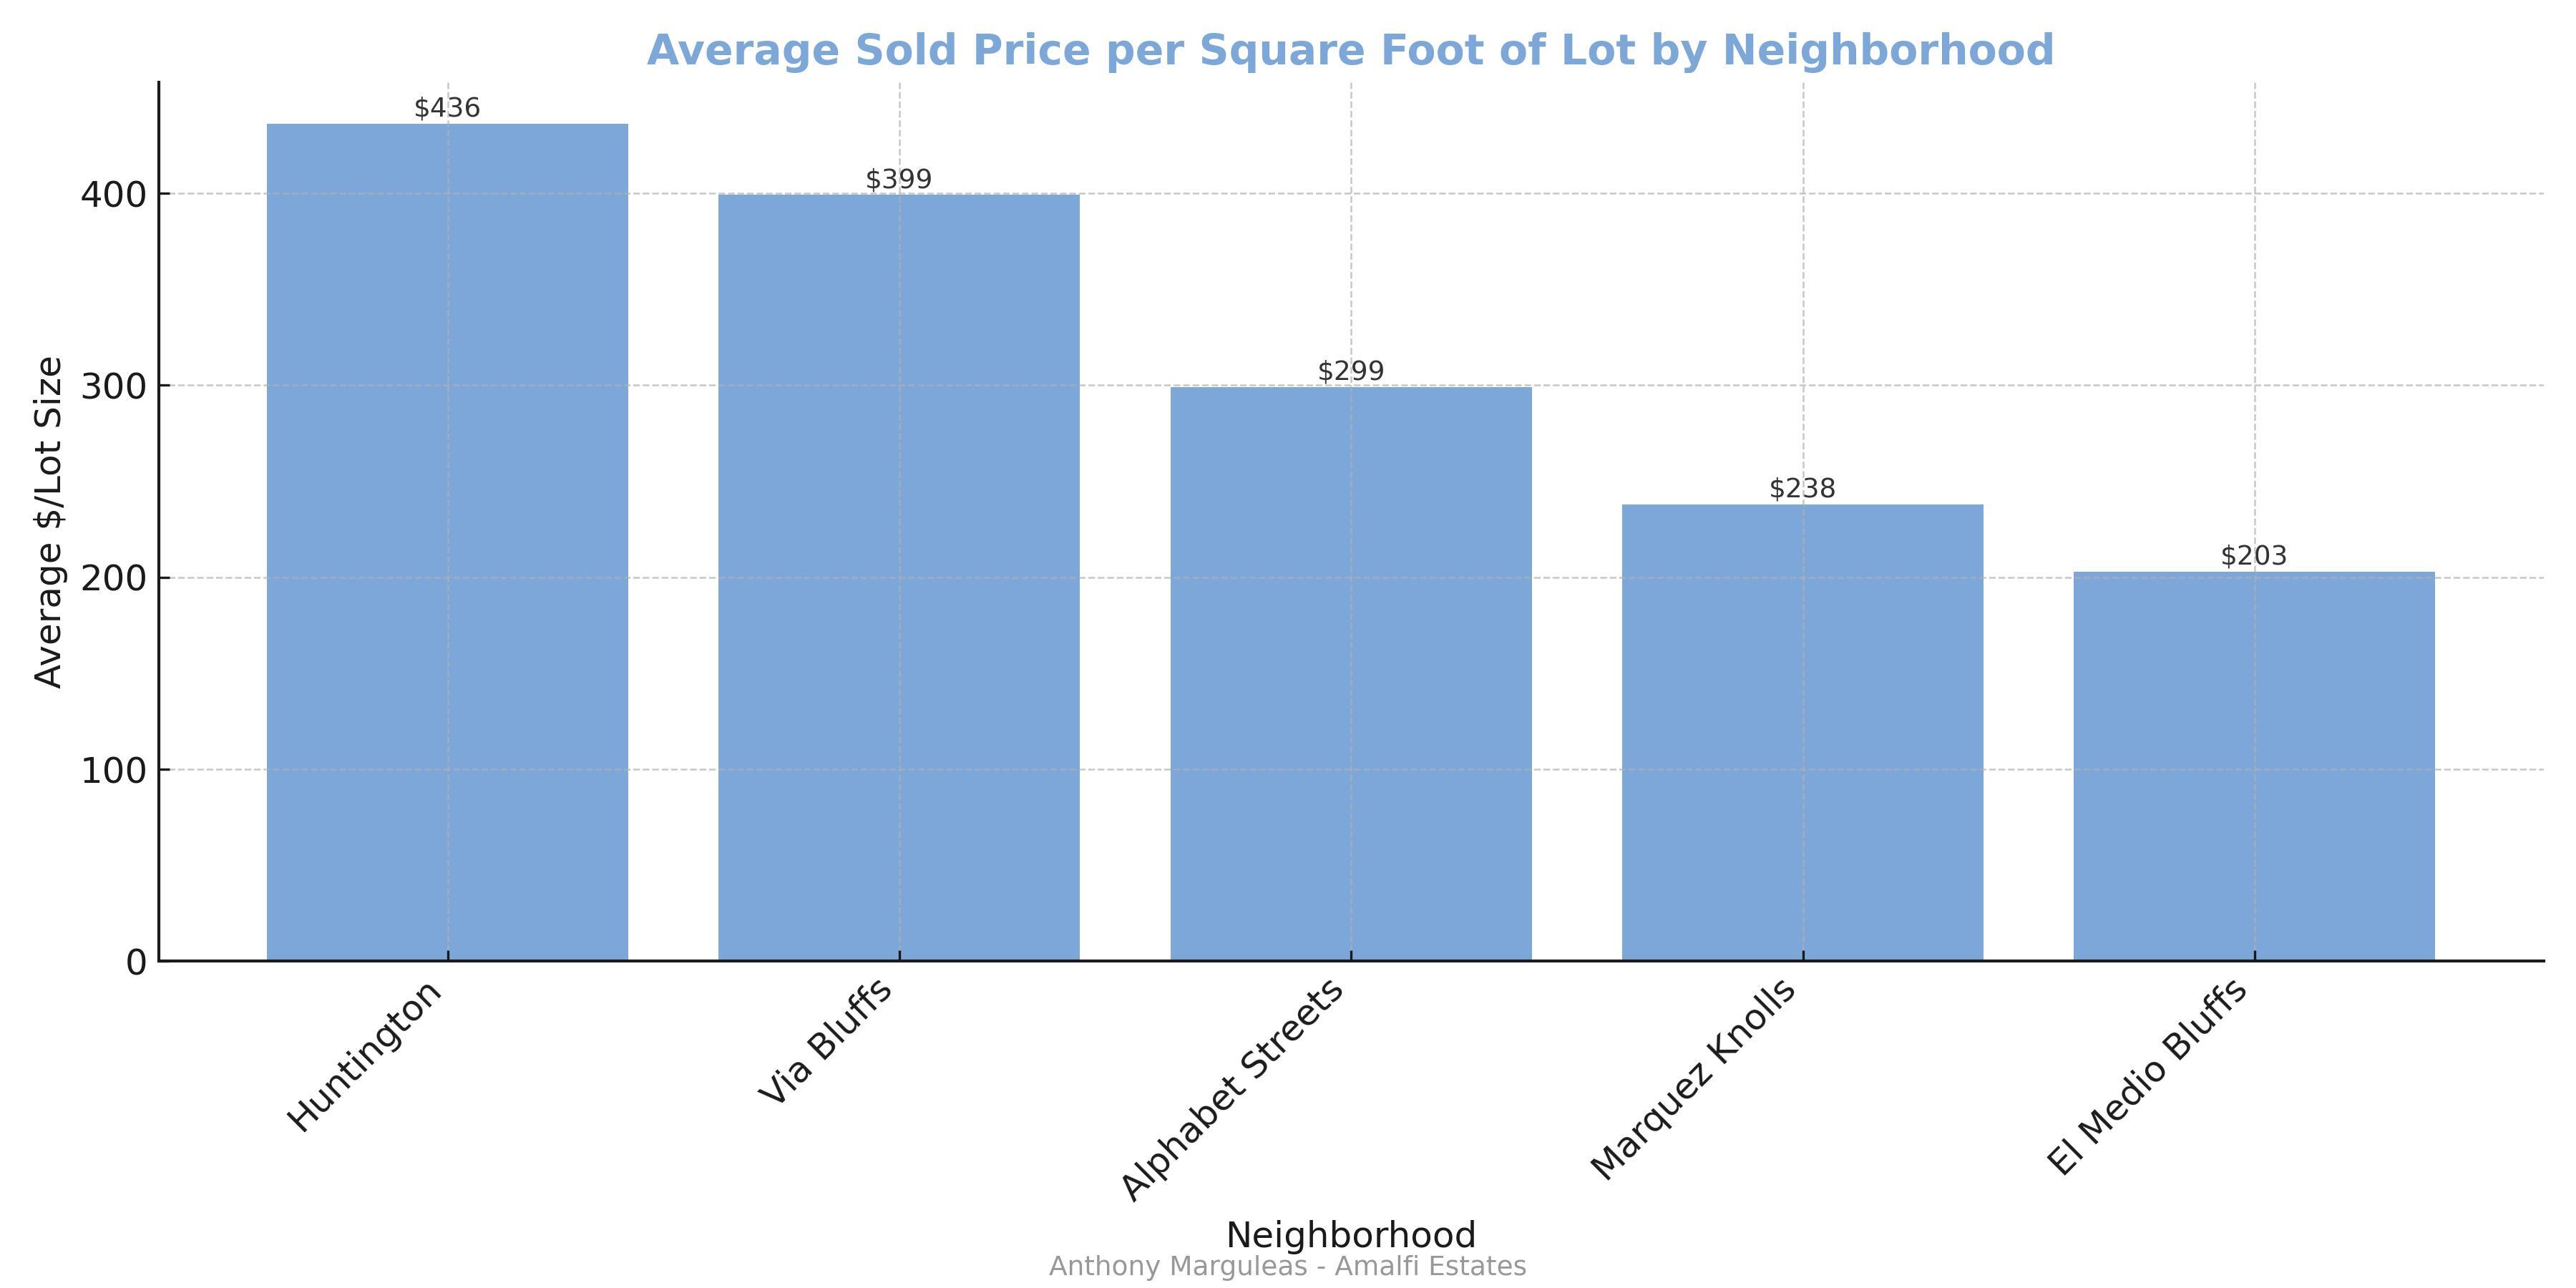
🔹 Average Sold Price per Square Foot by Neighborhood

 
Below is the average Sold Land Price per sq ft by Palisades neighborhood. I did not include all neighborhoods, only those with a higher number of sales. This is why the Highlands and Sunset Mesa, each with only one land sale, were omitted.
 
Note: Using only the cost per foot number below for your area and multiplying it by your lot size won't provide an accurate picture. Many additional variables affect value, such as corner lot, location (not as close to Sunset or a busy street), whether it has a view, the amount of usable land, and the size of the previous structure. This is where an experienced broker can help analyze the value.


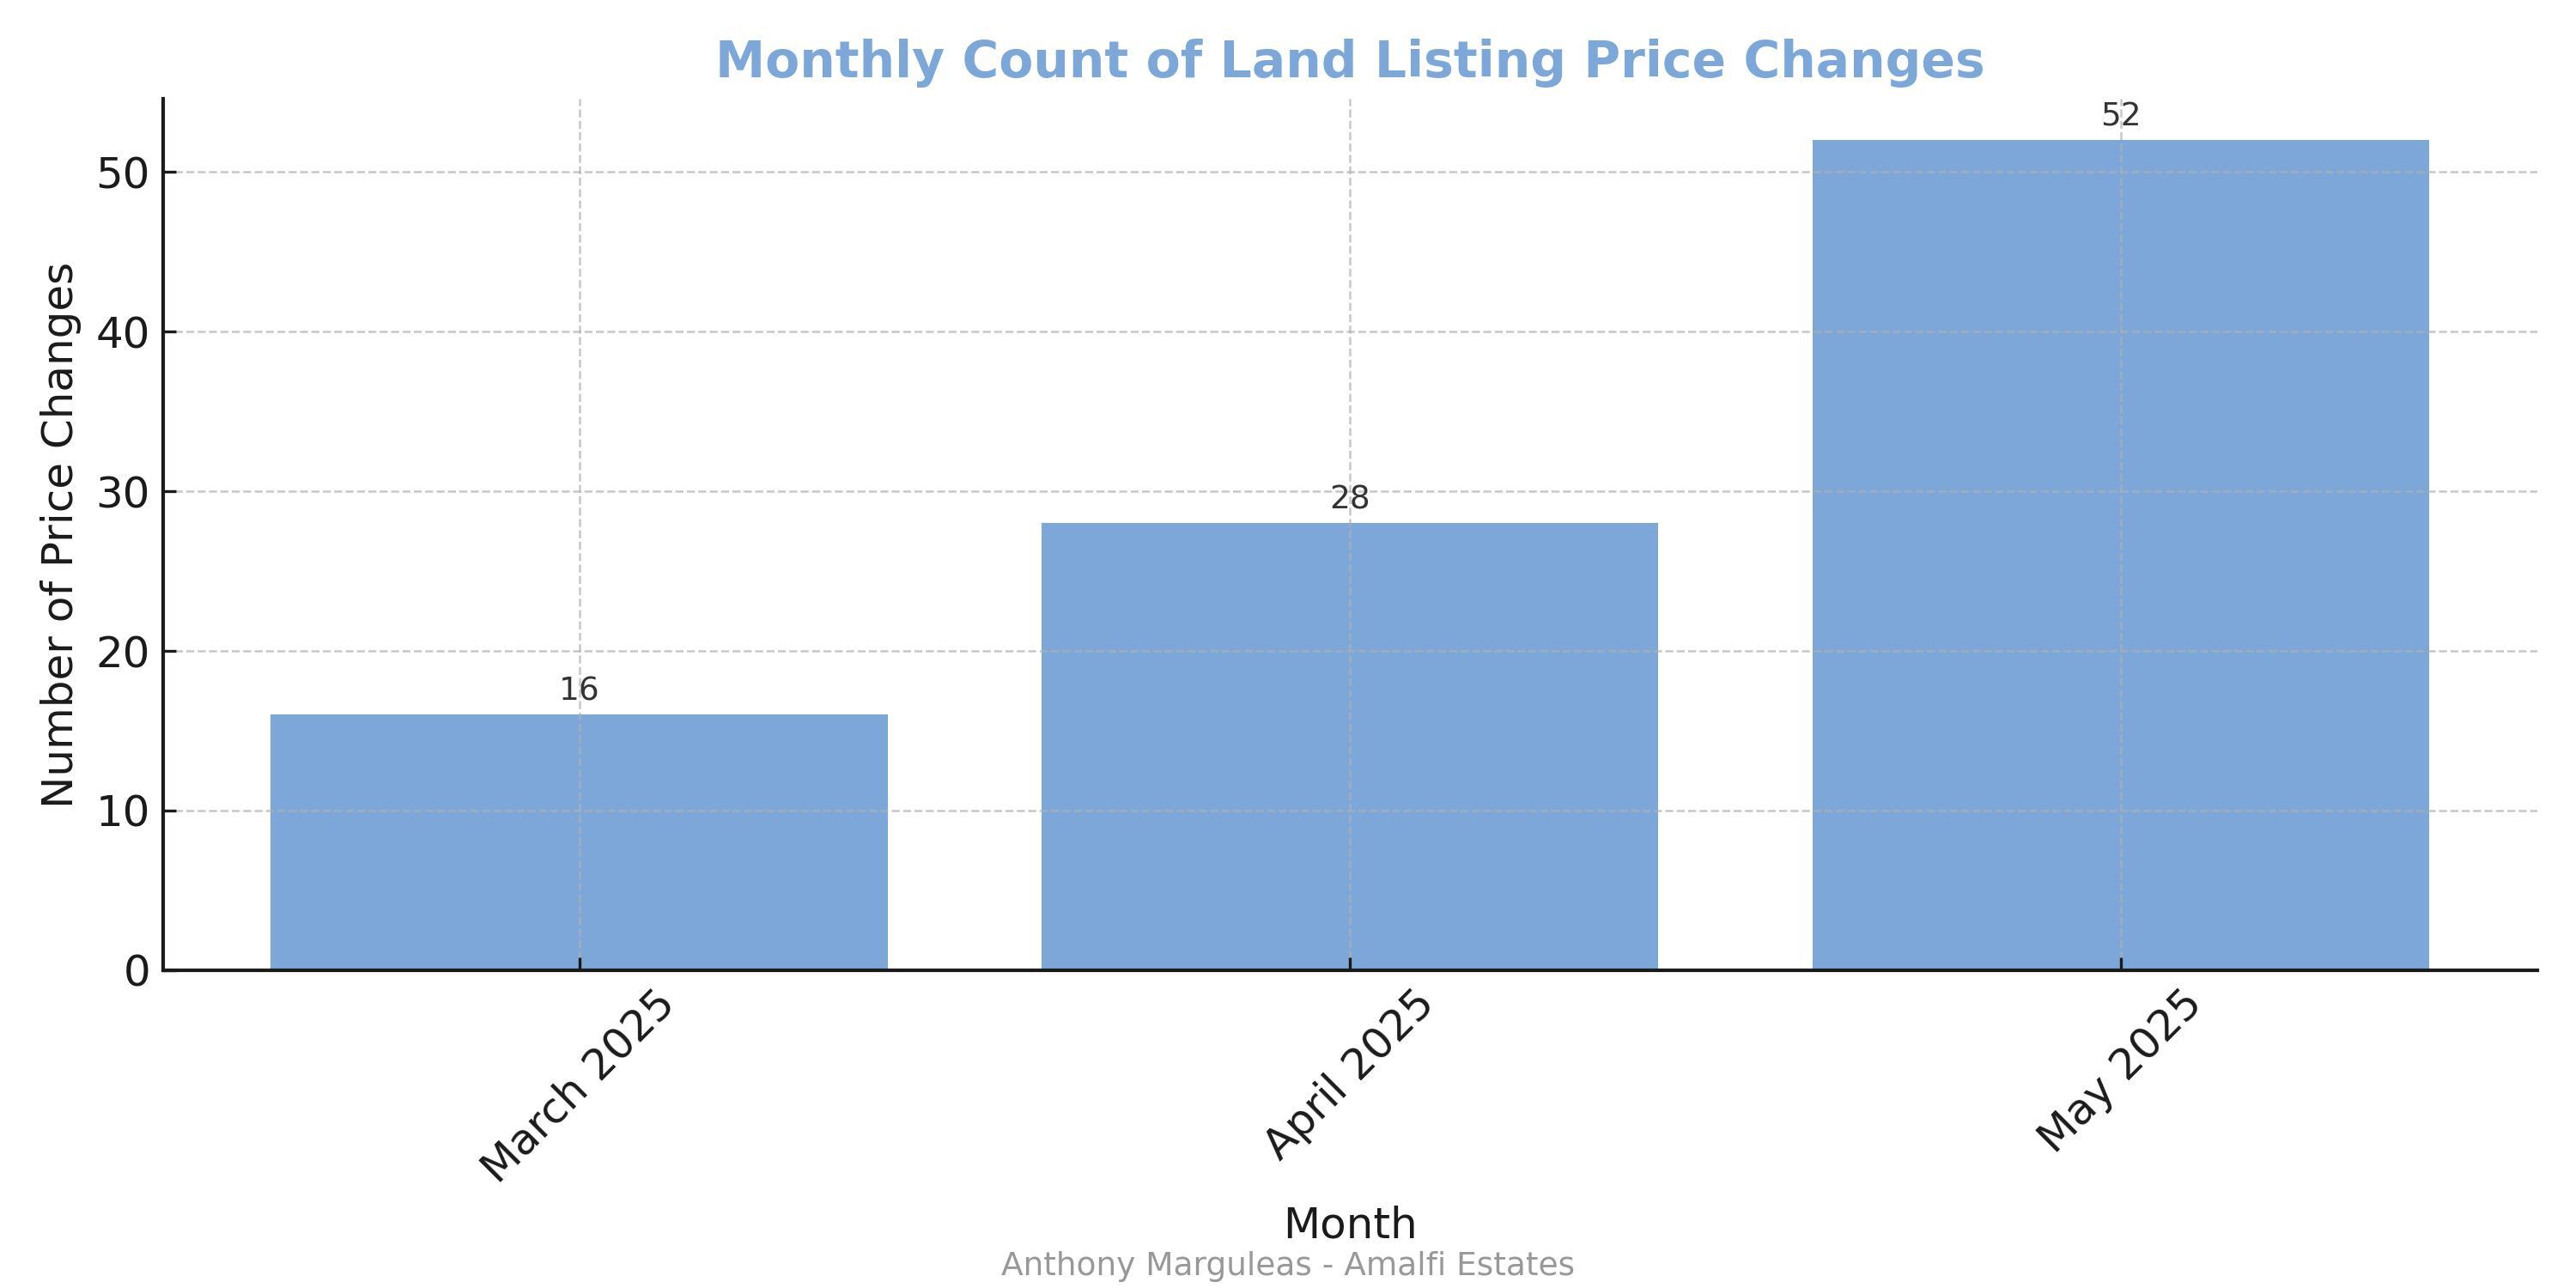
🔹 Land Price Reductions

Below is the increase in Land price reductions, indicating that sellers are pricing their properties too high. This reveals a disconnect between sellers and buyers. Many sellers incorrectly choose their asking price by comparing other active listings and hoping to achieve that aspirational price, but sold prices are the only accurate barometer of value.
 

🔹 Looking Ahead

  • Expect more permit approvals. It has been doubling each month, so we hope that trend continues.
  • See more private and public partnerships, such as the recent announcement of an artificial intelligence-driven software system created by Archistar designed to accelerate building permit approvals. It can analyze building plans in days as compared to weeks or months.
  • Buyer confidence will gradually return.
 
If you need guidance evaluating your lot or home value, we are here to help.
 

Let's Talk

You’ve got questions and we can’t wait to answer them.