Market Update Los Angeles

Note: You can find the charts & graphs for the Big Story at the end of the following section.
*National Association of REALTORS® data is released two months behind, so we estimate the most recent month’s data when possible and appropriate.
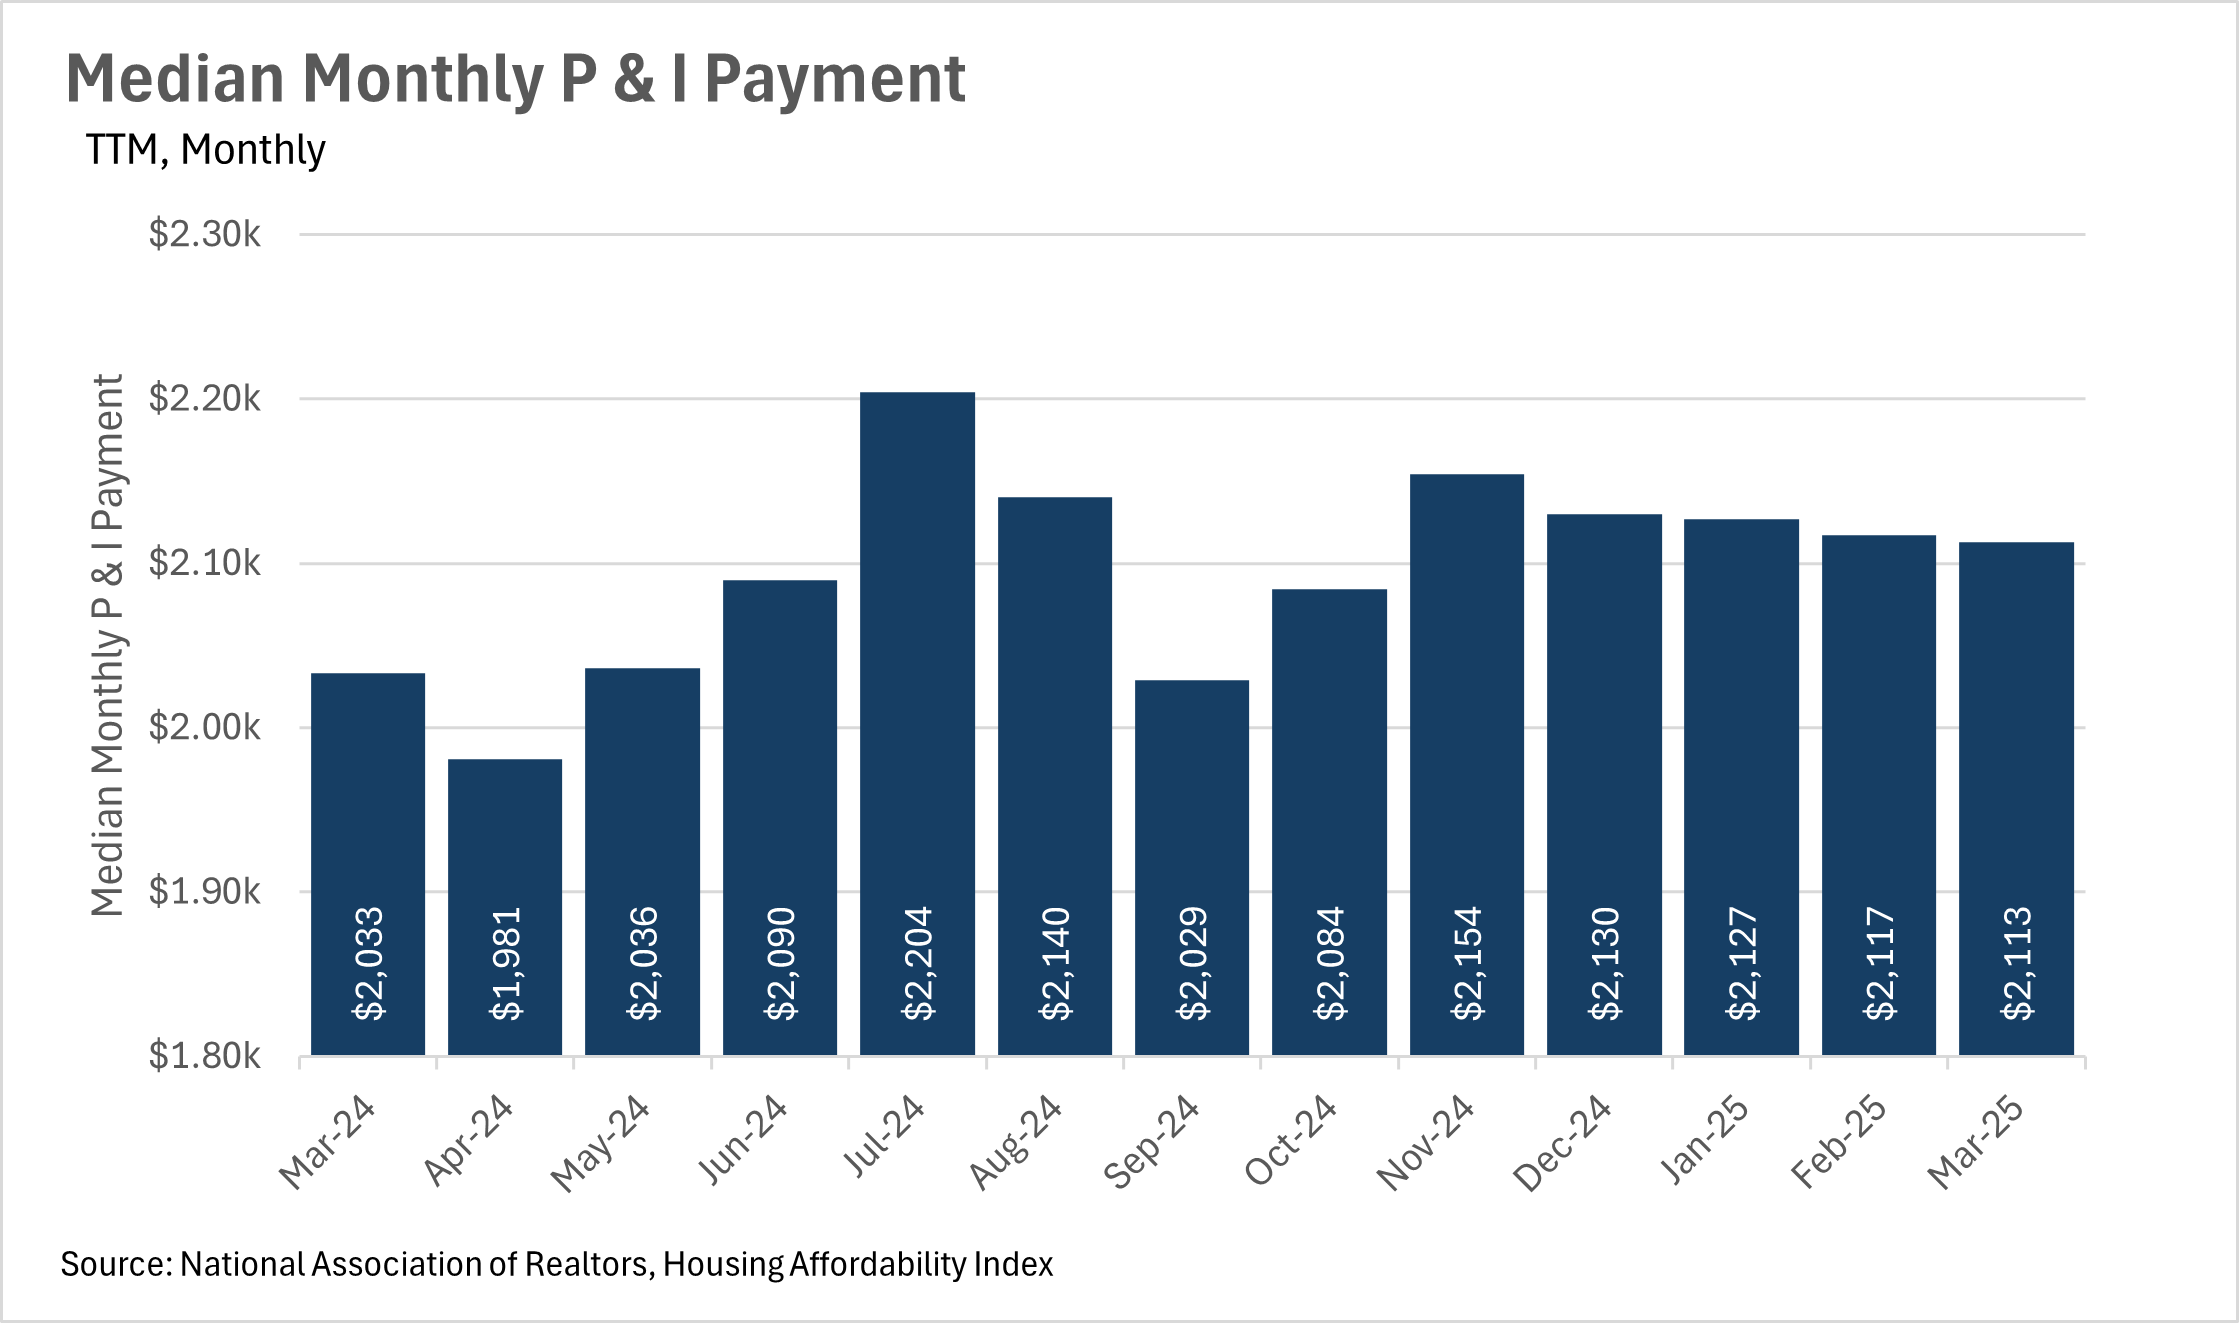
For quite some time, we’ve seen monthly inflation readouts with figures in the 2-3% range. Despite the fact that inflation seems to be under wraps for now, the median monthly P&I payment has grown faster than inflation, with the most reading coming in at $2,113, representing a 3.94% increase on a year-over-year basis. This shows that there are still inflationary pressures at work in the housing market.
Factors contributing to this inflation will vary by market. Some markets have more of an issue on the supply side (i.e. higher construction/materials costs), while others have an issue with the demand side (i.e. more demand for homes than supply). It will be especially important to pay attention to this metric over the coming months to get a gauge of how inflation is impacting the housing market.
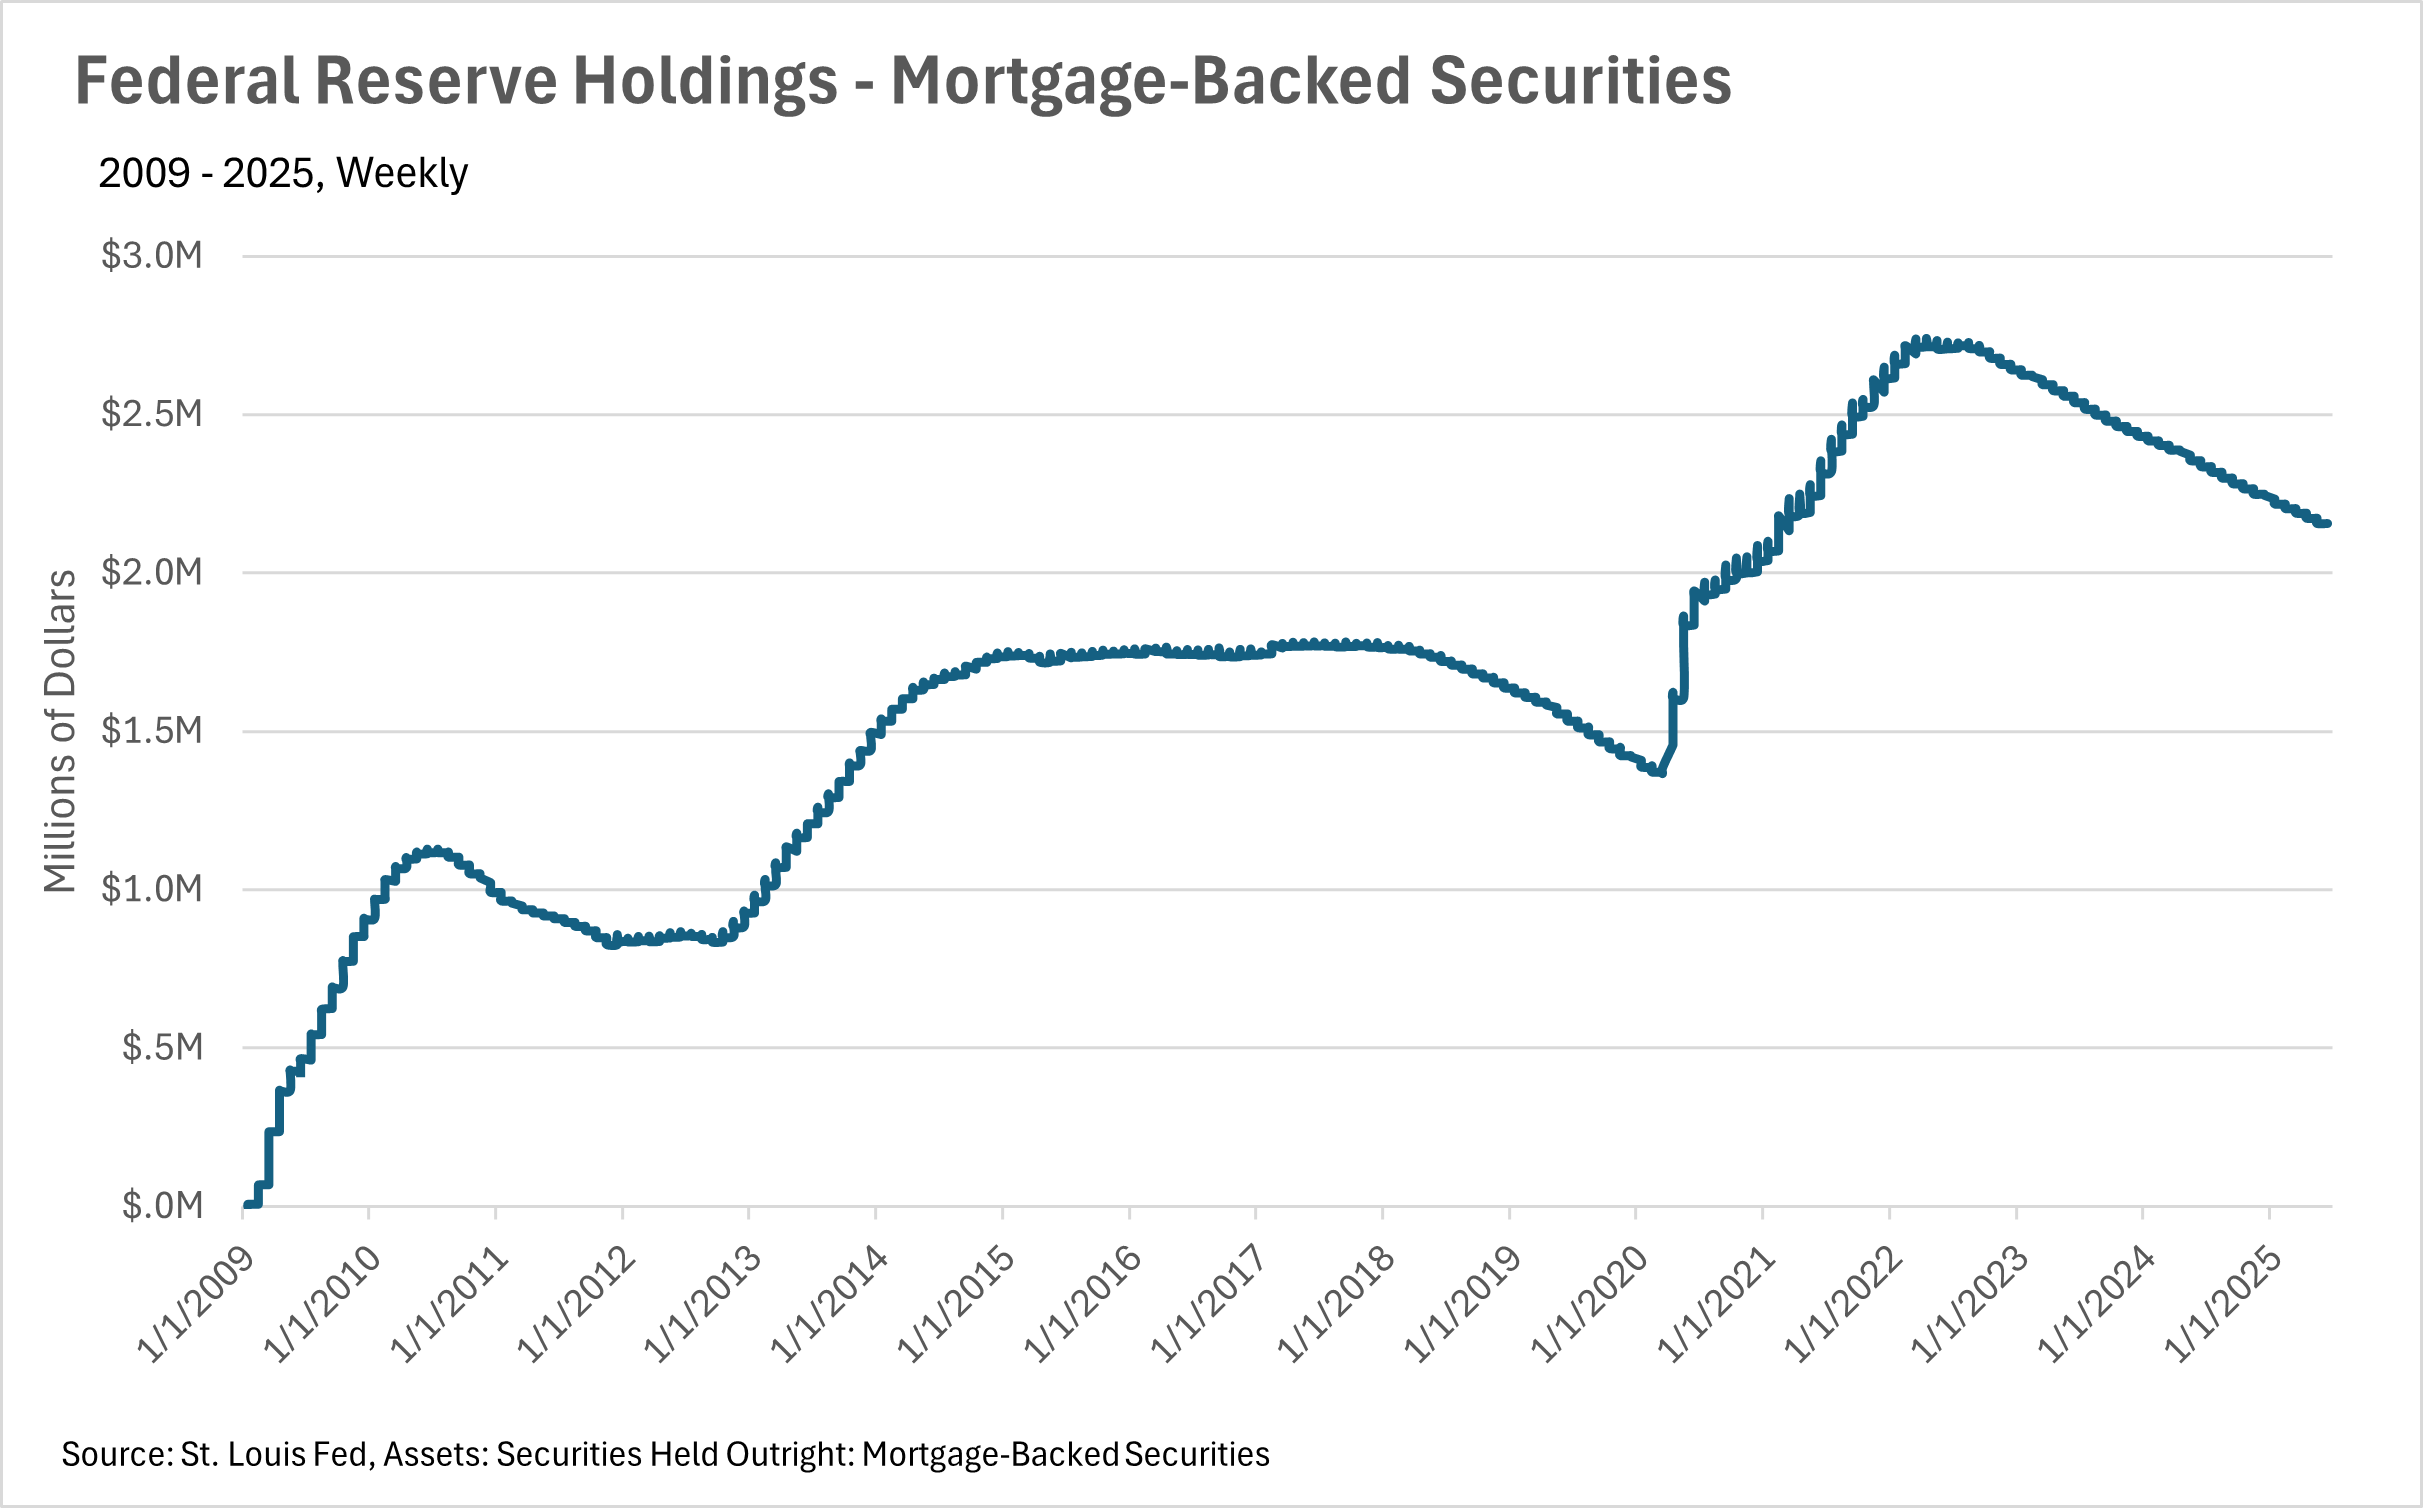
Mortgage rates have remained high, in the mid to high-6% range for quite some time. Some believe that the recent trade war was being implemented in part to bring down interest rates. However, judging by recent commentary from the Fed, the trade war and the associated uncertainty, has only made Fed officials more cautious in utilizing the incredibly powerful economic tool that is the federal funds rate.
This means that we are probably going to see elevated mortgage rates for the foreseeable future, unless the economy takes a considerable turn for the worse. It is worth noting though, that according to the Fed’s “Dot Plot”, the majority of Federal Reserve officials predict the federal funds rate will be in the 3.75-4.00% range by the end of the year, and the 3.25-3.50% range in 2026.
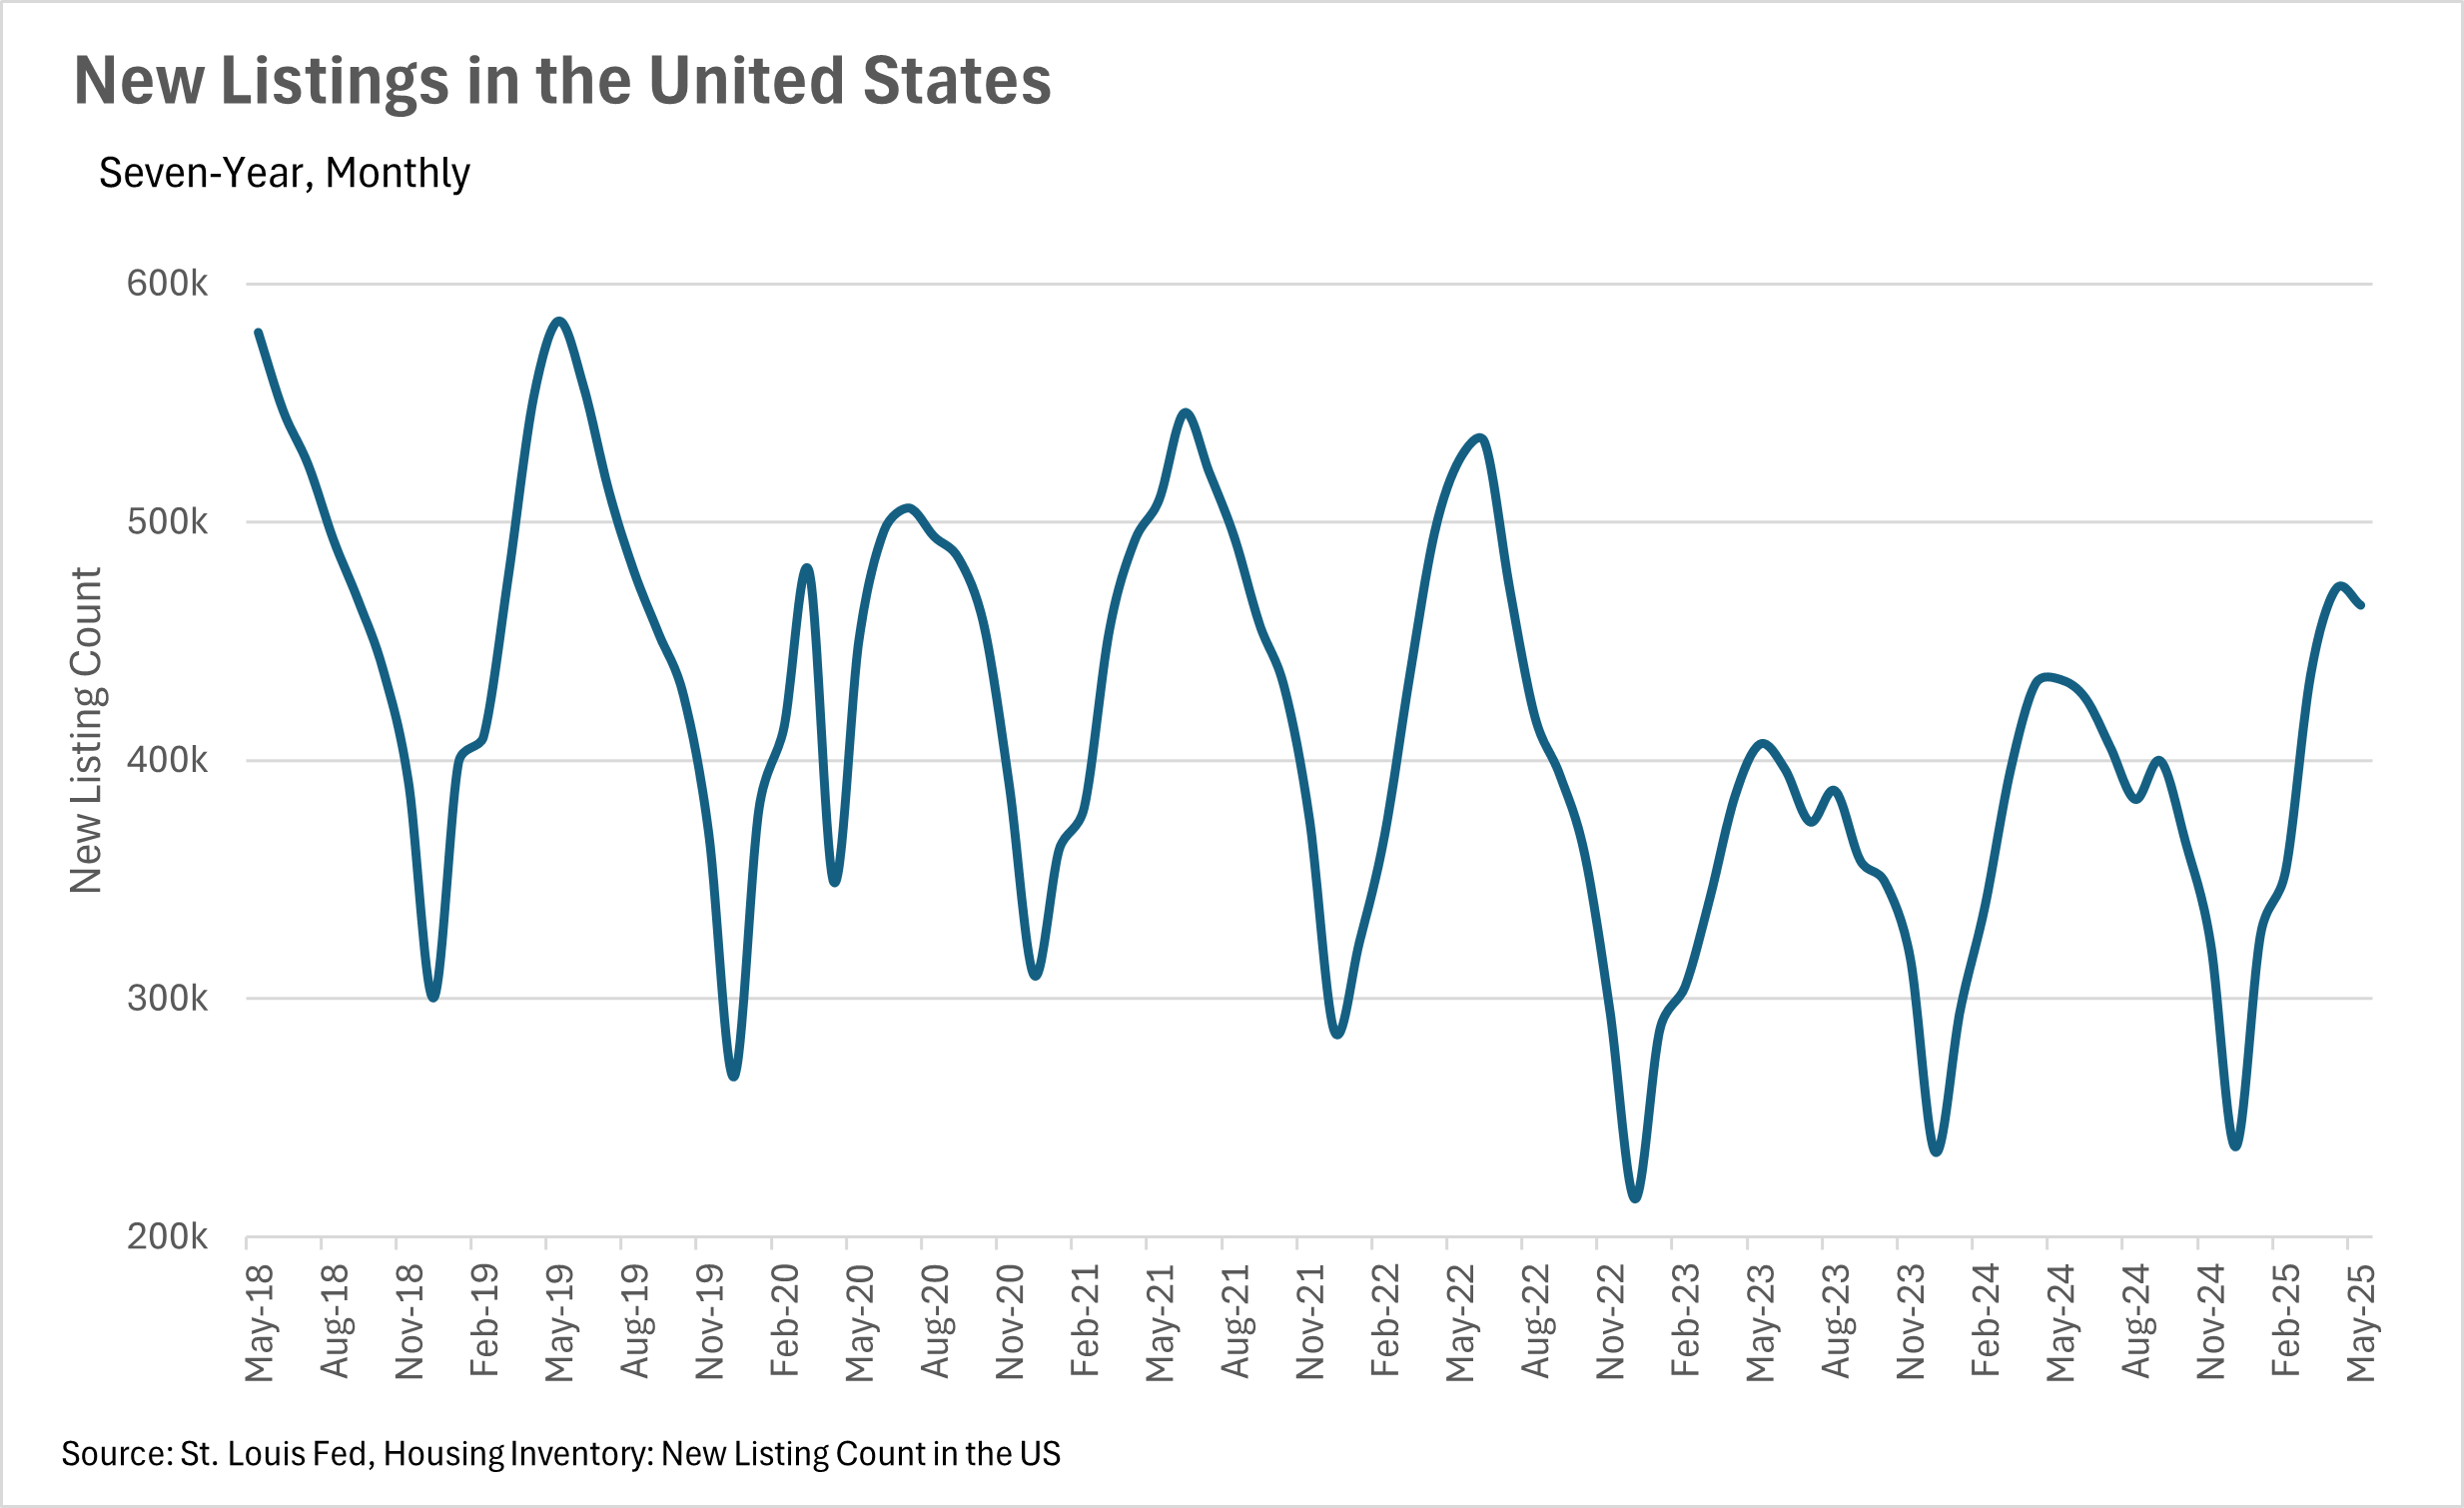
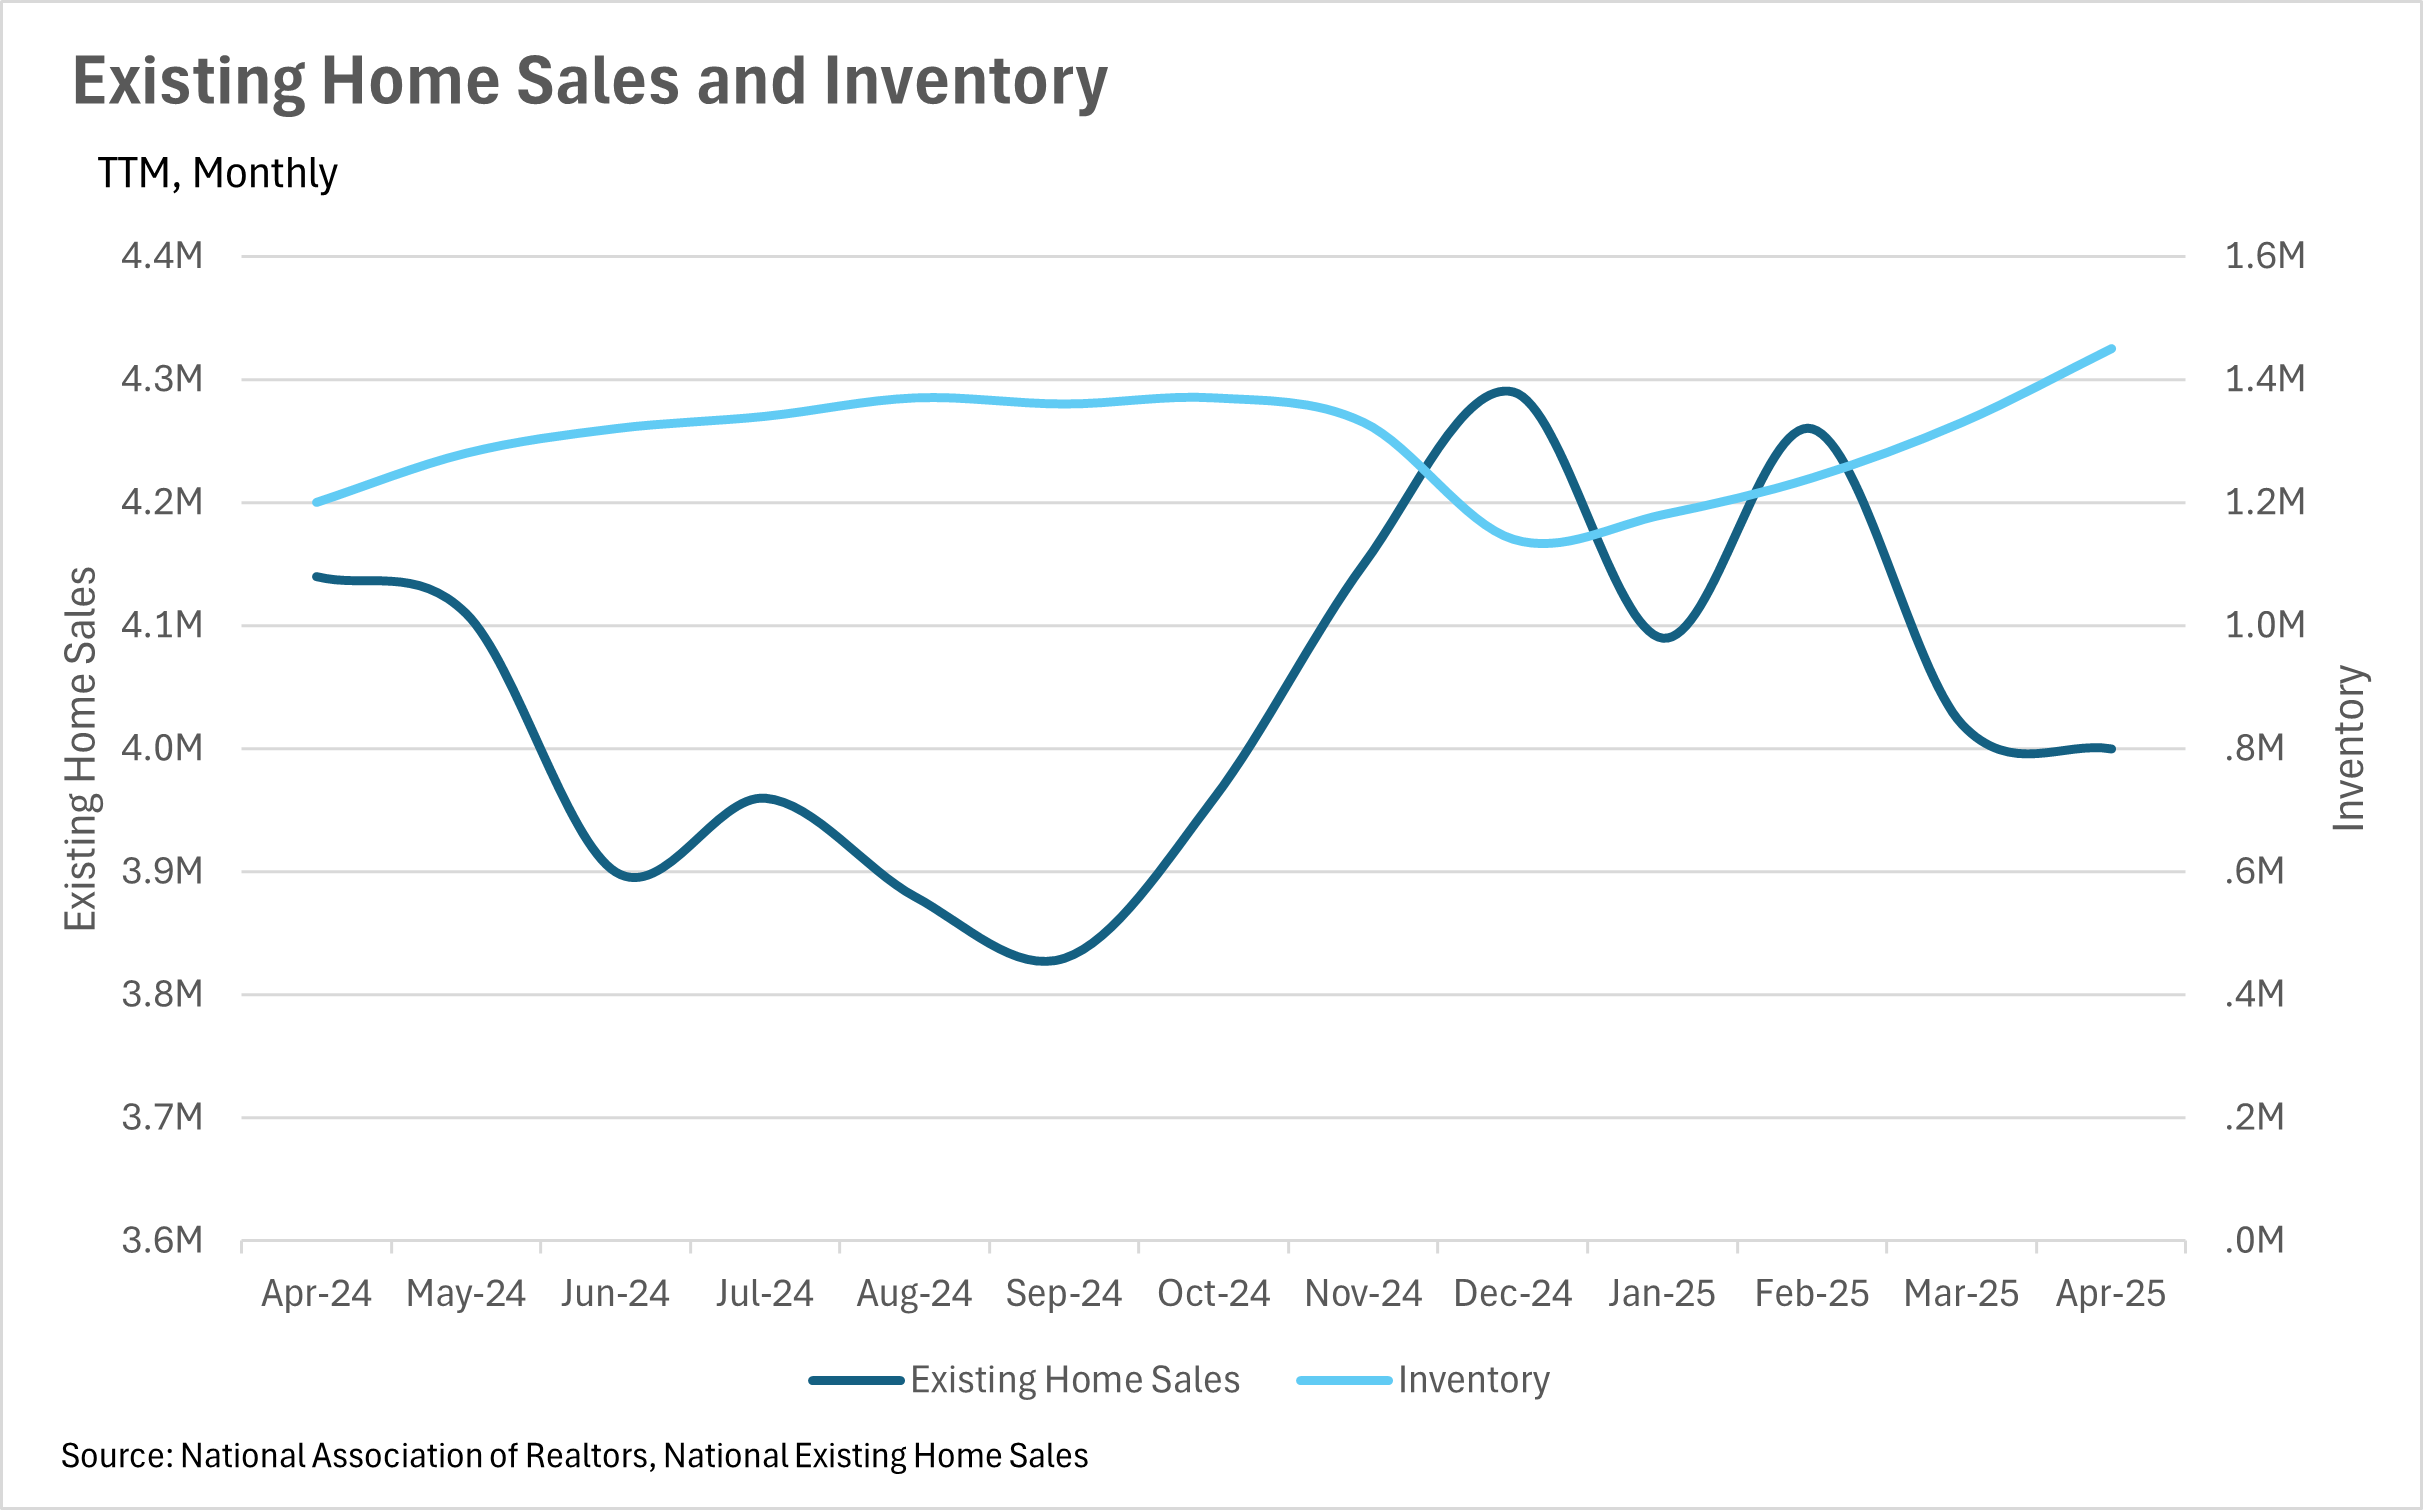
The moves in sales and inventory that we’ve been seeing throughout California over the past few months have been echoed on a national scale. The nation as a whole has seen inventories build, as homes sit on the market for longer. Our most recent data point (April 2025), shows that inventory increased by 20.83% on a year-over-year basis, to 1,450,000. Meanwhile, existing home sales decreased by 3.38%, to 4,000,000.
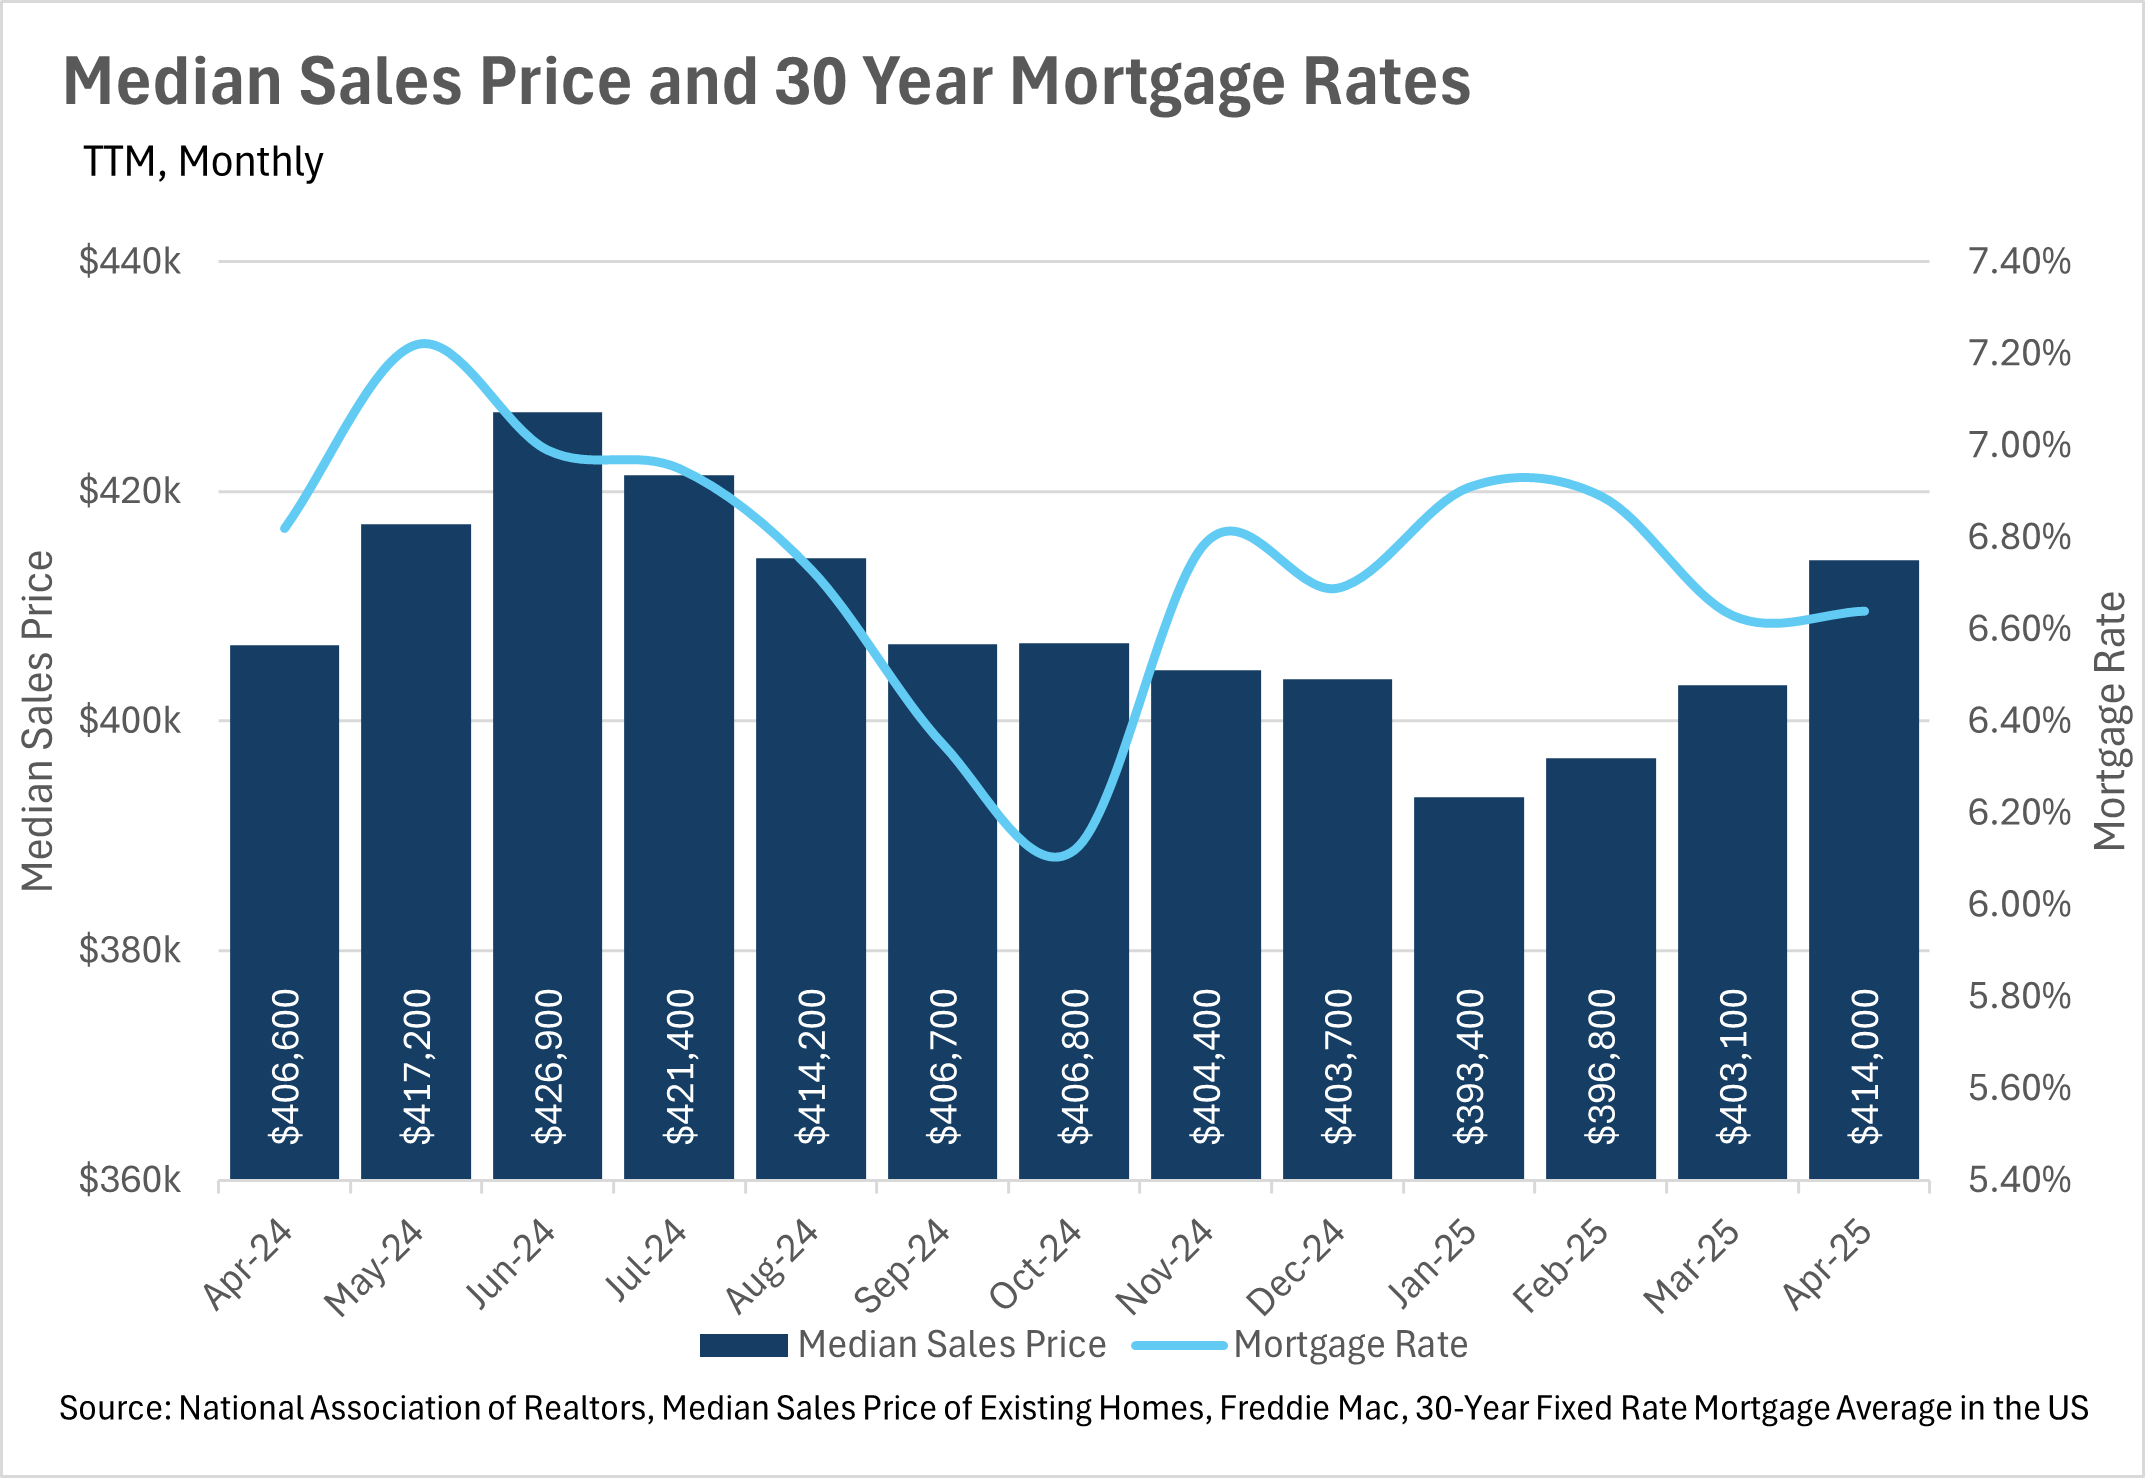
Despite the growing backlog of inventory, median sale prices are still trending upward, with the median listing selling for $414,000, representing a 1.82% year-over-year increase. To add fuel to the fire, we’ve seen growing numbers of listings hitting the market, with the number of new listings hitting the market increasing by 7.19% on a year-over-year basis.
Ultimately though, this is just what we’re seeing at a national level. As we all know, real estate is an incredibly localized industry, so knowing what’s going on in your own market is pivotal. Below is our local lowdown, that outlines everything you need to know about what’s happening around you in your neighborhood and surrounding areas!
Note: You can find the charts/graphs for the Local Lowdown at the end of this section.
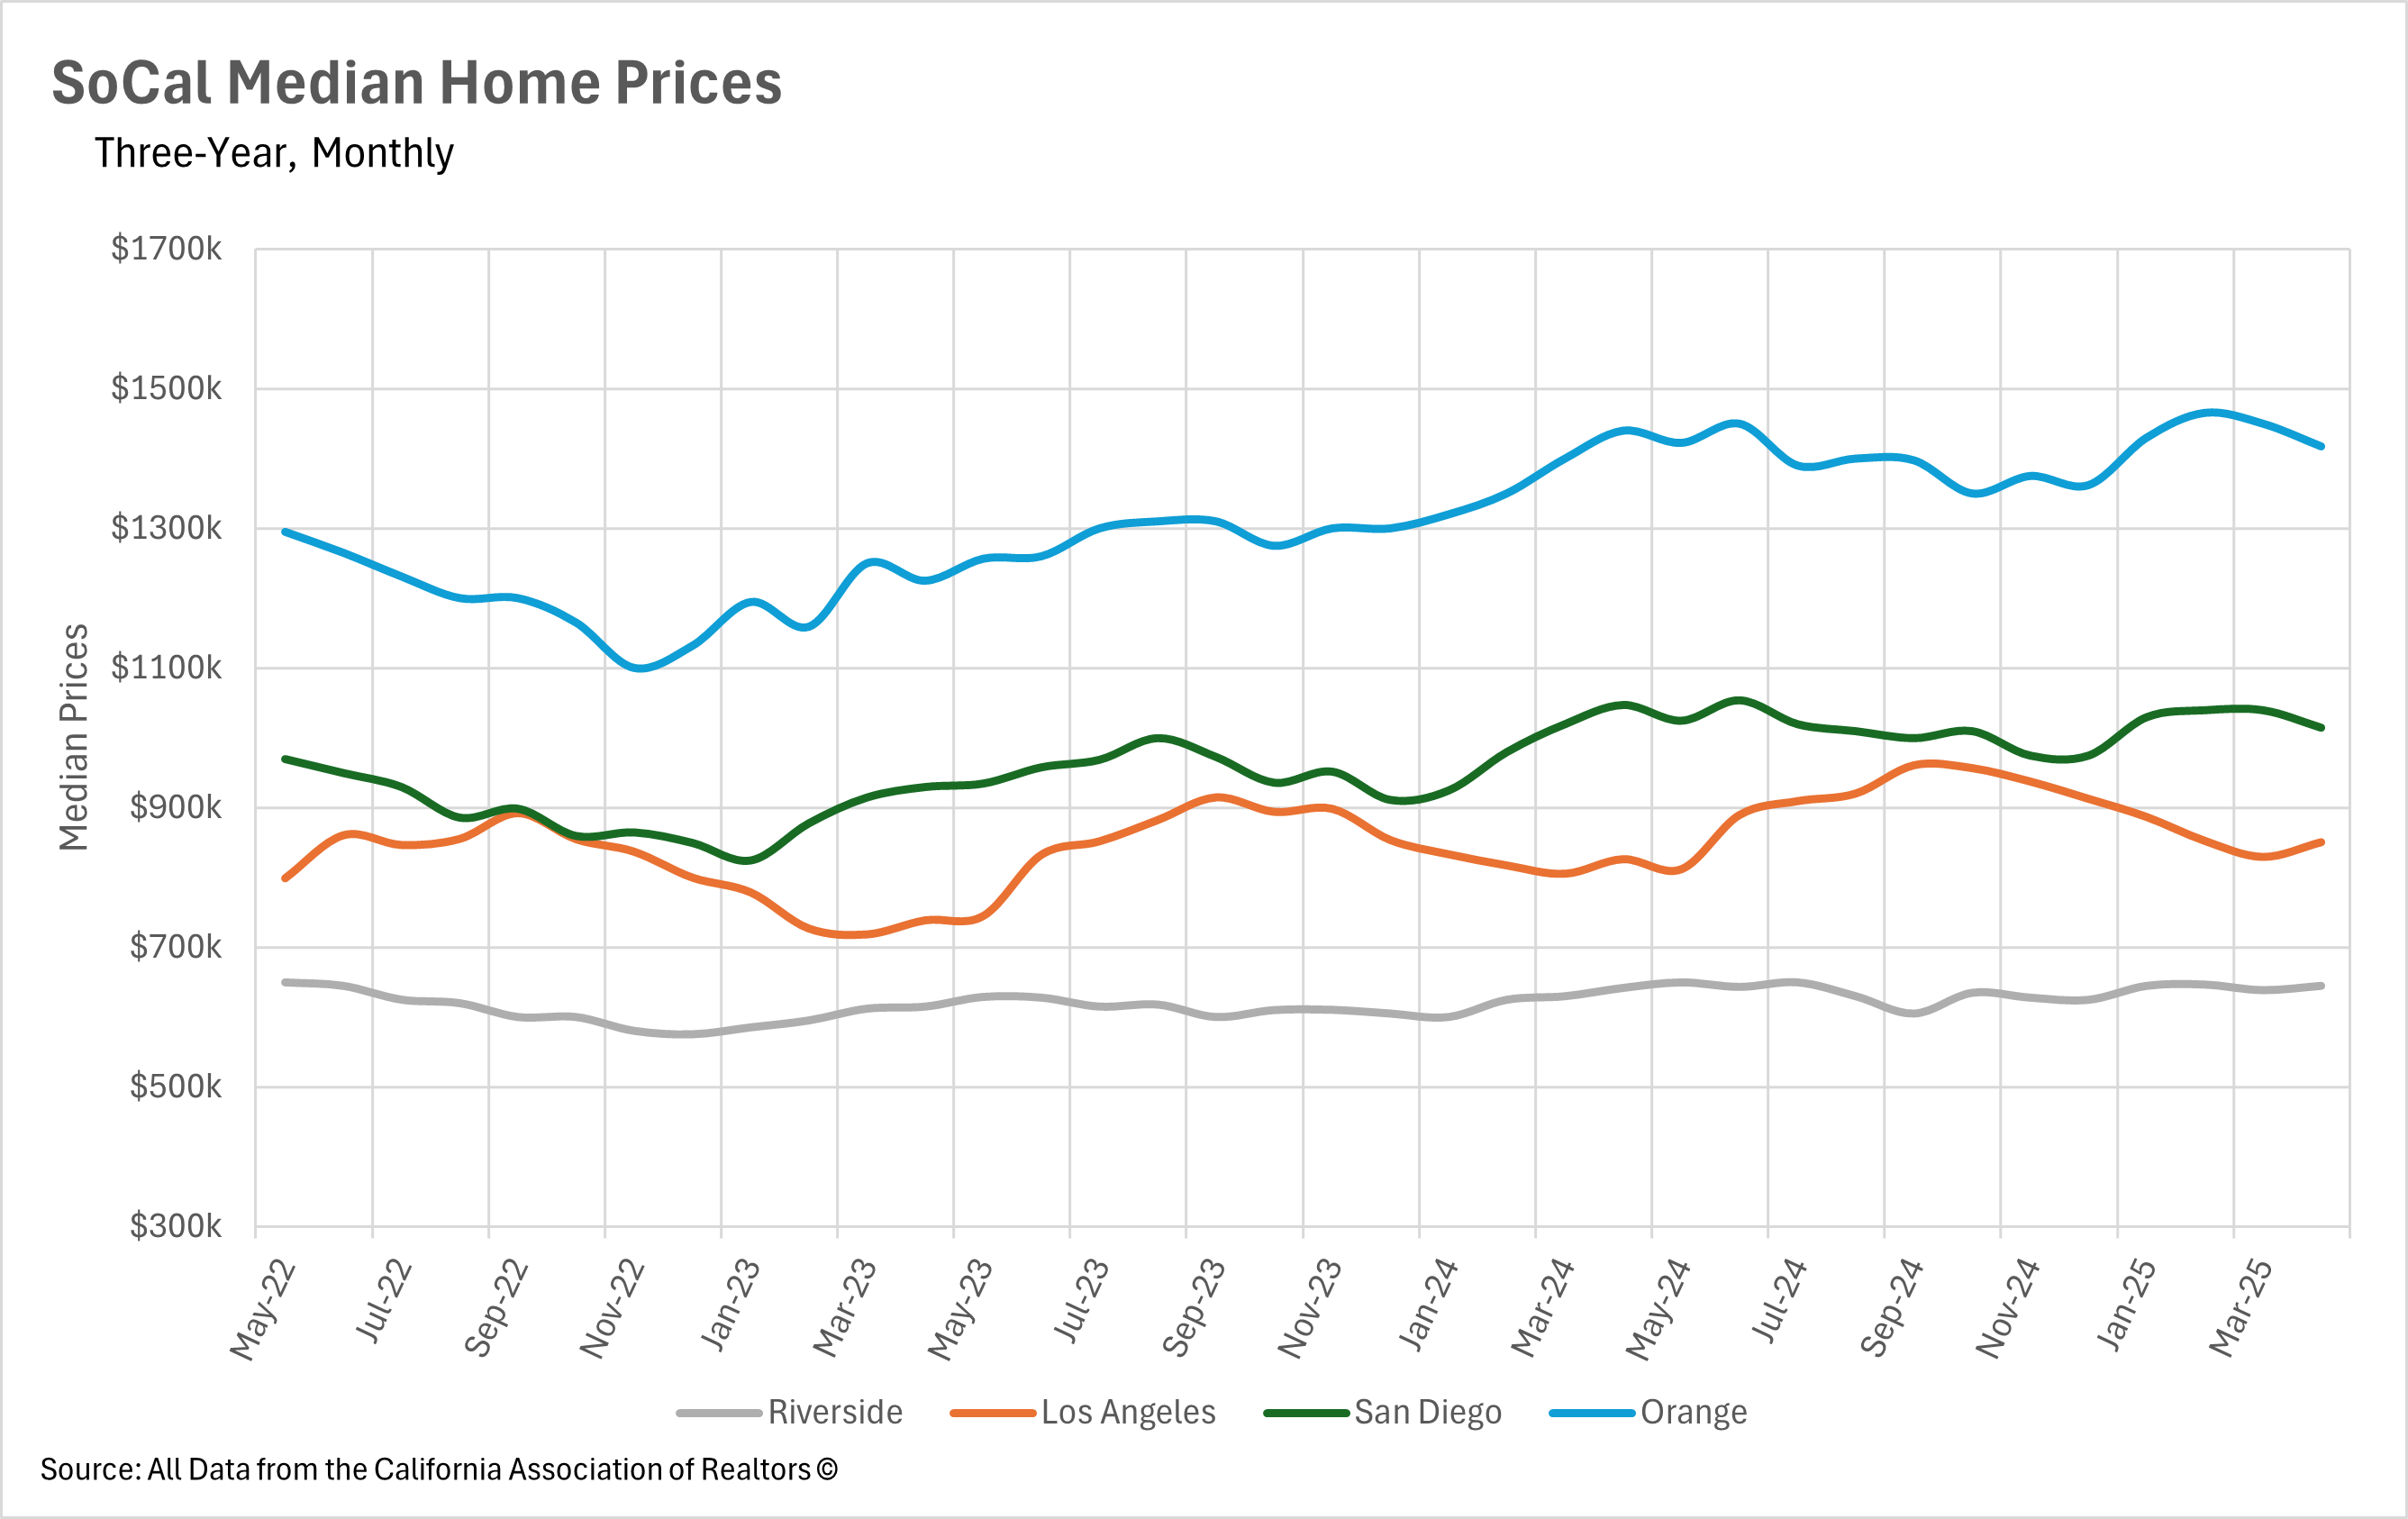
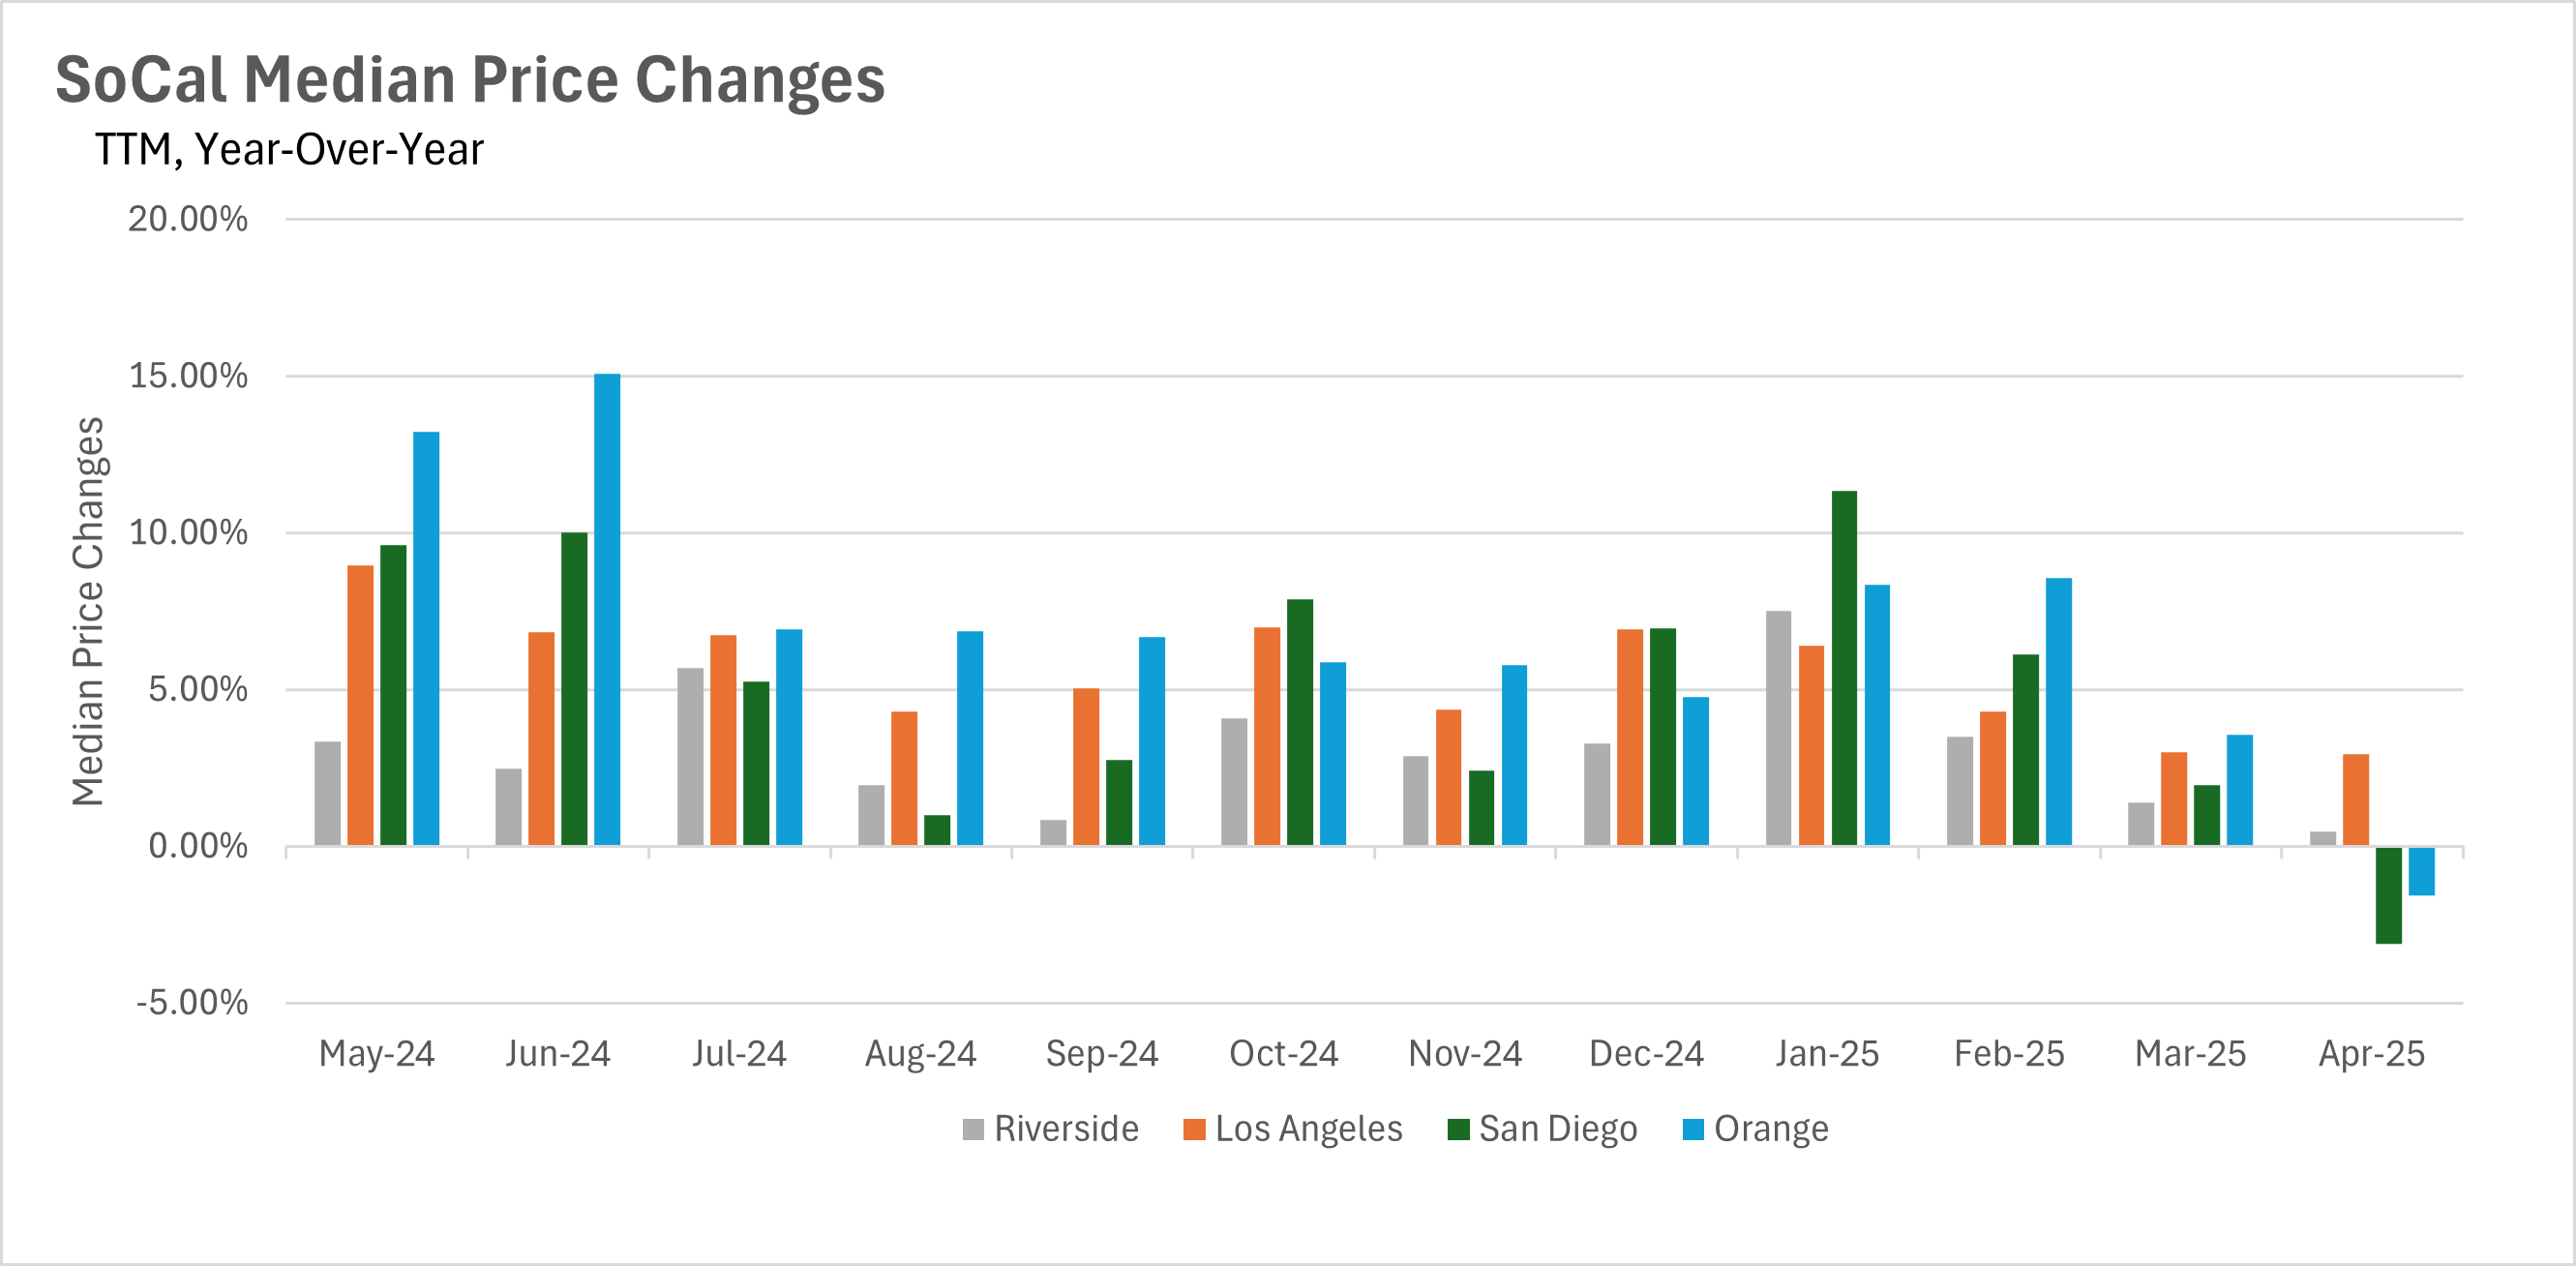
The Southern California real estate market has reached a clear inflection point, with price appreciation slowing dramatically across all major counties by April-May 2025. Most notably, Orange County experienced its first year-over-year decline in several years, with median prices dropping 1.57% to $1,417,450 in April. This represents a significant shift from the robust 8.56% growth seen just two months earlier. Los Angeles County continues to show positive but decelerating growth at 2.94% year-over-year to $850,270, down from 6.41% in January. San Diego County has seen prices stabilize around the $1 million mark after a recent pullback, with April showing a 3.10% year-over-year decline to $1,015,000. Riverside County has experienced the most consistent moderation, with growth slowing to just 0.47% in April to $645,000. This widespread deceleration reflects the market's response to dramatically increased inventory levels and the fundamental shift in negotiating power toward buyers.
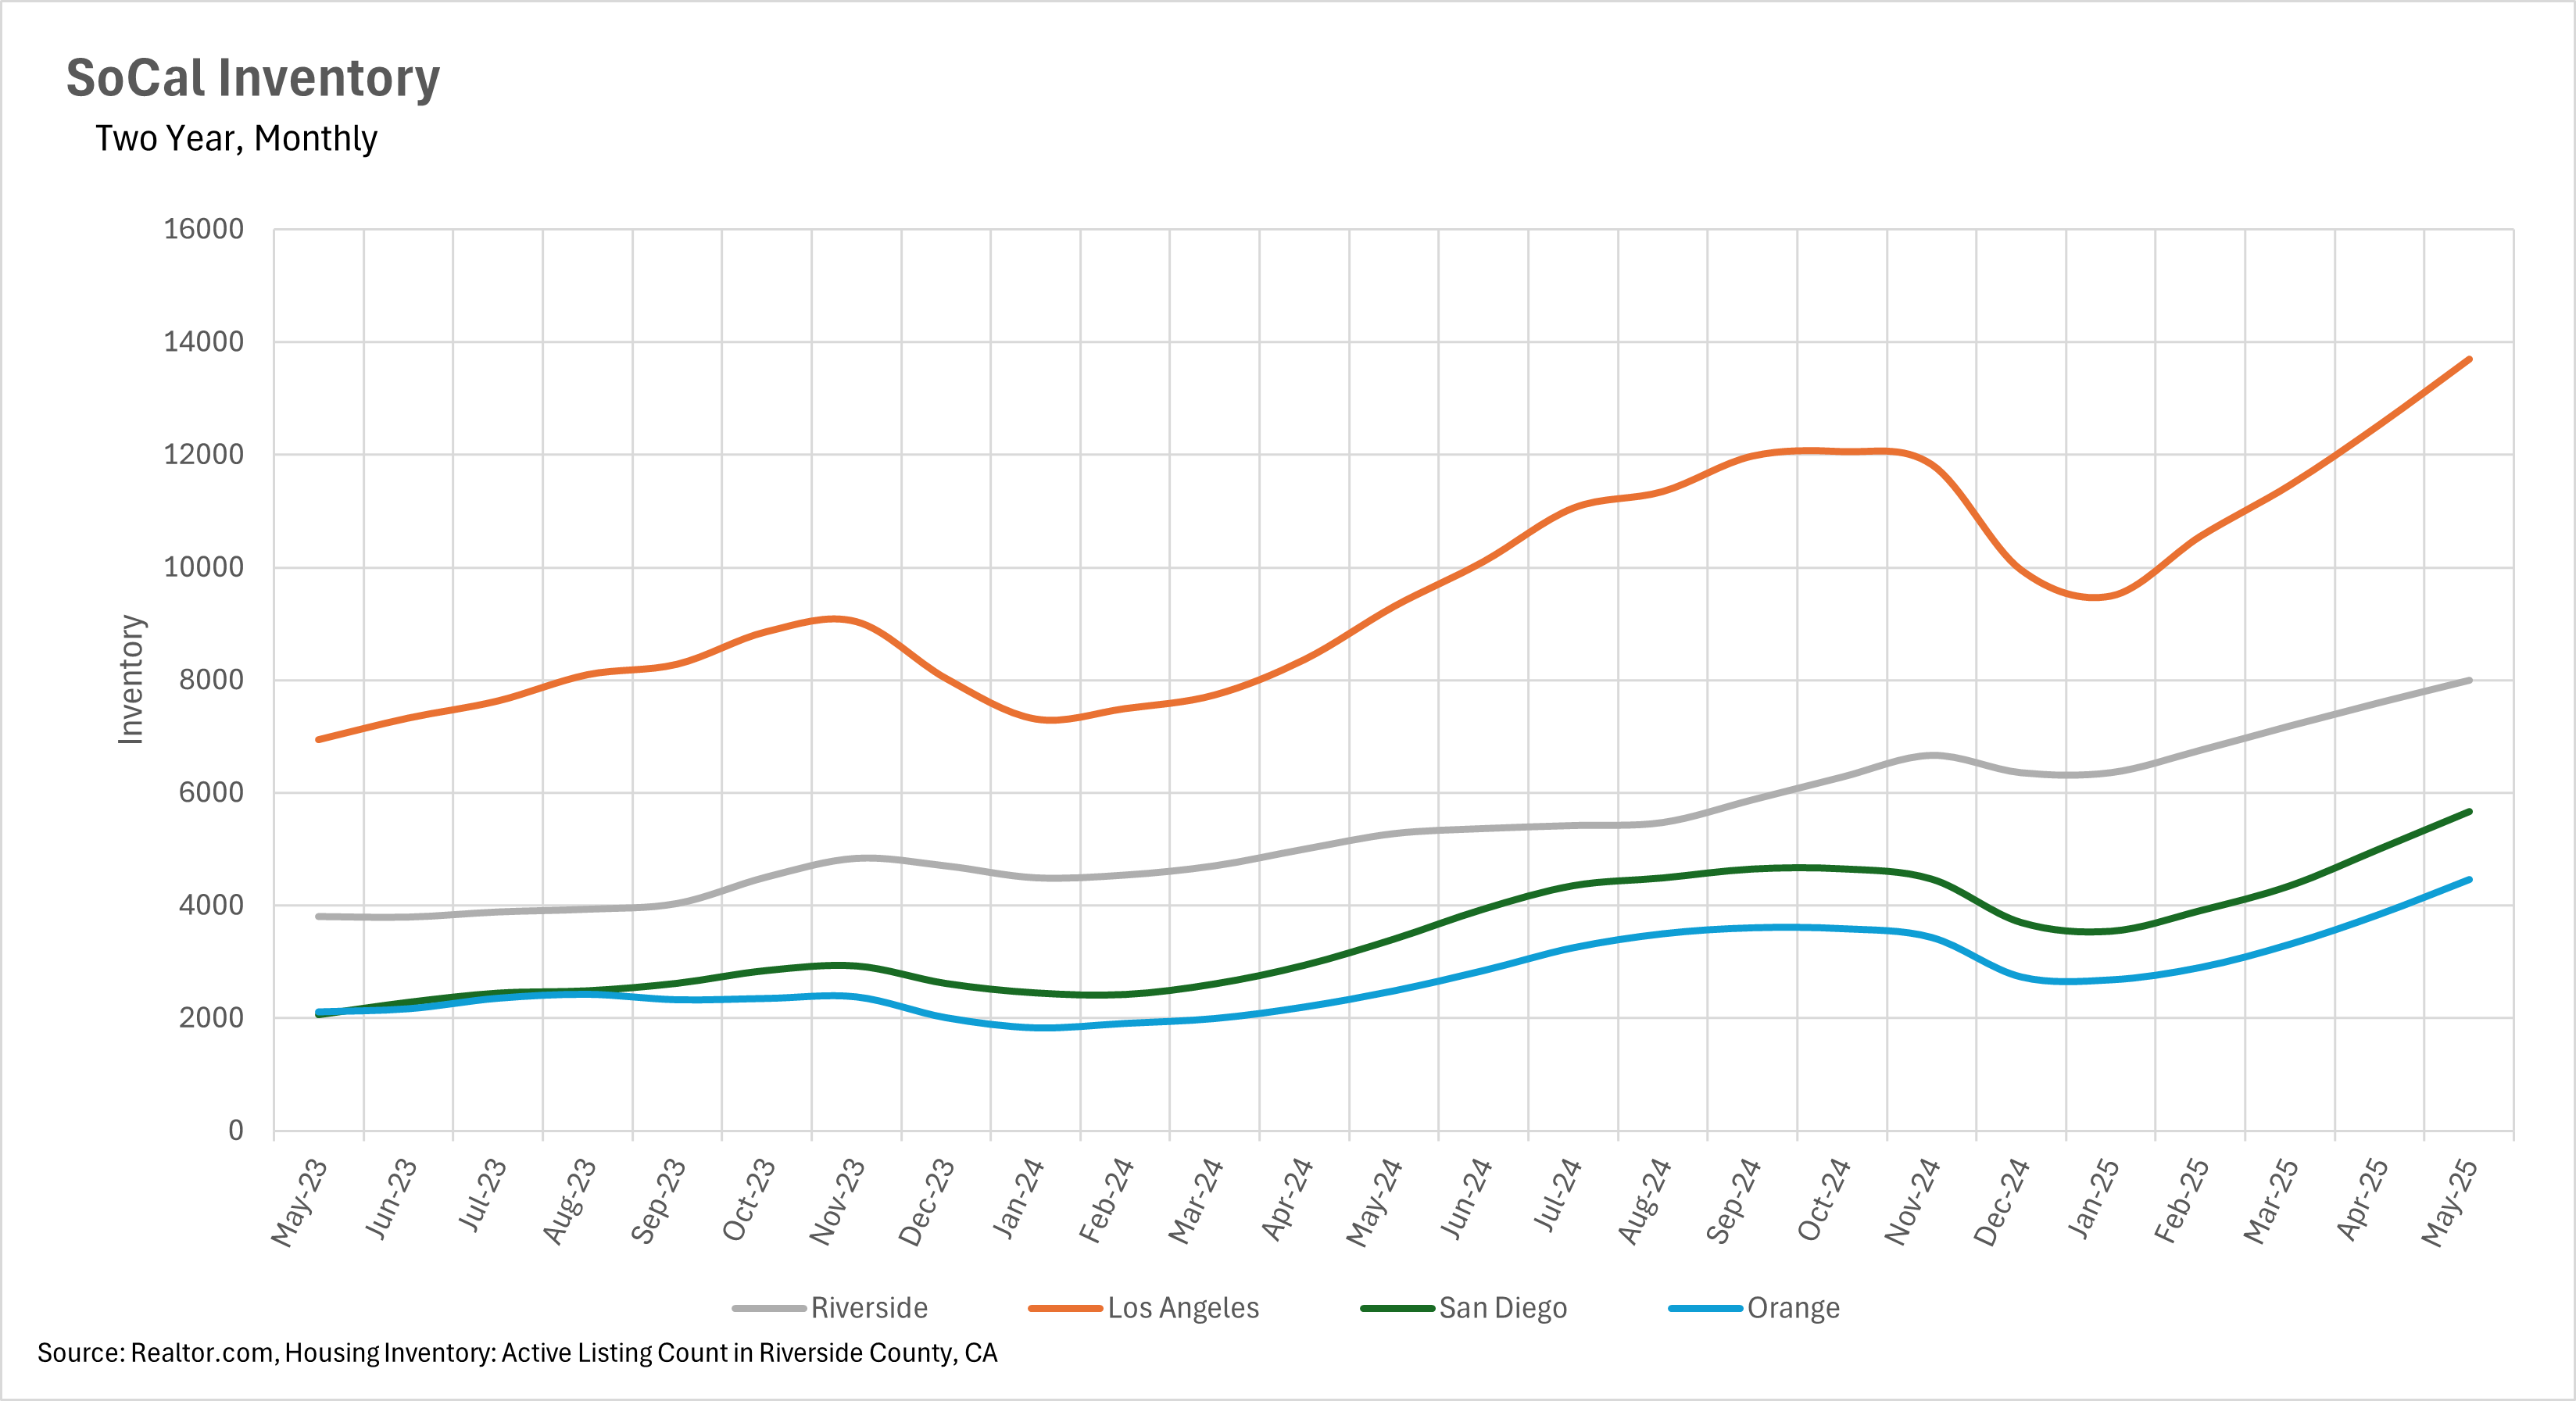
Southern California is experiencing an unprecedented surge in available housing inventory that is fundamentally reshaping market dynamics. Orange County leads this trend with a massive 79.28% year-over-year increase in May 2025, reaching 4,457 single-family homes on the market. Riverside County follows closely with a 52.80% annual increase to 7,992 homes in May, while Los Angeles County saw a 47.13% jump to 13,695 active listings. San Diego County, though not reporting exact percentages for the latest period, showed a 66.34% year-over-year increase with inventory reaching 5,664 homes in May.
This flood of new listings represents the highest inventory levels these markets have seen in several years, giving buyers an unprecedented level of choice and significantly more negotiating leverage. The consistent month-over-month increases across all counties suggest this trend will continue through the traditionally busy summer selling season, further supporting the shift toward a buyer-favorable market environment.
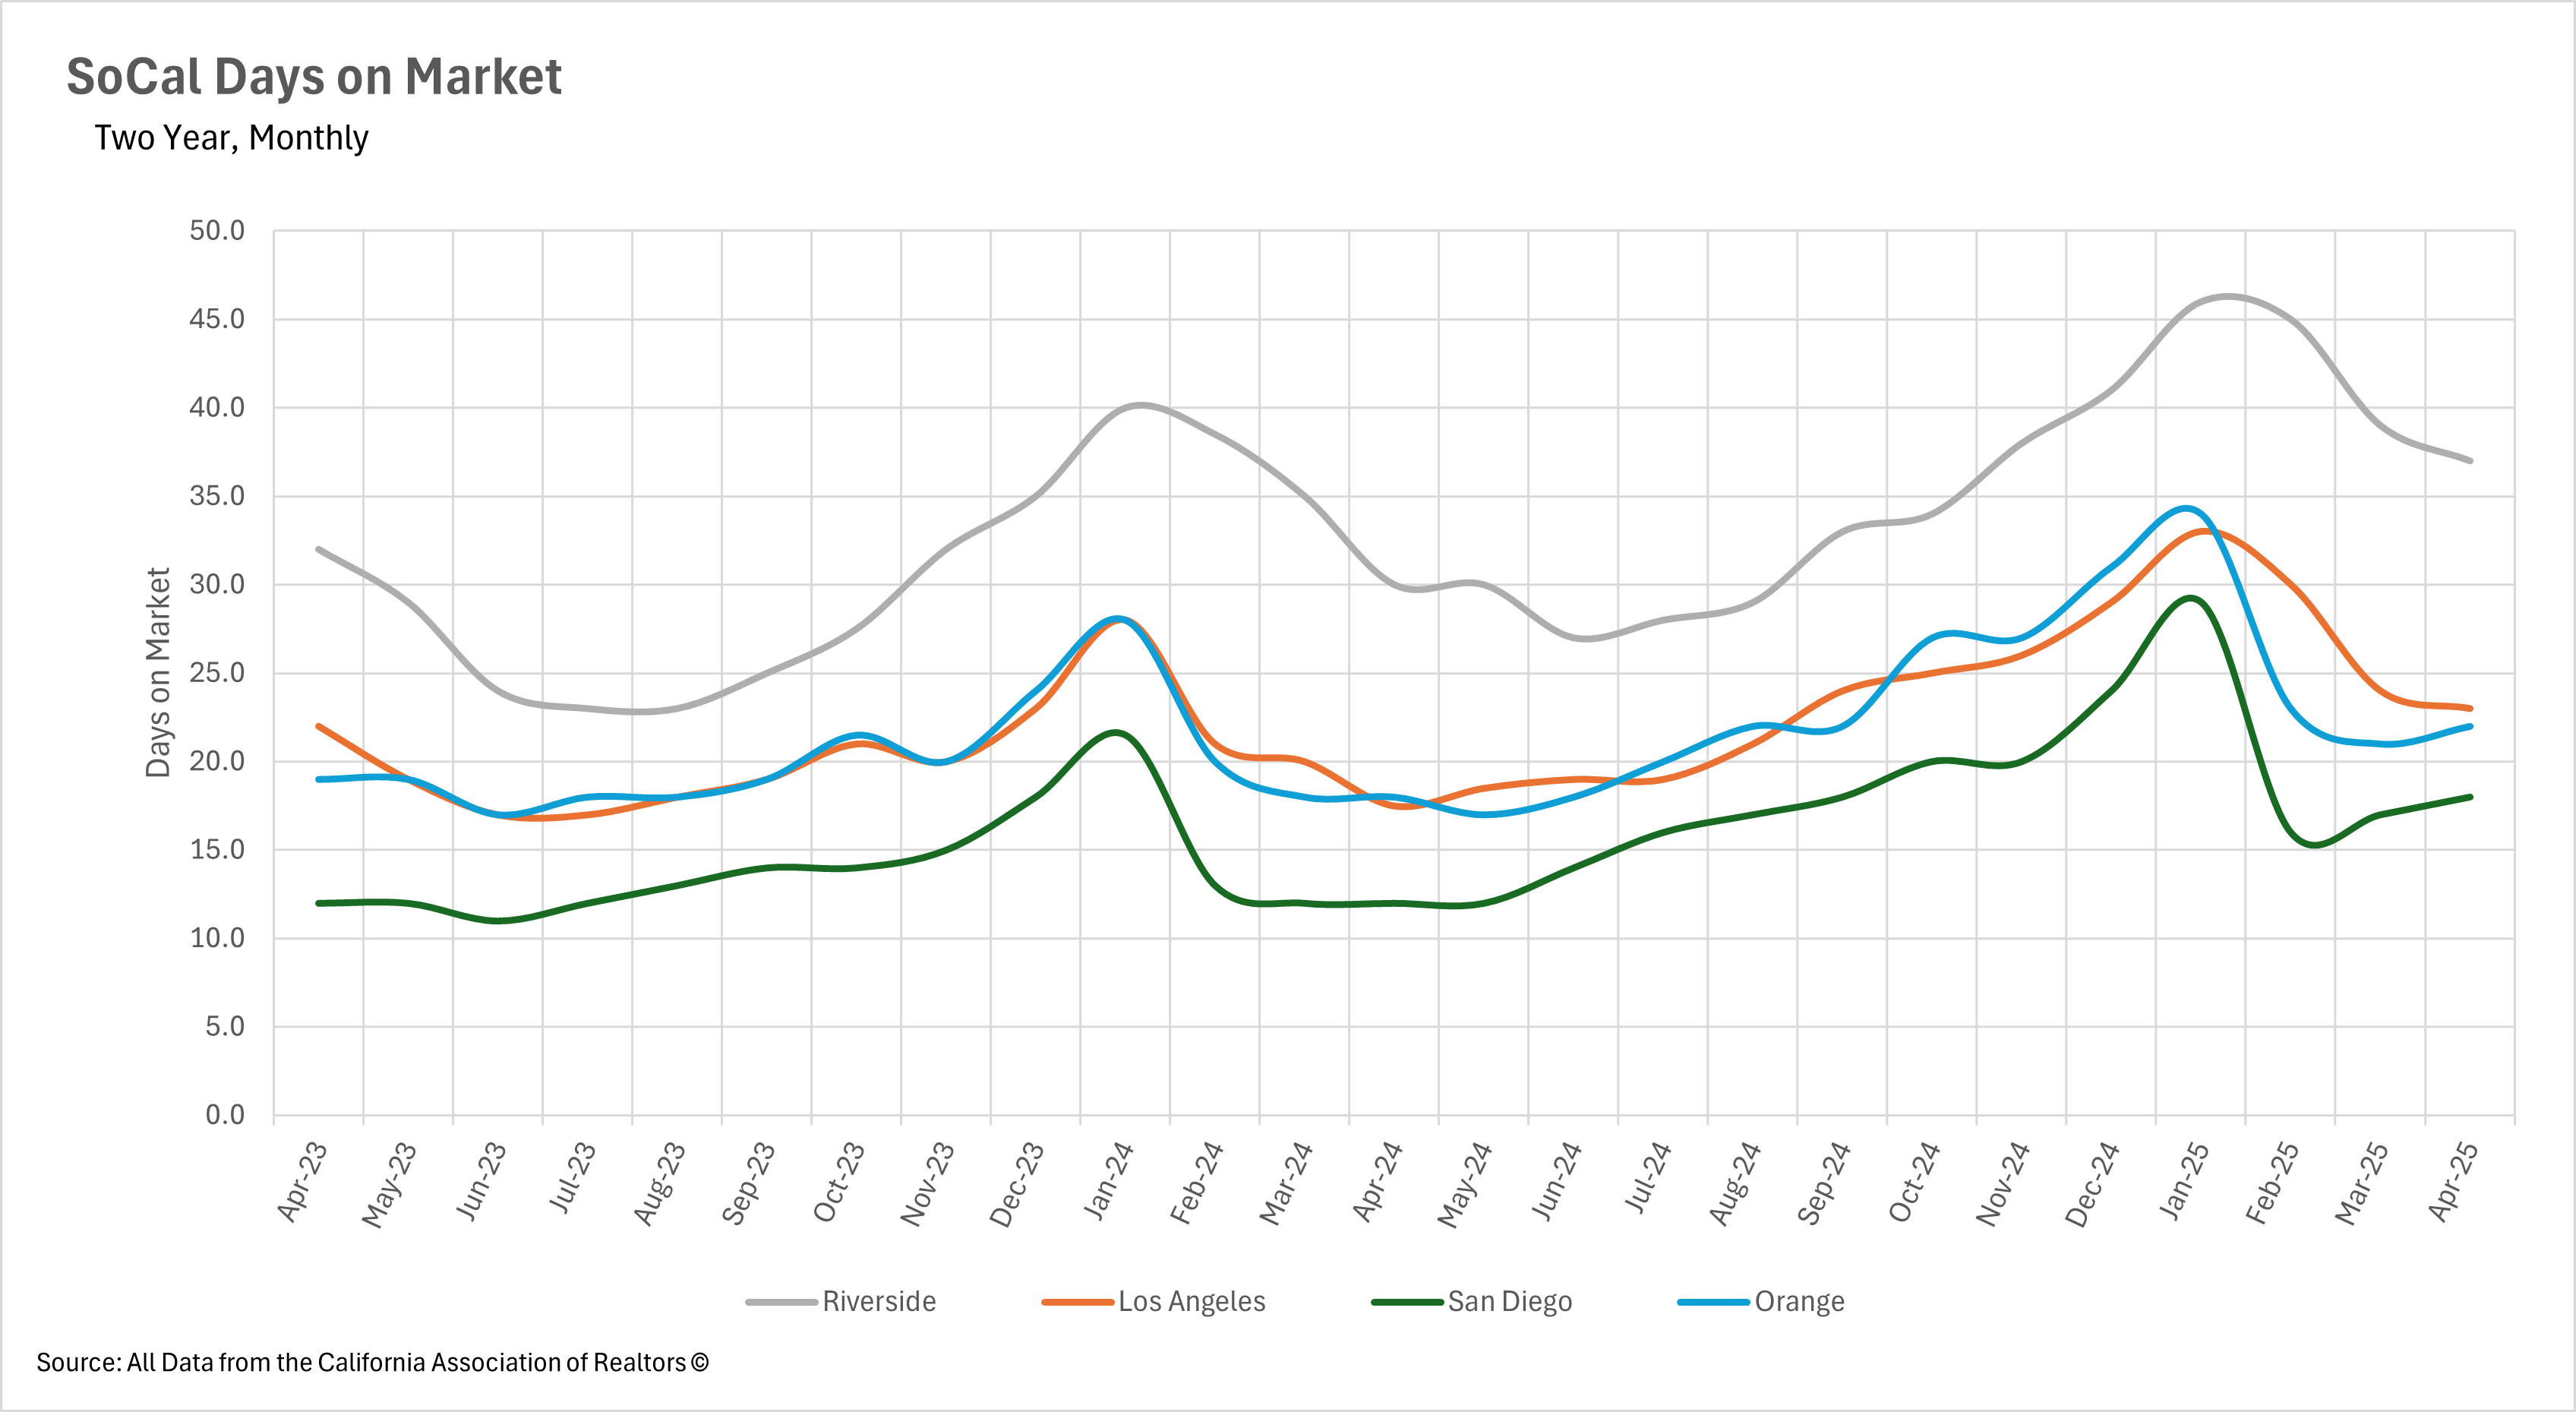
Despite the dramatic increase in available inventory, market timing metrics are showing nuanced patterns across Southern California counties. San Diego has experienced the most significant increase in days on market, with homes now taking 18 days to sell, a 50% increase from April 2024. Los Angeles County listings spend a median of 23 days on market, representing a 31.43% year-over-year increase, though this shows improvement from earlier peaks. Orange County homes take 22 days to sell, up 22.22% from last year, while Riverside County properties spend 37 days on market, a 16.88% annual increase.
Notably, several counties have shown month-over-month improvements despite year-over-year increases, suggesting that well-priced properties are still attracting buyer interest. This indicates that while the overall market has slowed considerably from the frenzied pace of previous years, quality homes with appropriate pricing strategies are still finding buyers within reasonable timeframes.
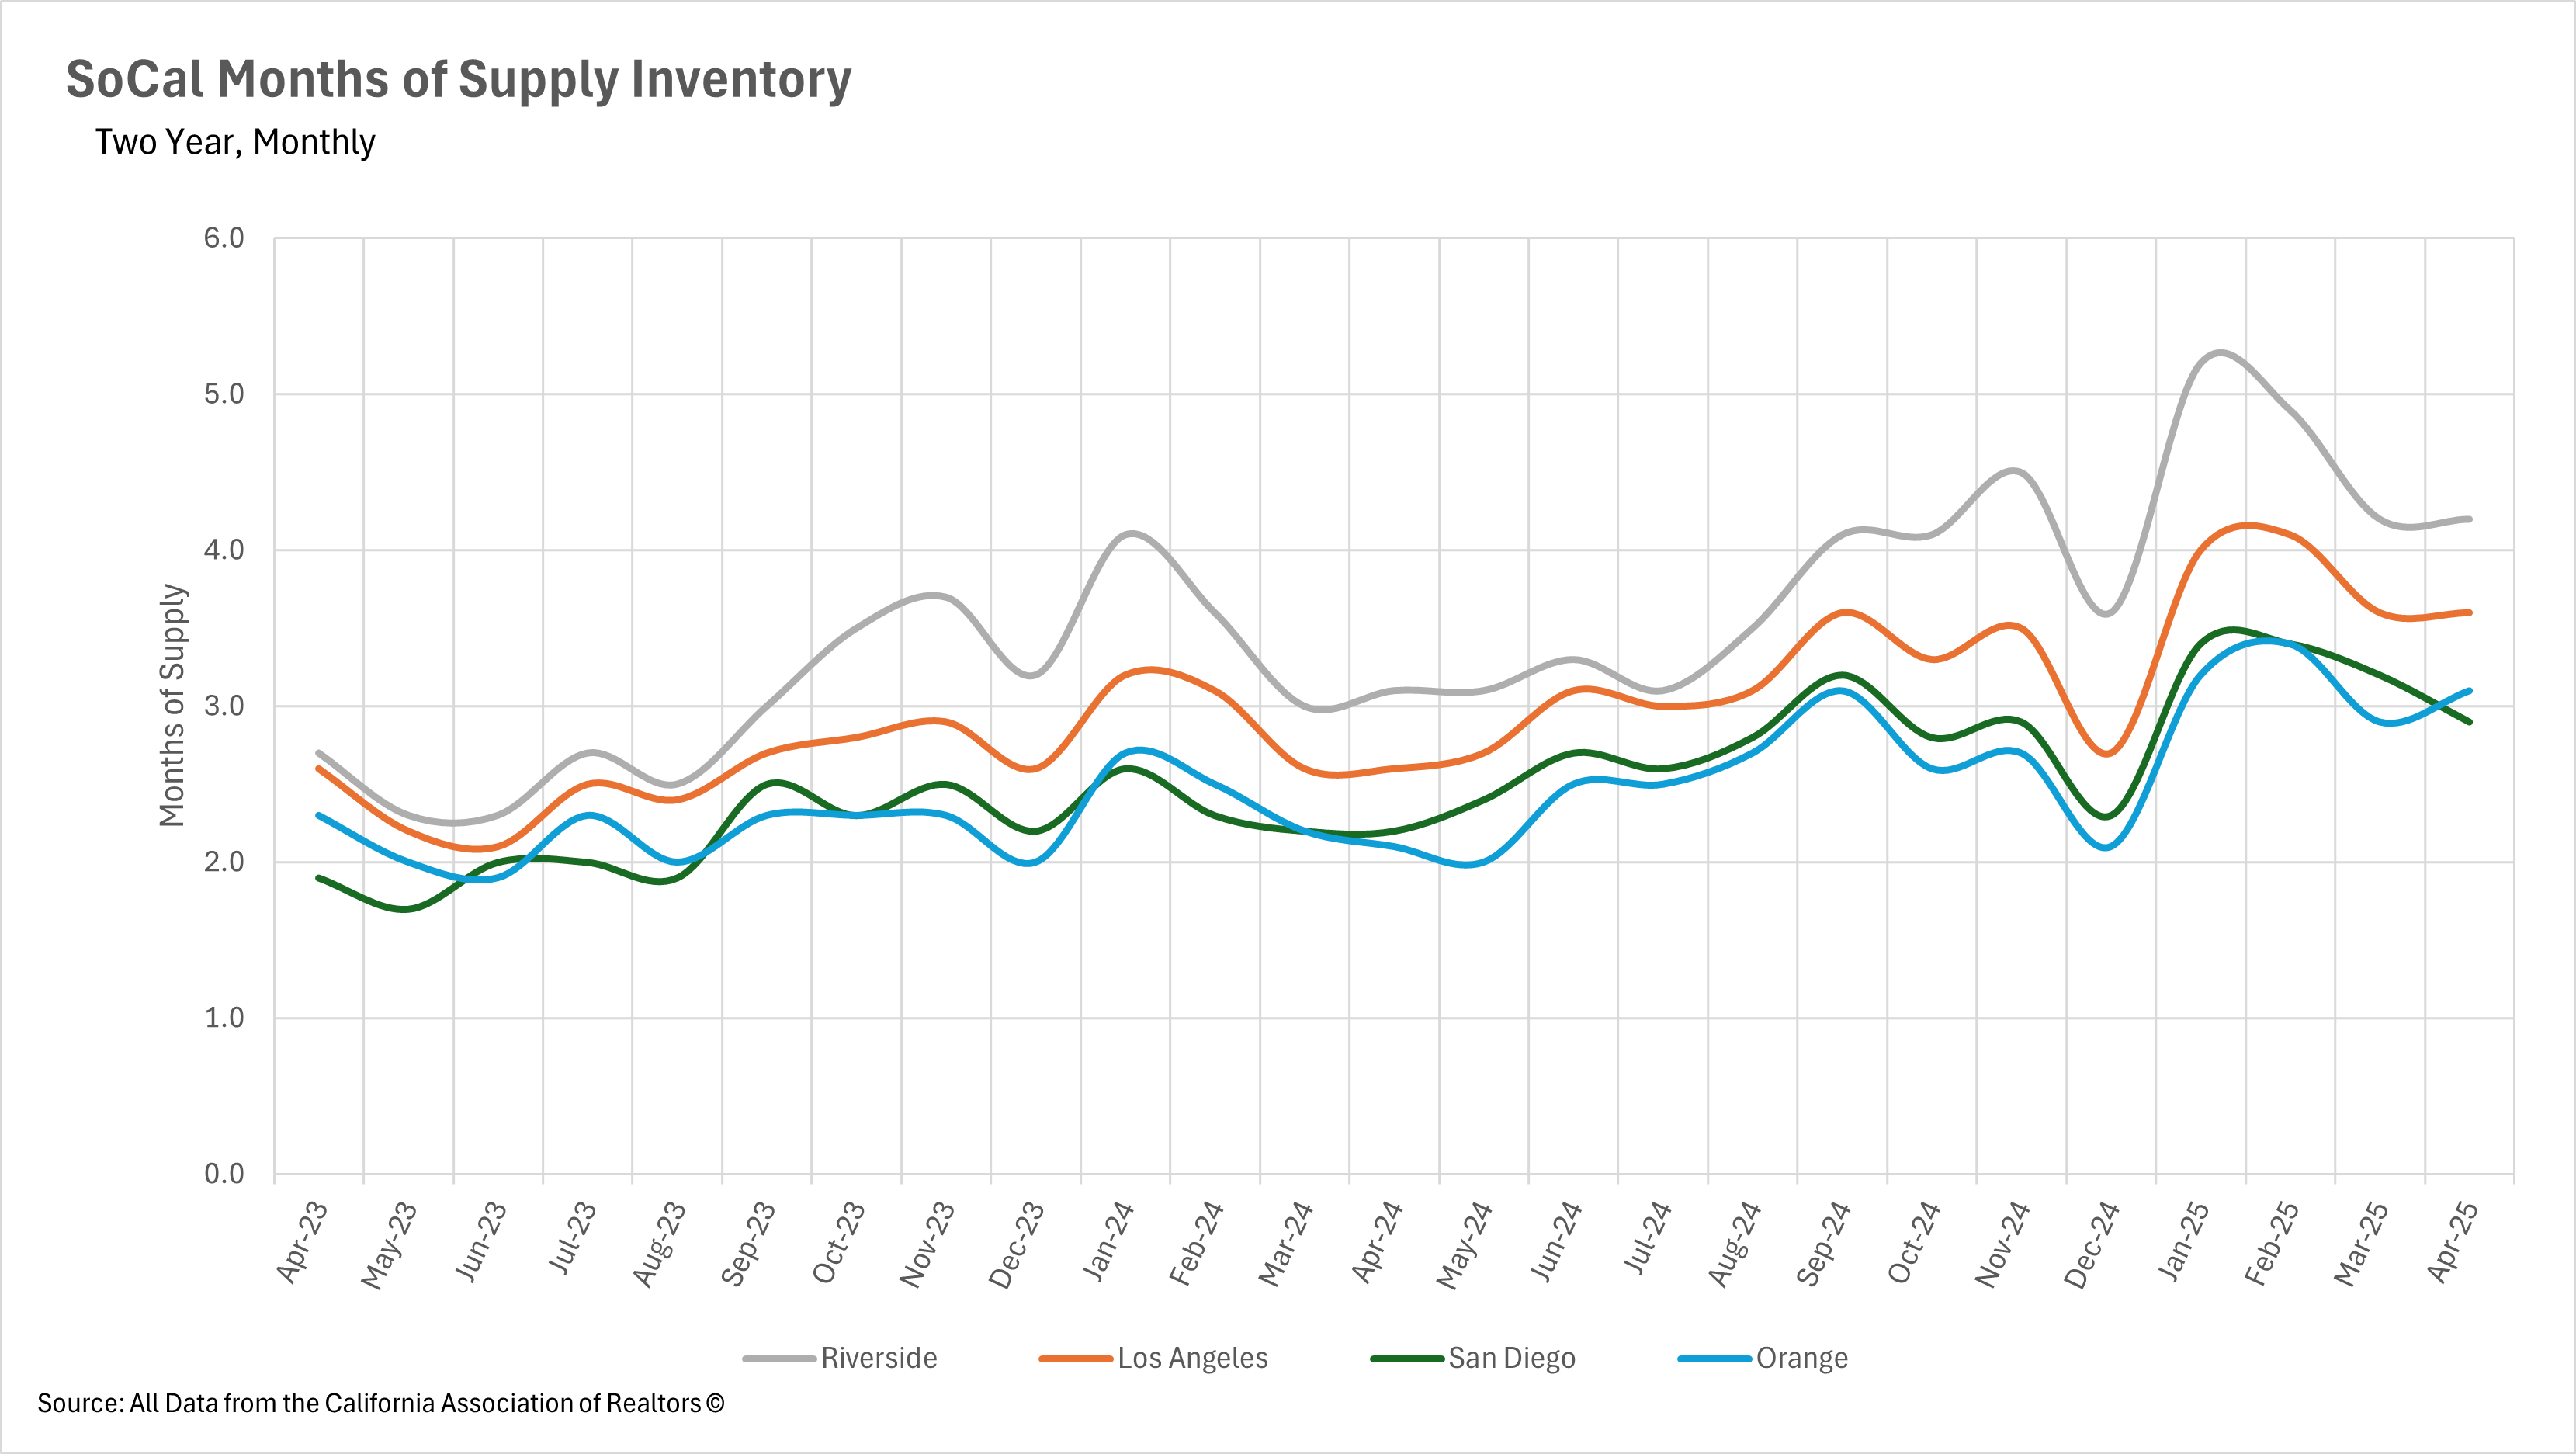
The most significant transformation in Southern California real estate is the complete shift in market balance from strongly favoring sellers to now giving buyers clear advantages across the region. When measuring Months of Supply Inventory (MSI), with three months historically representing a balanced California market, all counties have moved into balanced or buyer's market territory. Riverside County maintains the strongest buyer's market position with 4.2 months of supply in April, followed by Los Angeles County at 3.6 months. Orange County operates in balanced territory at 3.1 months, while San Diego County sits at 2.9 months in April, very close to the balanced threshold.
This represents a dramatic shift from early 2024, when all counties strongly favored sellers with MSI readings typically below 2.5 months. The sustained higher inventory levels mean buyers now have significantly more options, time to make decisions, and negotiating power than they've enjoyed in several years, while sellers must adjust their strategies and expectations to succeed in this fundamentally changed market landscape.
Stay up to date on the latest real estate trends.

August 2026

July 2026

A Closer Look at Dallas Rental Prices, Hidden Costs, and What Renters Need to Know Before Moving

June 2026

May 2026

April 2026
March 2026

February 2026
January 2026
You’ve got questions and we can’t wait to answer them.