Market Update Los Angeles
Note: You can find the charts & graphs for the Big Story at the end of the following section.
*National Association of REALTORS® data is released two months behind, so we estimate the most recent month’s data when possible and appropriate.
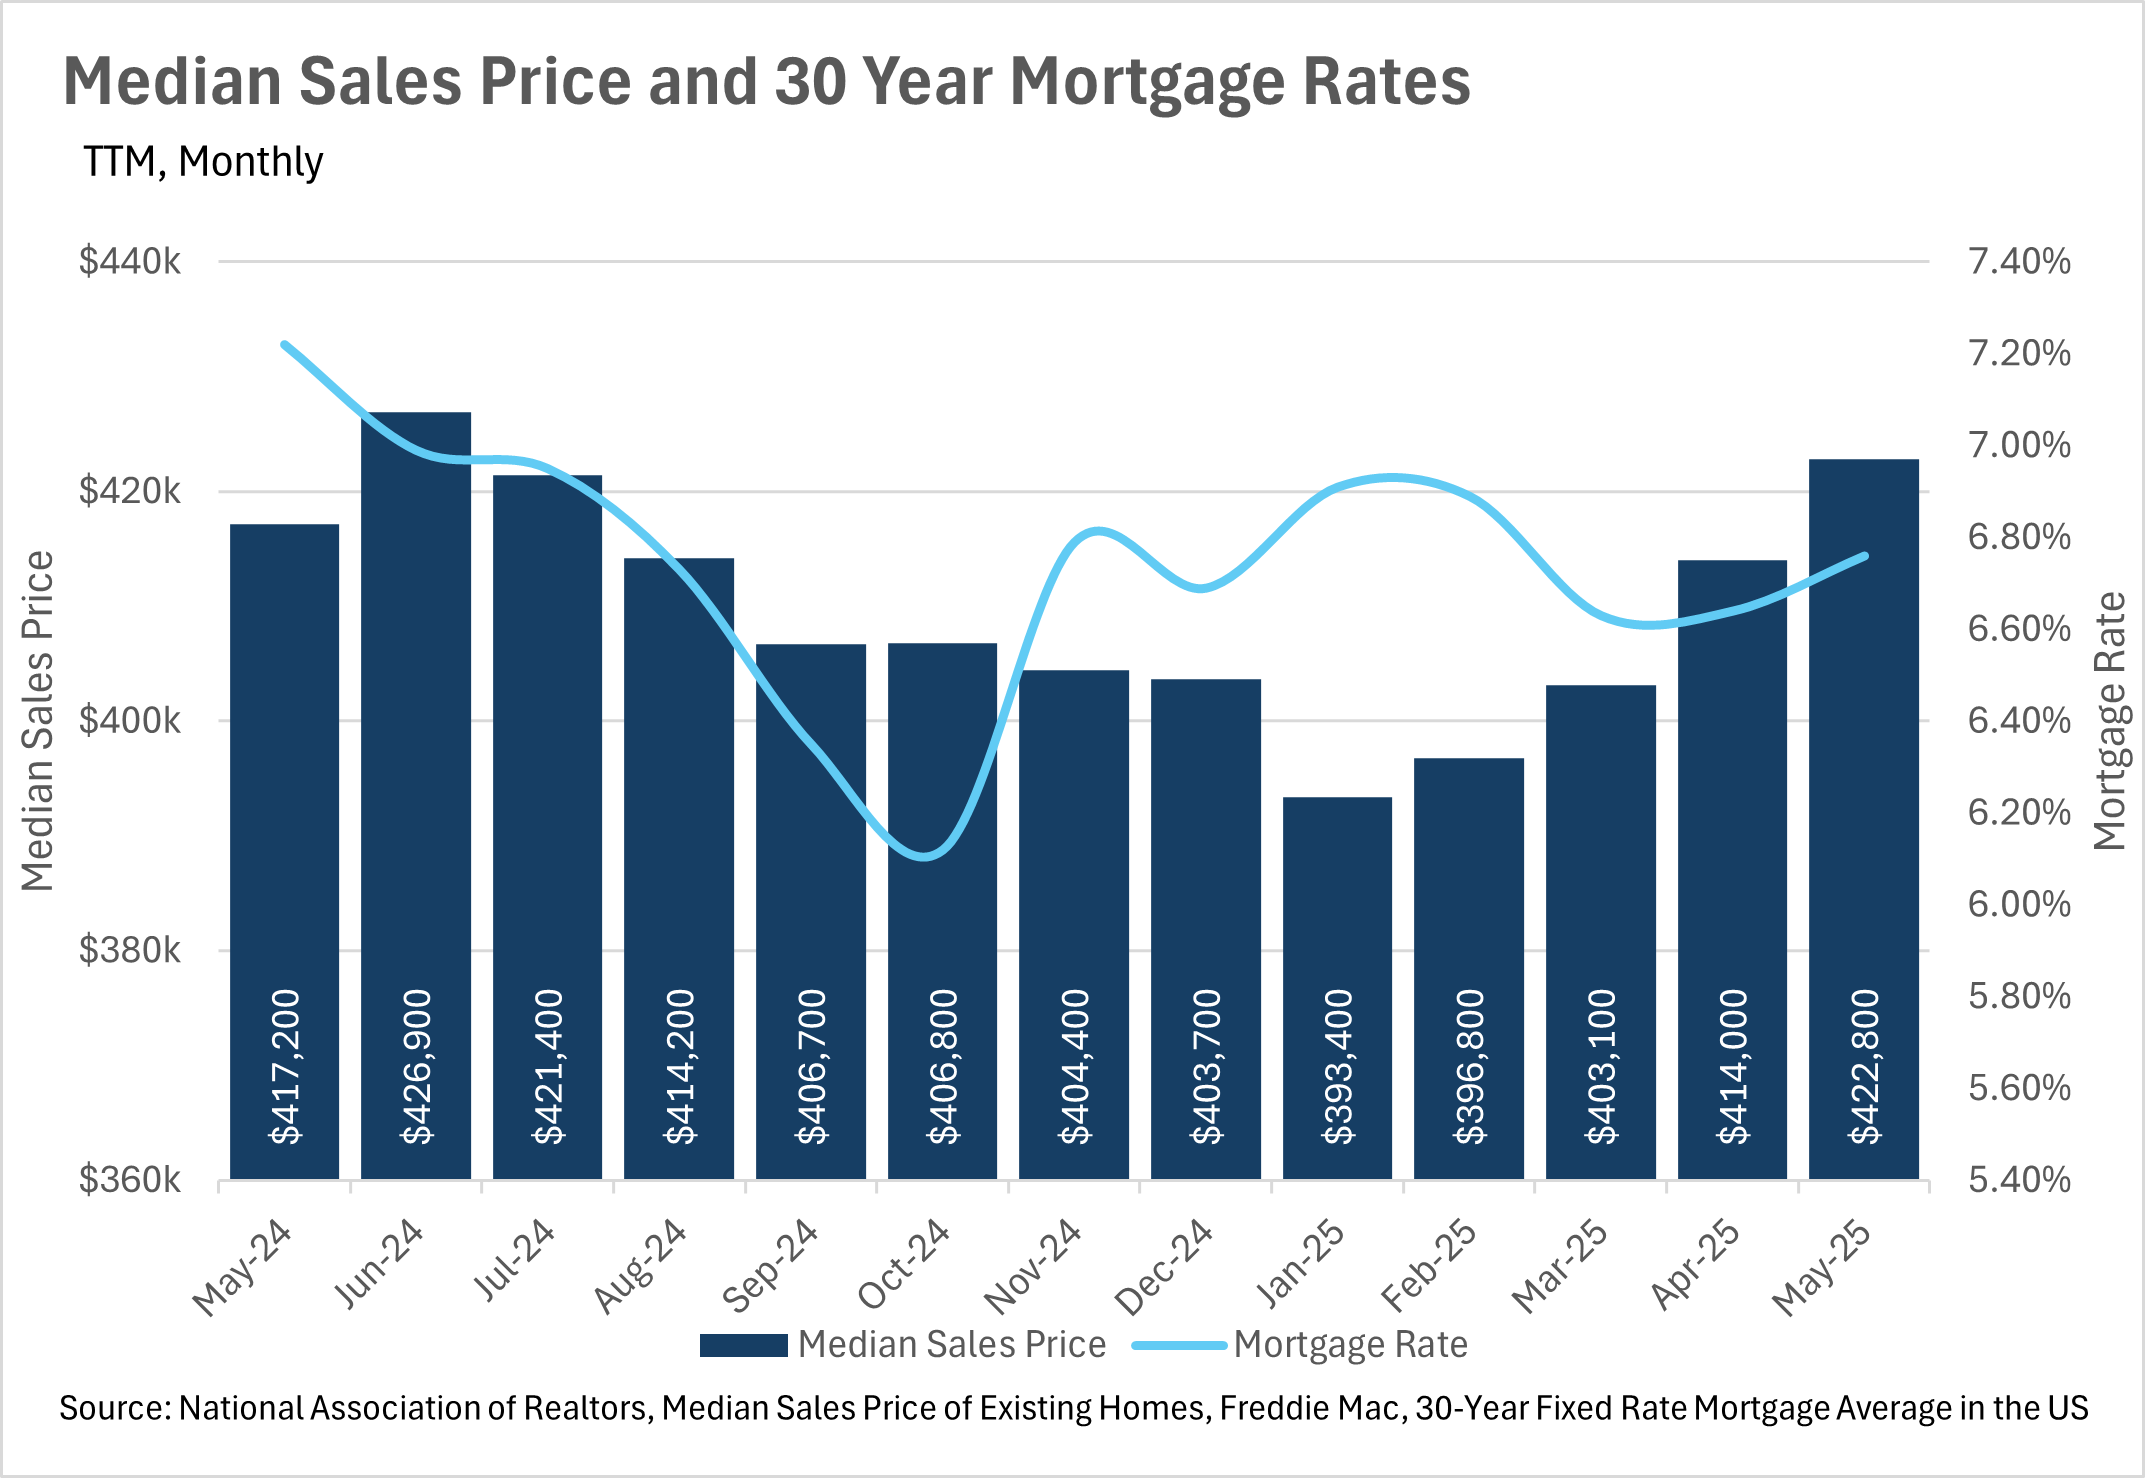
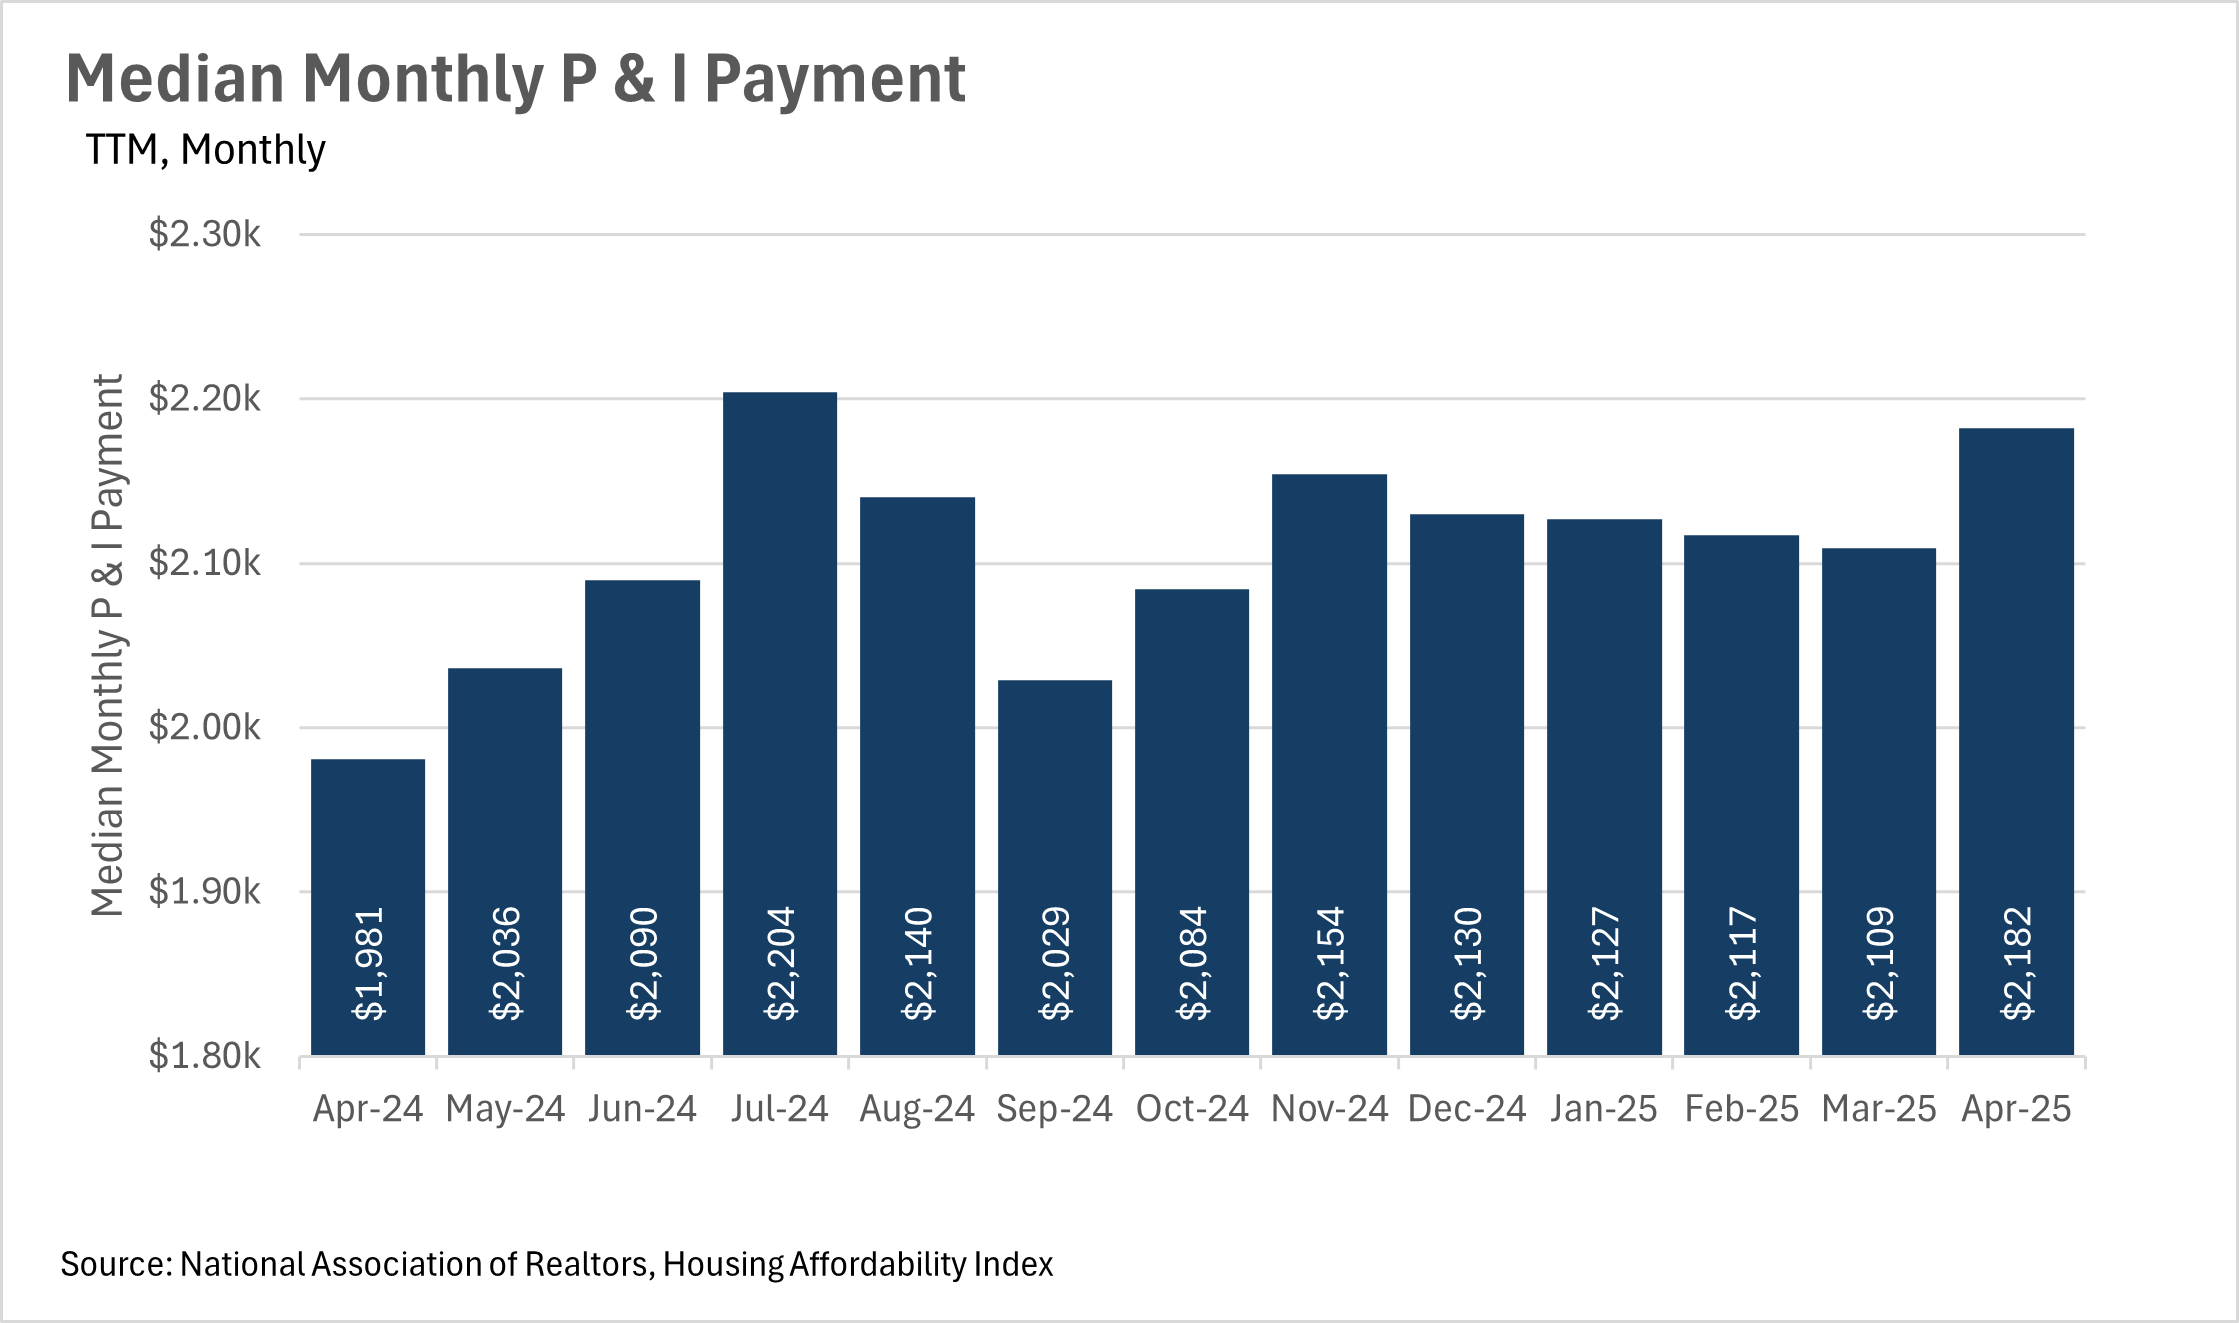
As we all know, housing affordability has been a problem on a national scale for quite a few years at this point. At this point in time, many find it hard to believe that the housing market will return to pre-pandemic levels in terms of affordability at any point in the near future. Unfortunately, things have not gotten much better, as the median monthly P&I payment increased by 10.15% on a year-over-year basis, to $2,182 in the month of April. This jump in P&I payment represents a drastic month-over-month jump of 3.46%. This jump is actually quite perplexing, as median home sale prices have increased by 1.34% on a year-over-year basis, while mortgage rates have actually come down.
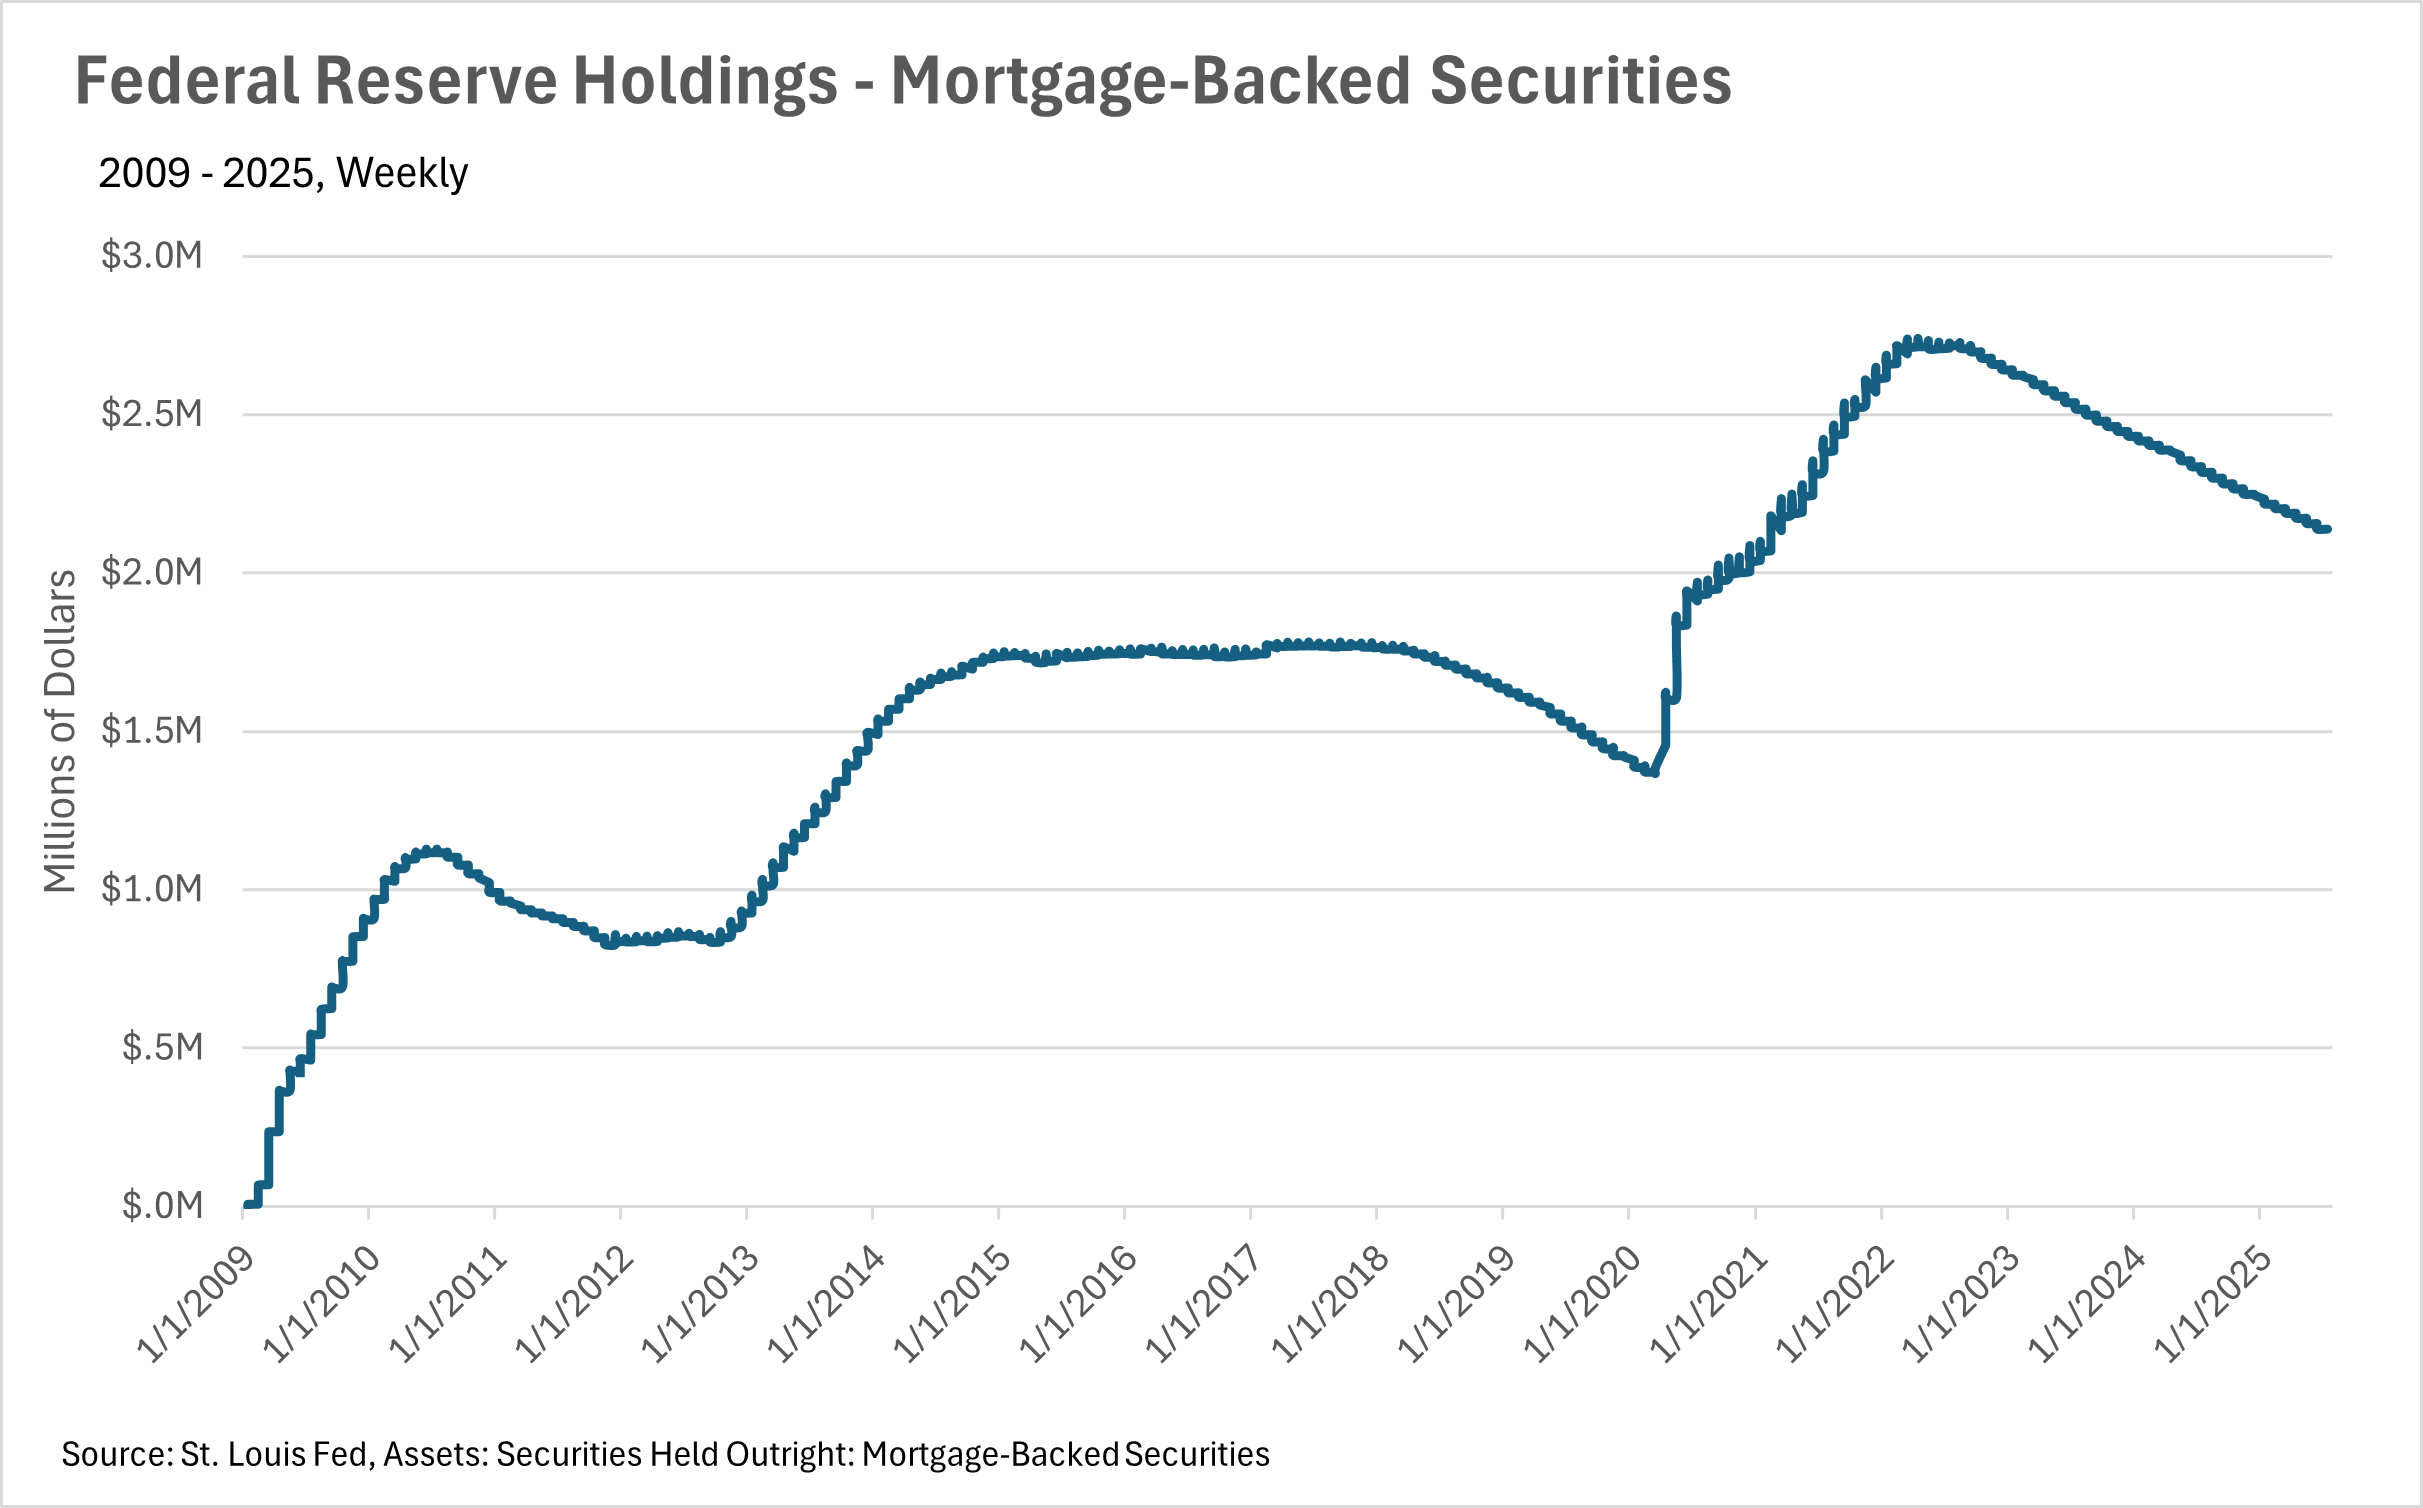
For the past few months, mortgage rates have remained fairly stable, in the mid-six percent range. Although the stability that we’ve seen is a good thing, the levels they’ve stabilized at are quite a bit higher than recent historical averages. This, of course, is one of the leading causes of the affordability issues that we’ve seen recently.
It is worth noting, though, that we might see some discounted rates toward the back half of the year. Although the Fed has not touched the federal funds rate in nearly a year, the Fed chairman has signaled that one to two rate cuts are expected by the end of the year, so long as there aren’t any further spikes in inflation.
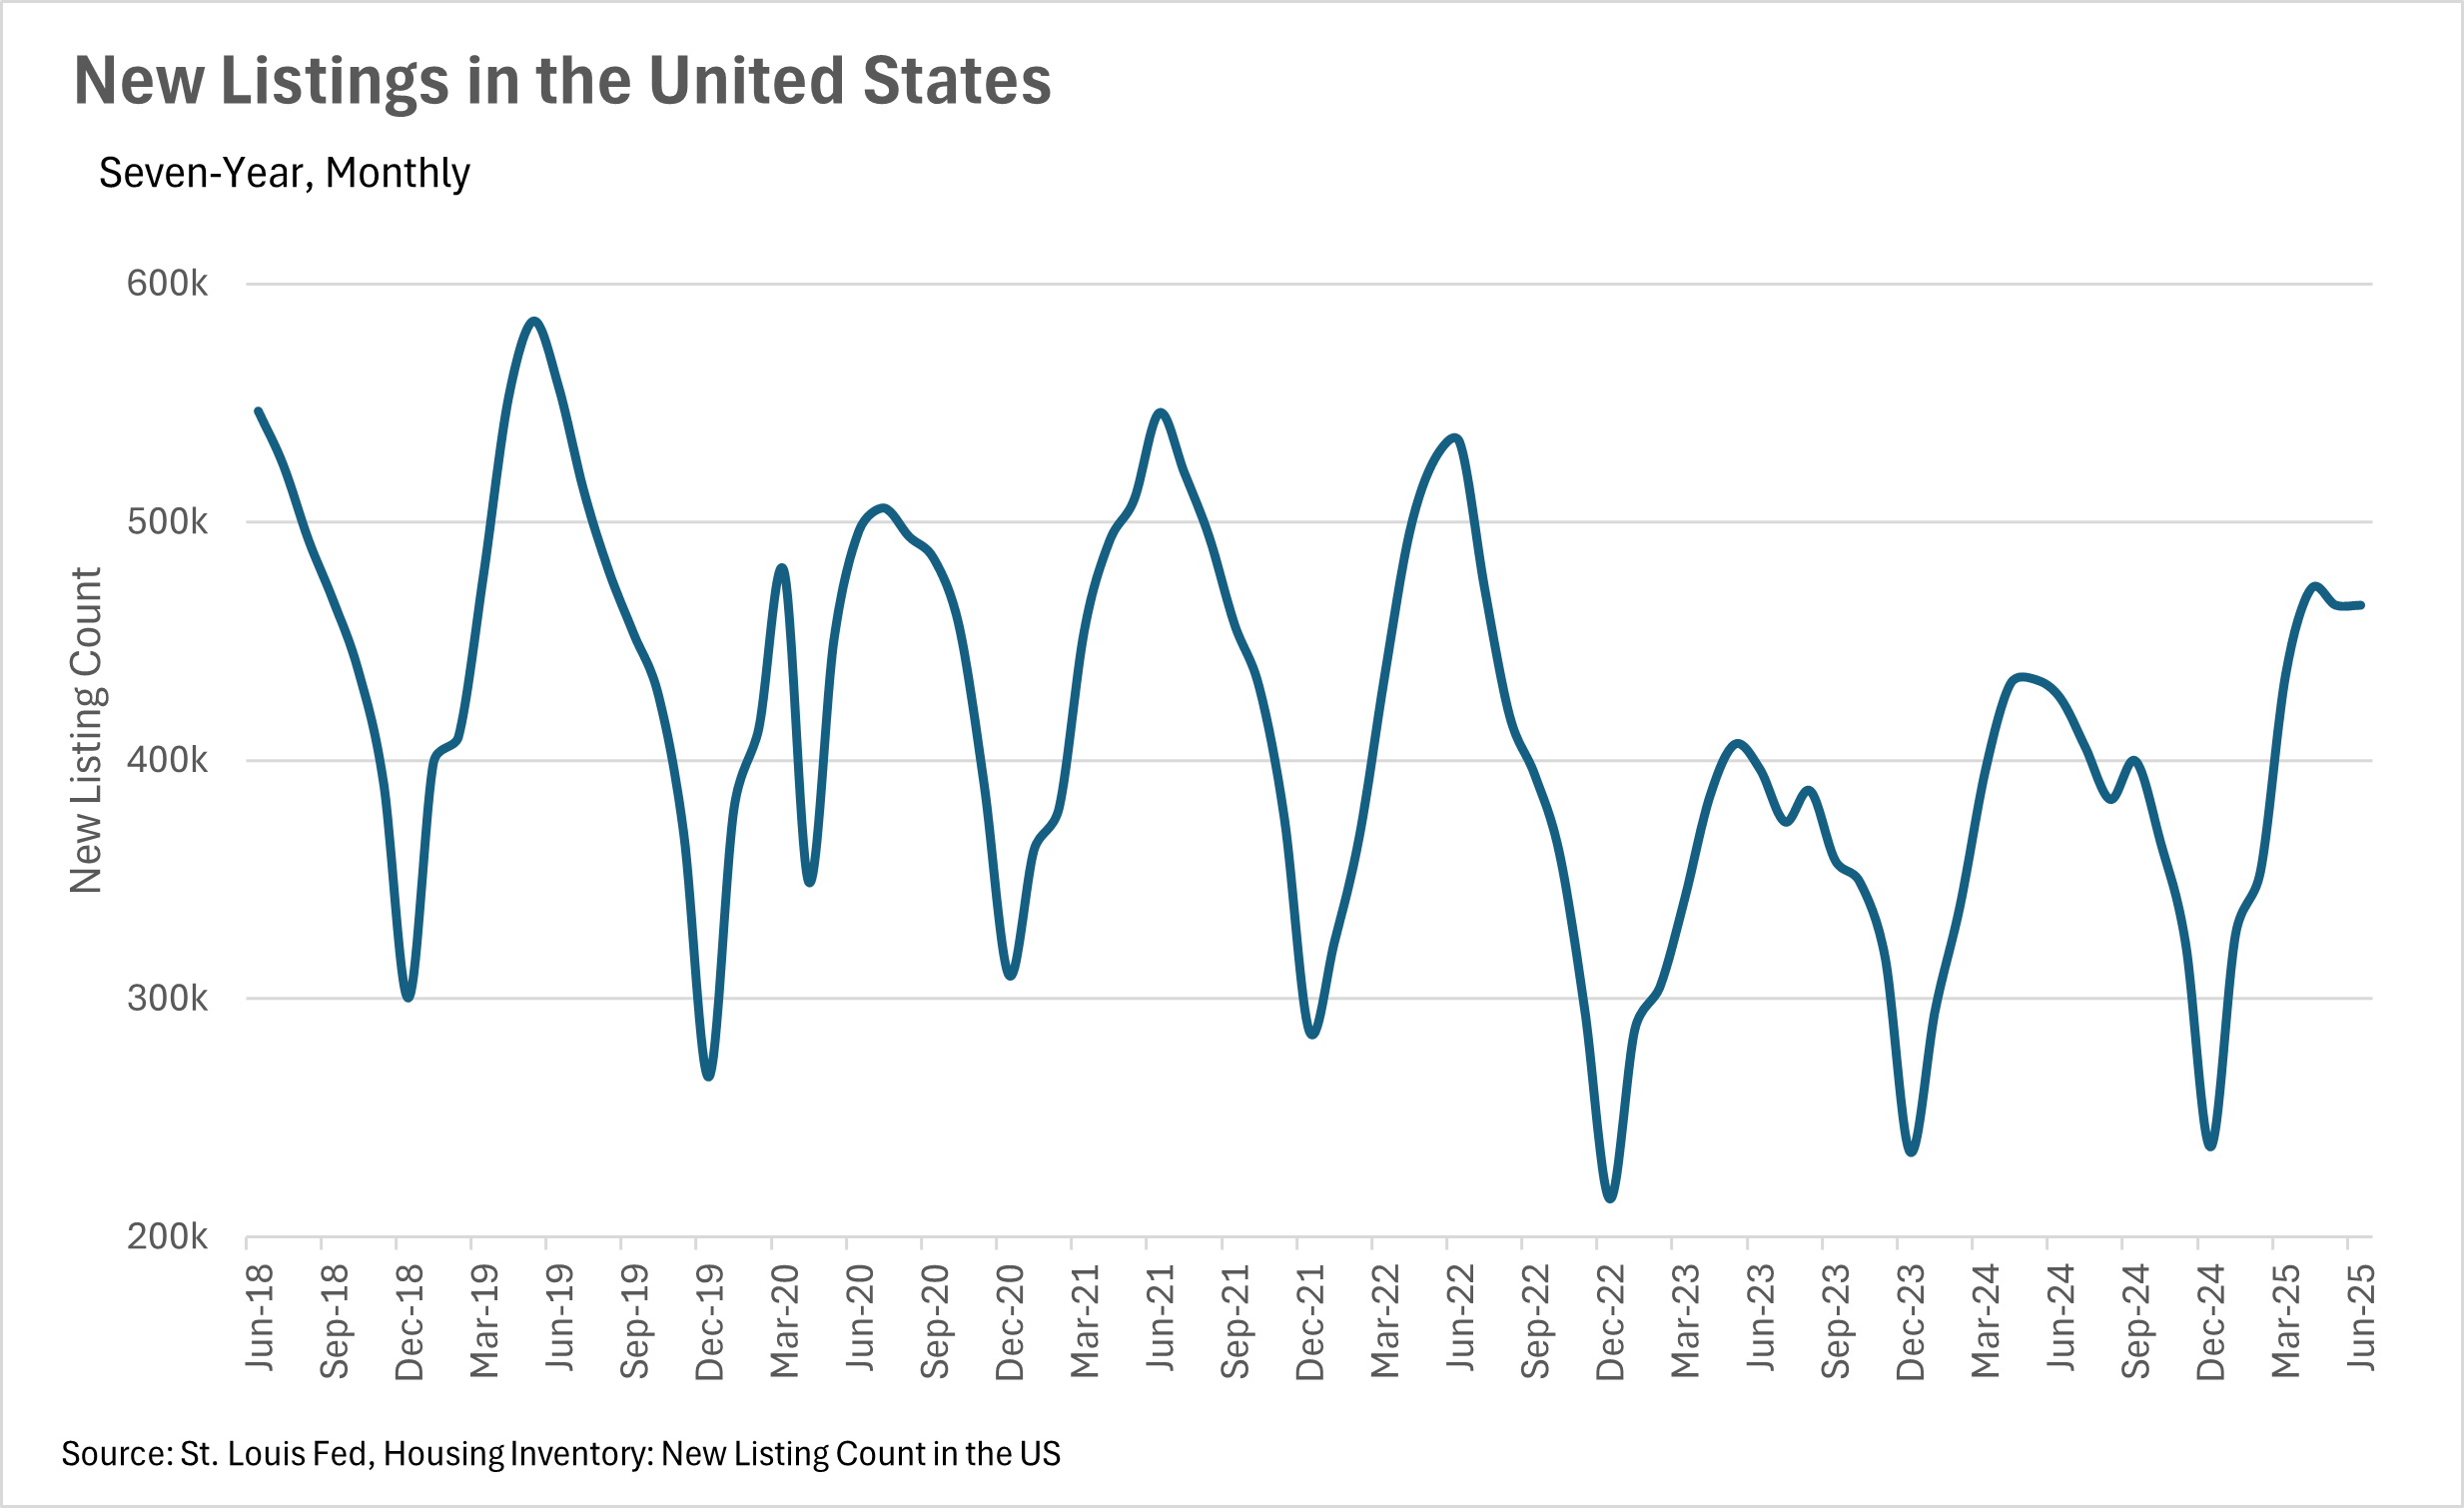
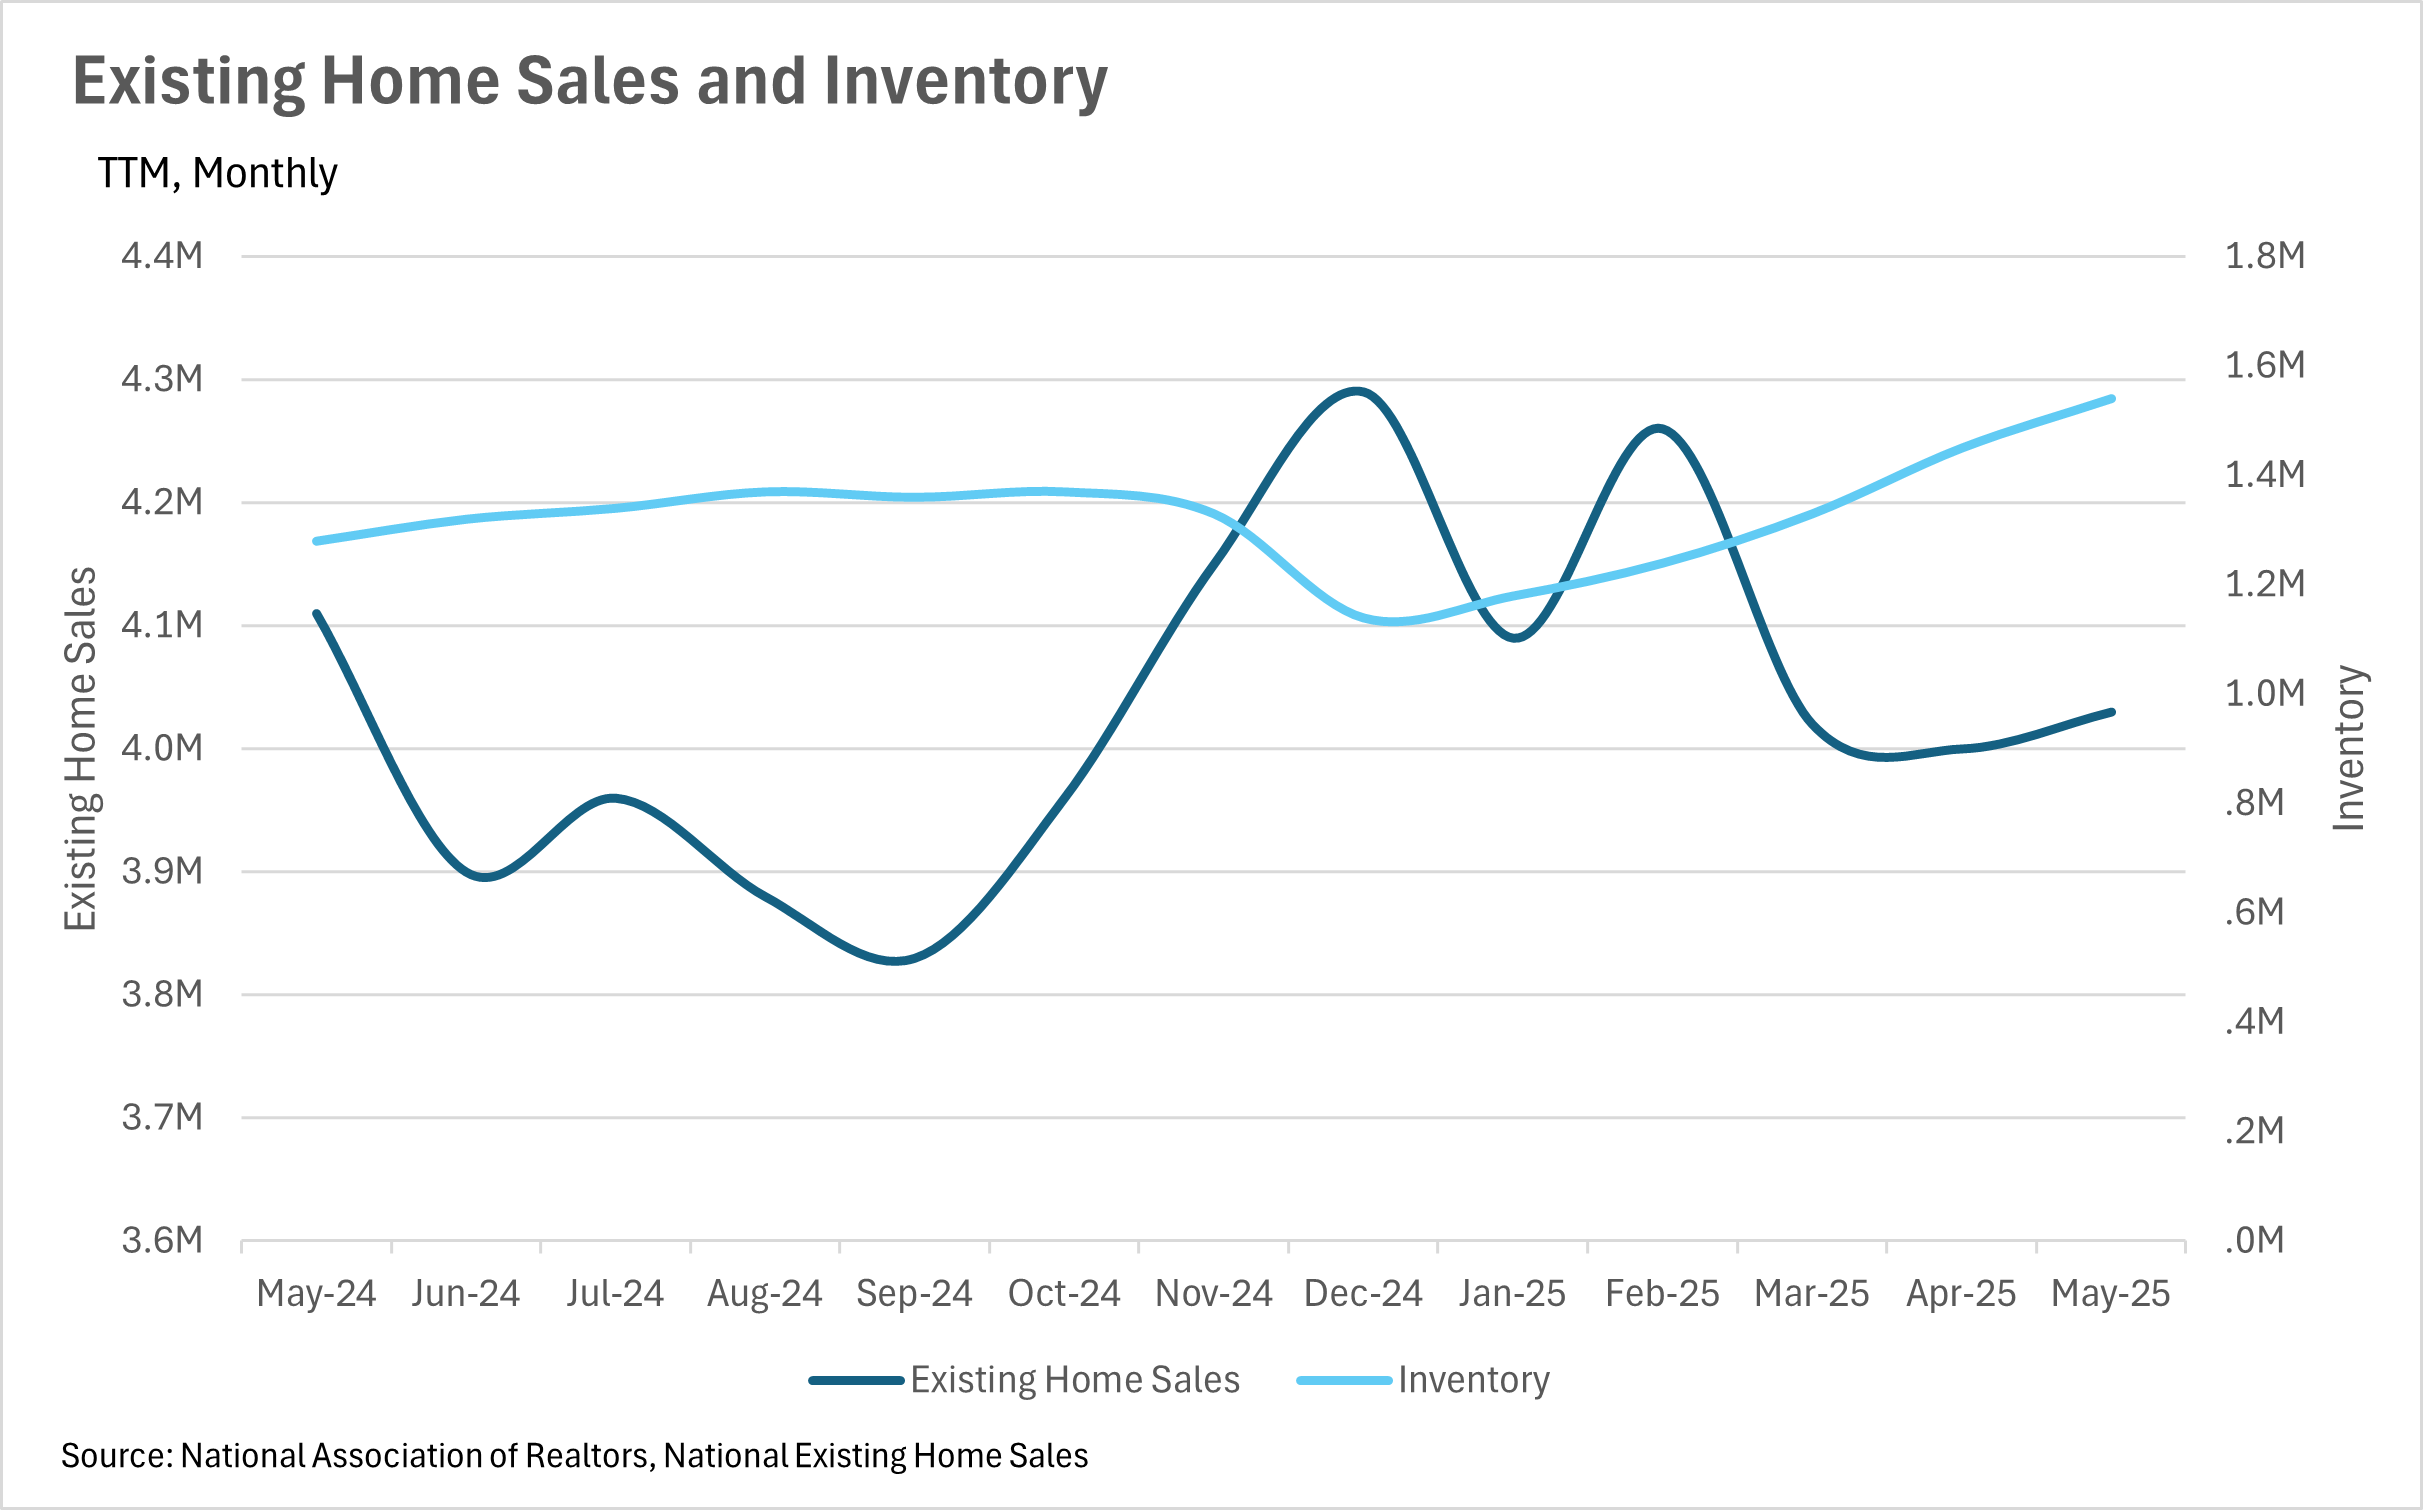
What we have been seeing in terms of inventories in California has been echoed on a nationwide scale. Fewer homes are being sold, with 1.95% fewer existing home sales when compared to this time last year. At the same time, 9.95% more new listings have hit the market on a year-over-year basis. This has led overall inventory to increase by a whopping 20.31% on a year-over-year basis.
As inventories are piling up, negotiating power will slowly shift from the sellers to the buyers, as buyers have more opportunities, and don’t need to move nearly as quickly as they had to just a year earlier.
In any market, but especially the real estate market, instability is incredibly detrimental. Given the recent rise in uncertainty around tariffs and employment, coupled with continued instability in Europe and the Middle East, both buyers and sellers have become much more cautious. Inventories are growing throughout California and the broader United States. However, for those who have the capital and a long time horizon, times like these can represent excellent buying opportunities, as good deals are easier to come by.
However, it’s important to note that this is just what we have been seeing at the national level. California markets have largely remained resilient, which we’ll delve into more in the local lowdown section below.
Note: You can find the charts/graphs for the Local Lowdown at the end of this section.
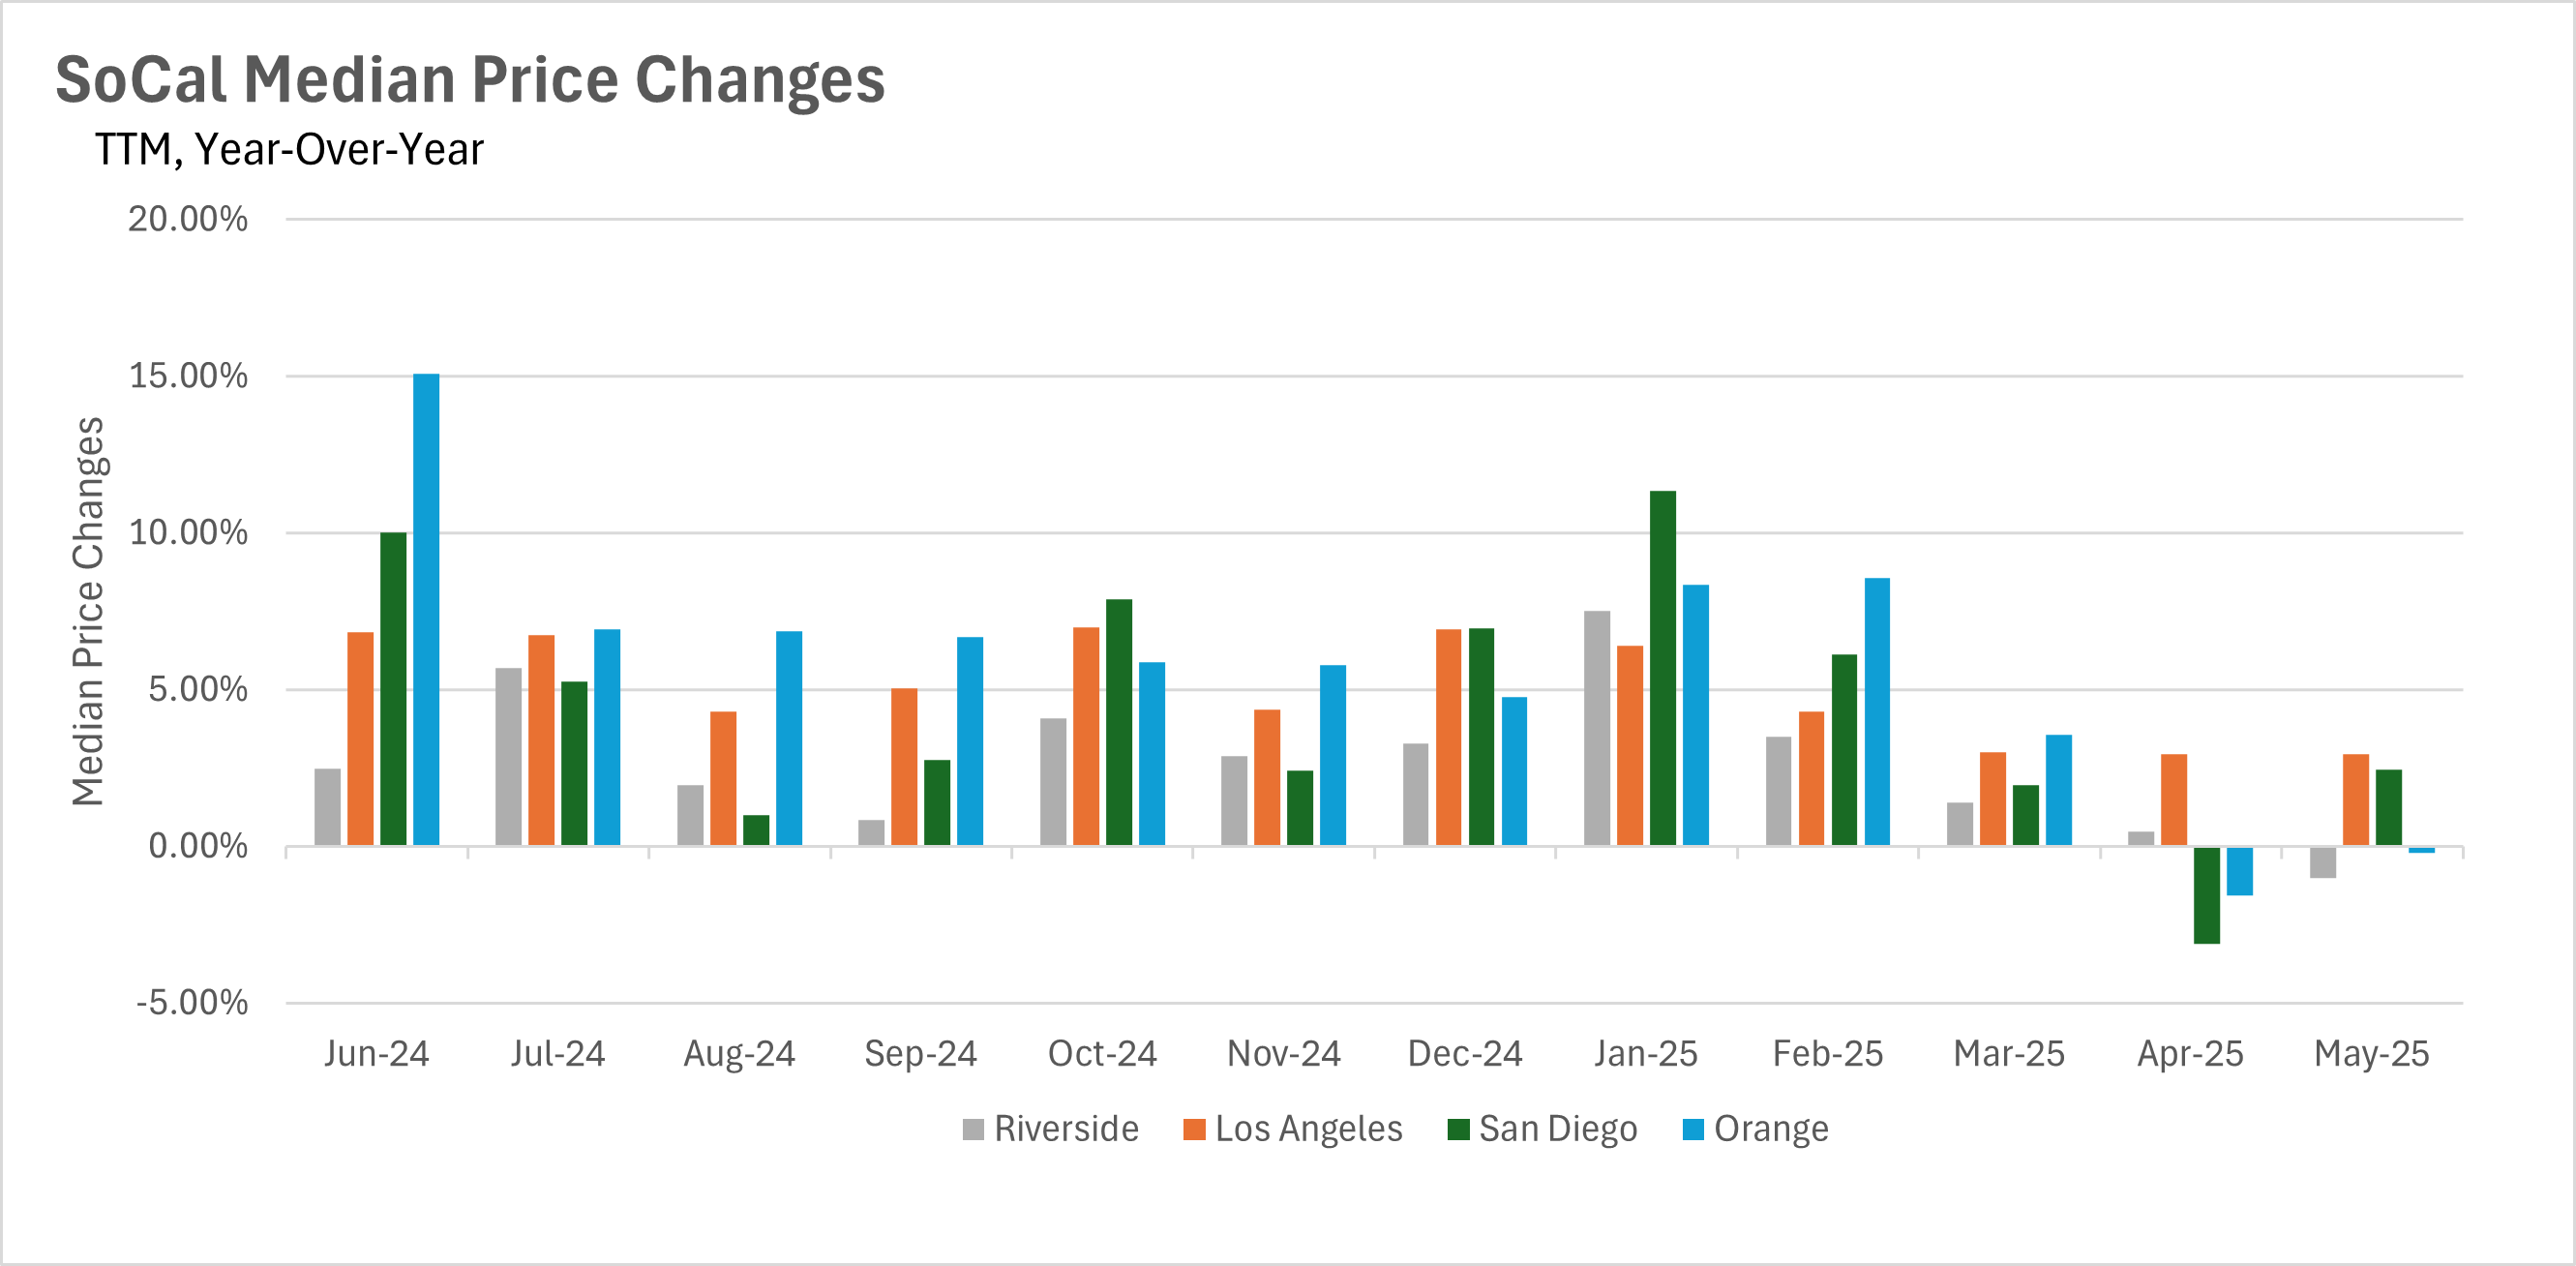
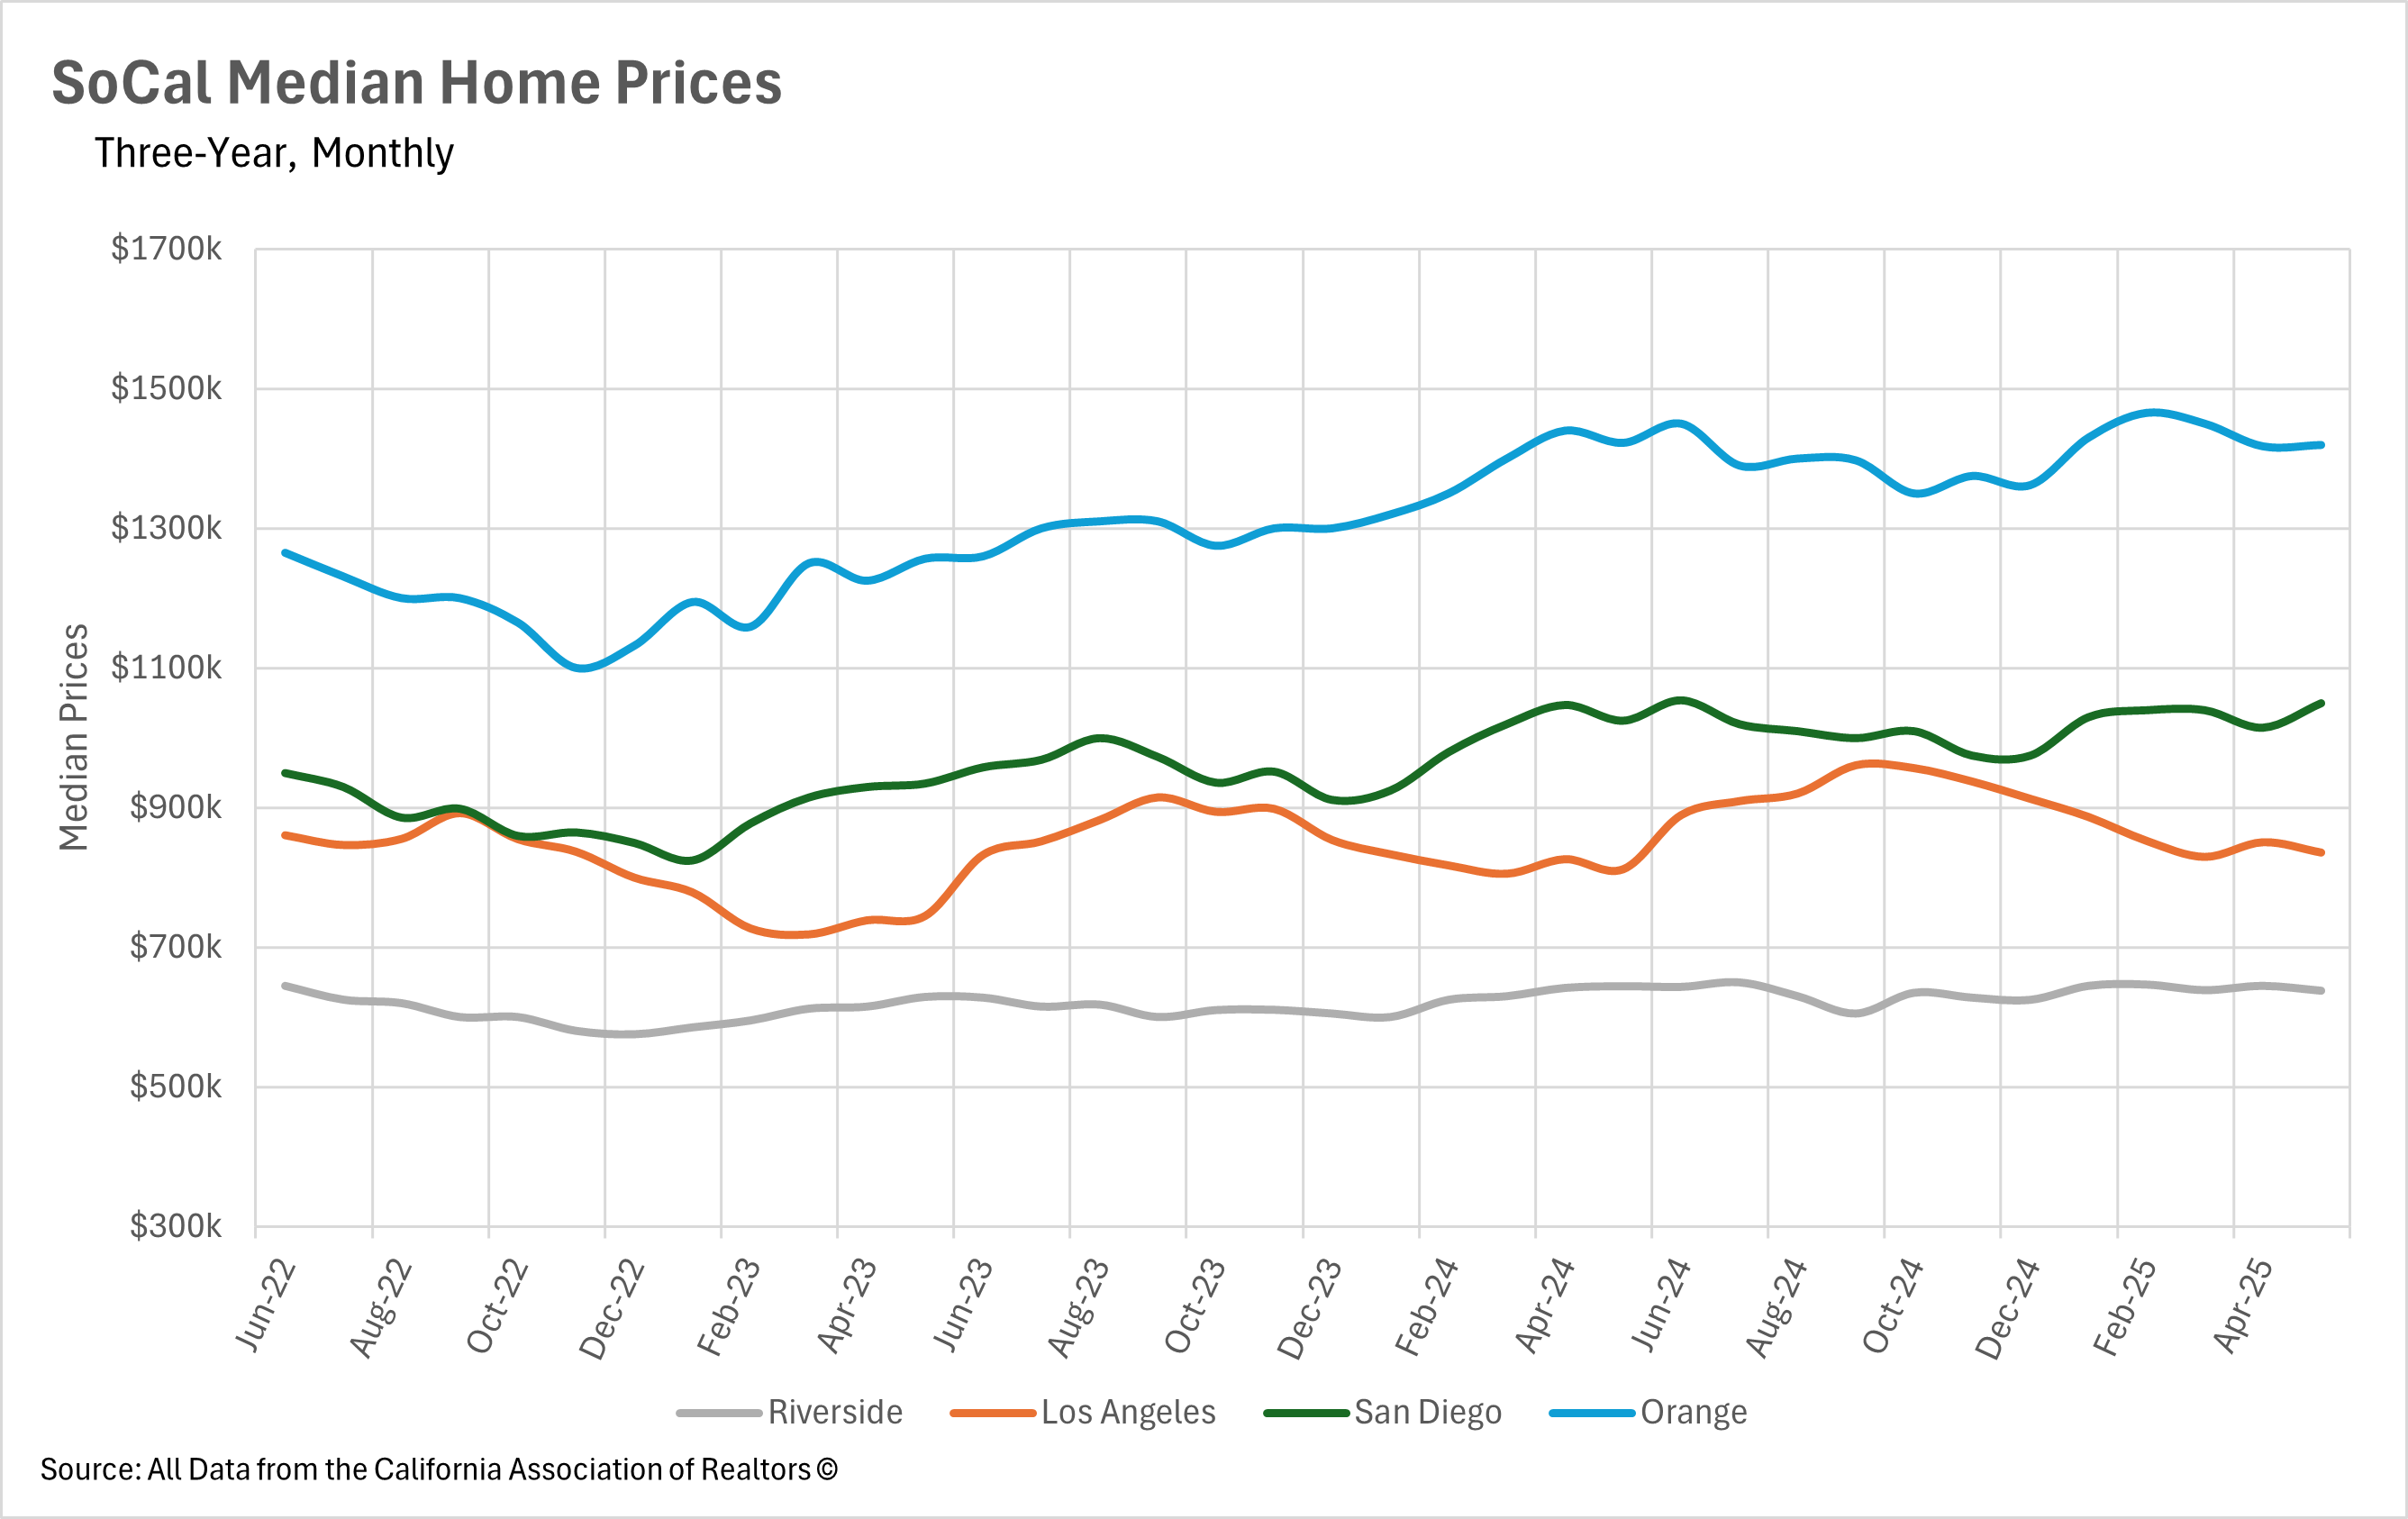
Southern California's real estate markets are displaying increasingly divergent price trends as we move through mid-2025. San Diego County has shown remarkable resilience, rebounding from April's brief dip with May prices reaching $1,050,000, representing a solid 2.44% year-over-year increase. Los Angeles County appears to have found its equilibrium, maintaining exactly the same 2.94% growth rate for two consecutive months at $835,480. In contrast, Orange County is experiencing its first sustained price correction in years, with May showing a 0.21% year-over-year decline to $1,419,500, marking the second consecutive month of negative growth. Riverside County has seen the most dramatic shift, with May prices declining 1.01% year-over-year to $638,000. This divergence reflects varying local market dynamics, with some areas maintaining underlying demand strength while others show clear signs of price correction in response to dramatically increased inventory levels.
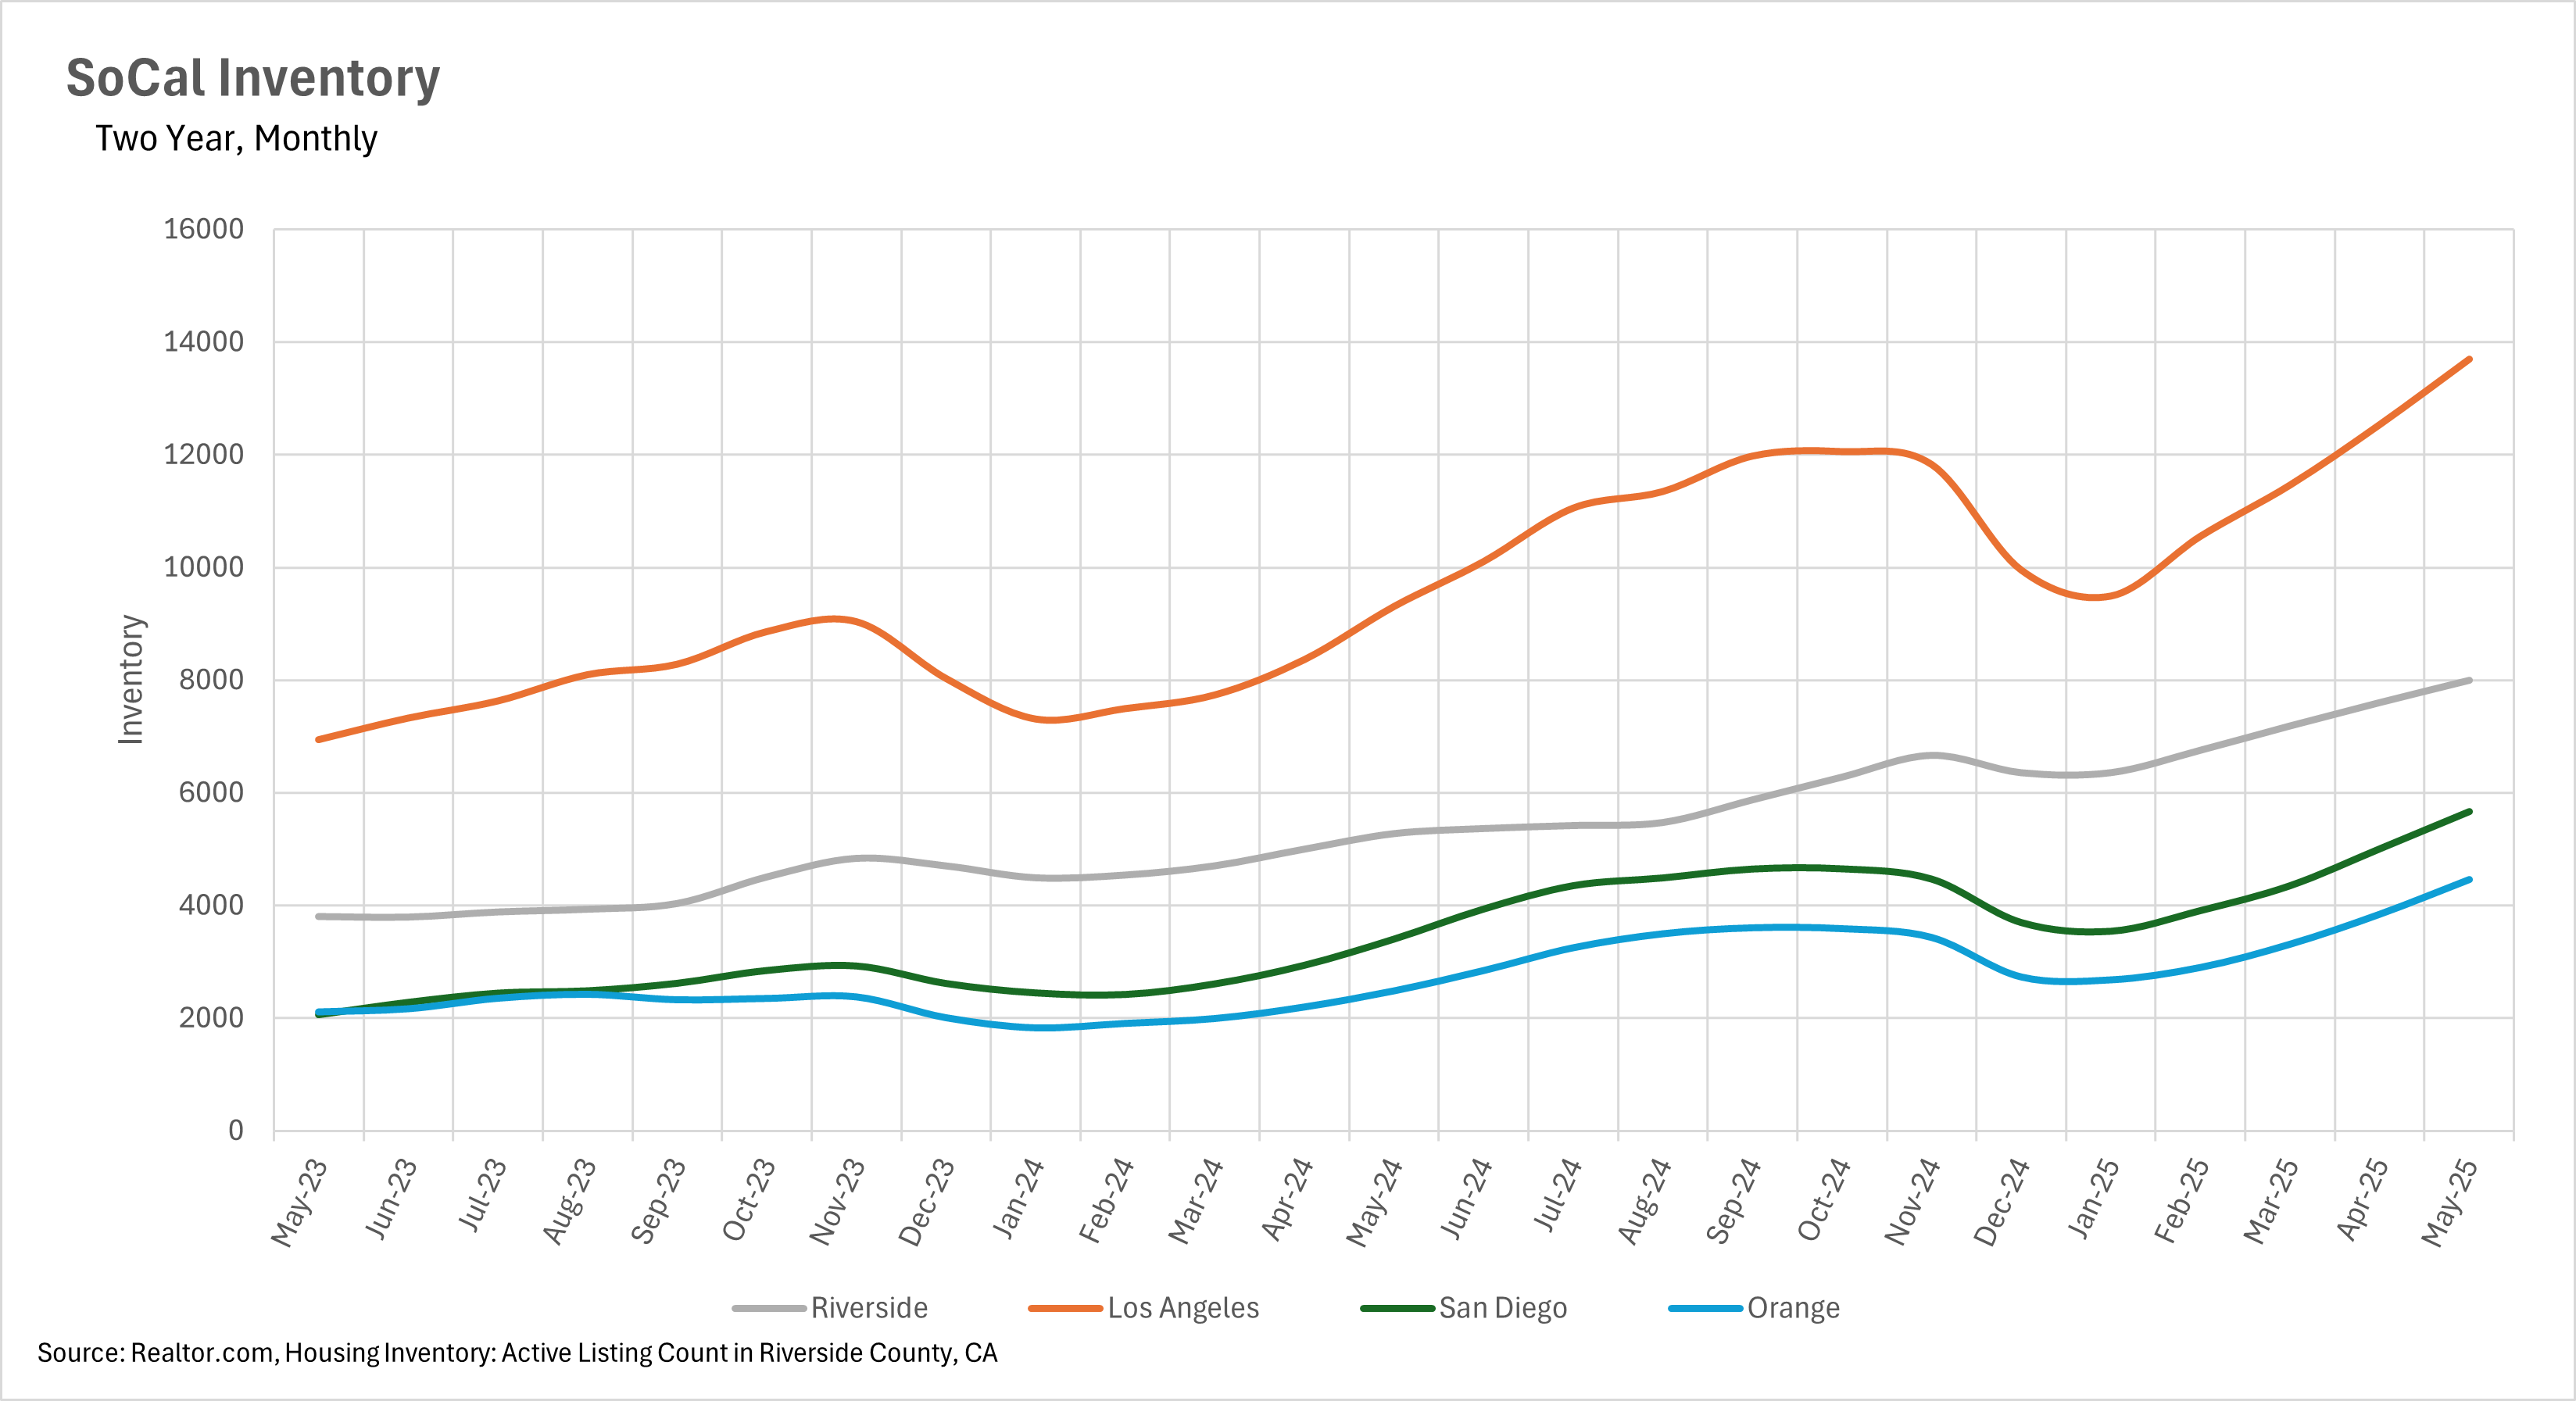
The defining characteristic of Southern California's 2025 real estate market has been the unprecedented surge in available housing inventory across all counties. Orange County continues to lead this trend with a massive 79.28% year-over-year increase, reaching 4,457 single-family homes in May. Riverside County follows closely with a 52.80% annual increase to 7,992 homes, while Los Angeles County maintains its substantial 47.13% jump to 13,695 active listings. San Diego County, despite its price resilience, shows a 66.34% year-over-year inventory increase with 5,664 homes available. This flood of new listings represents the highest inventory levels these markets have seen in several years, fundamentally altering the balance of power between buyers and sellers. The consistent month-over-month increases across all counties throughout the spring selling season indicate this trend is structural rather than seasonal, suggesting a permanent shift in market dynamics.
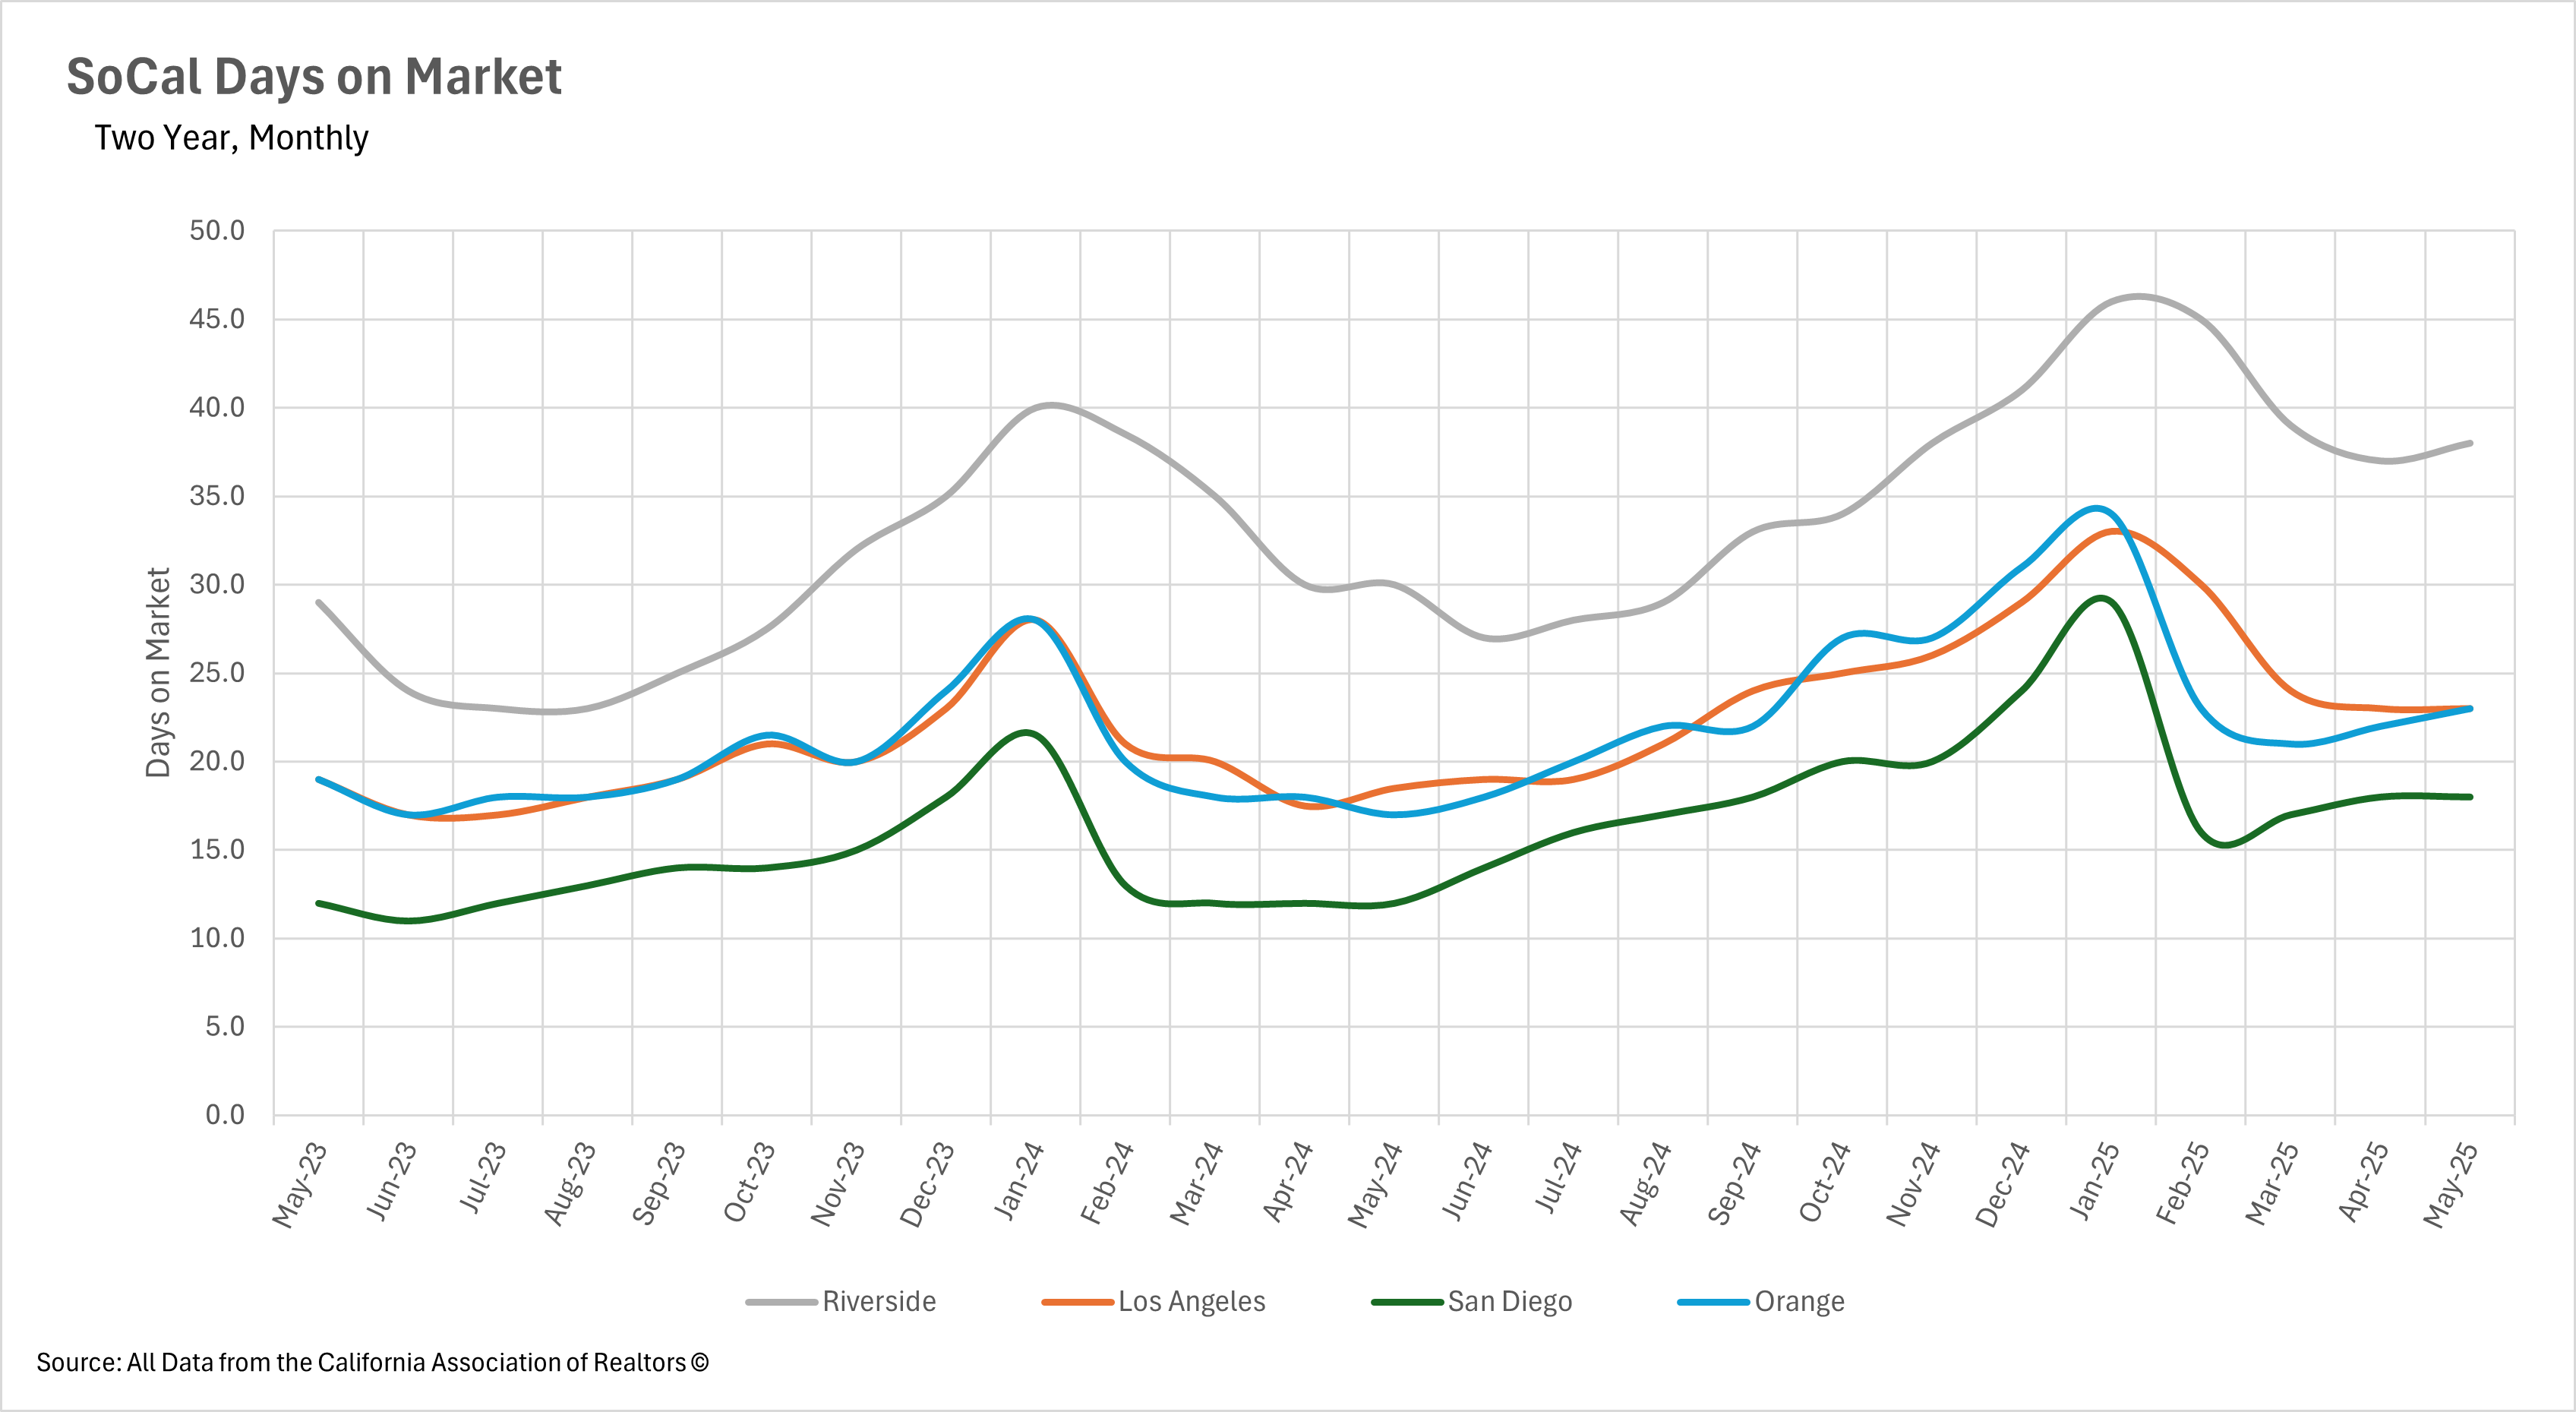
Despite the dramatic inventory increases, market timing metrics across Southern California are showing signs of stabilization, albeit at significantly elevated levels compared to last year. Los Angeles County has demonstrated the most stability, with homes spending exactly 23 days on market for two consecutive months, though this still represents a 24.32% increase from May 2024. Orange County has seen a slight acceleration in marketing time to 23 days, up 35.29% year-over-year, while San Diego County has maintained 18 days unchanged from April, though 50% higher than last year. Riverside County shows homes taking 38 days to sell in May, an 11.43% annual increase but with month-over-month improvements. This stabilization suggests that while the overall market has shifted dramatically from previous years' frenzied pace, well-priced properties are still finding buyers within reasonable timeframes, indicating that quality homes with appropriate pricing strategies continue to attract interest even in this buyer-favorable environment.
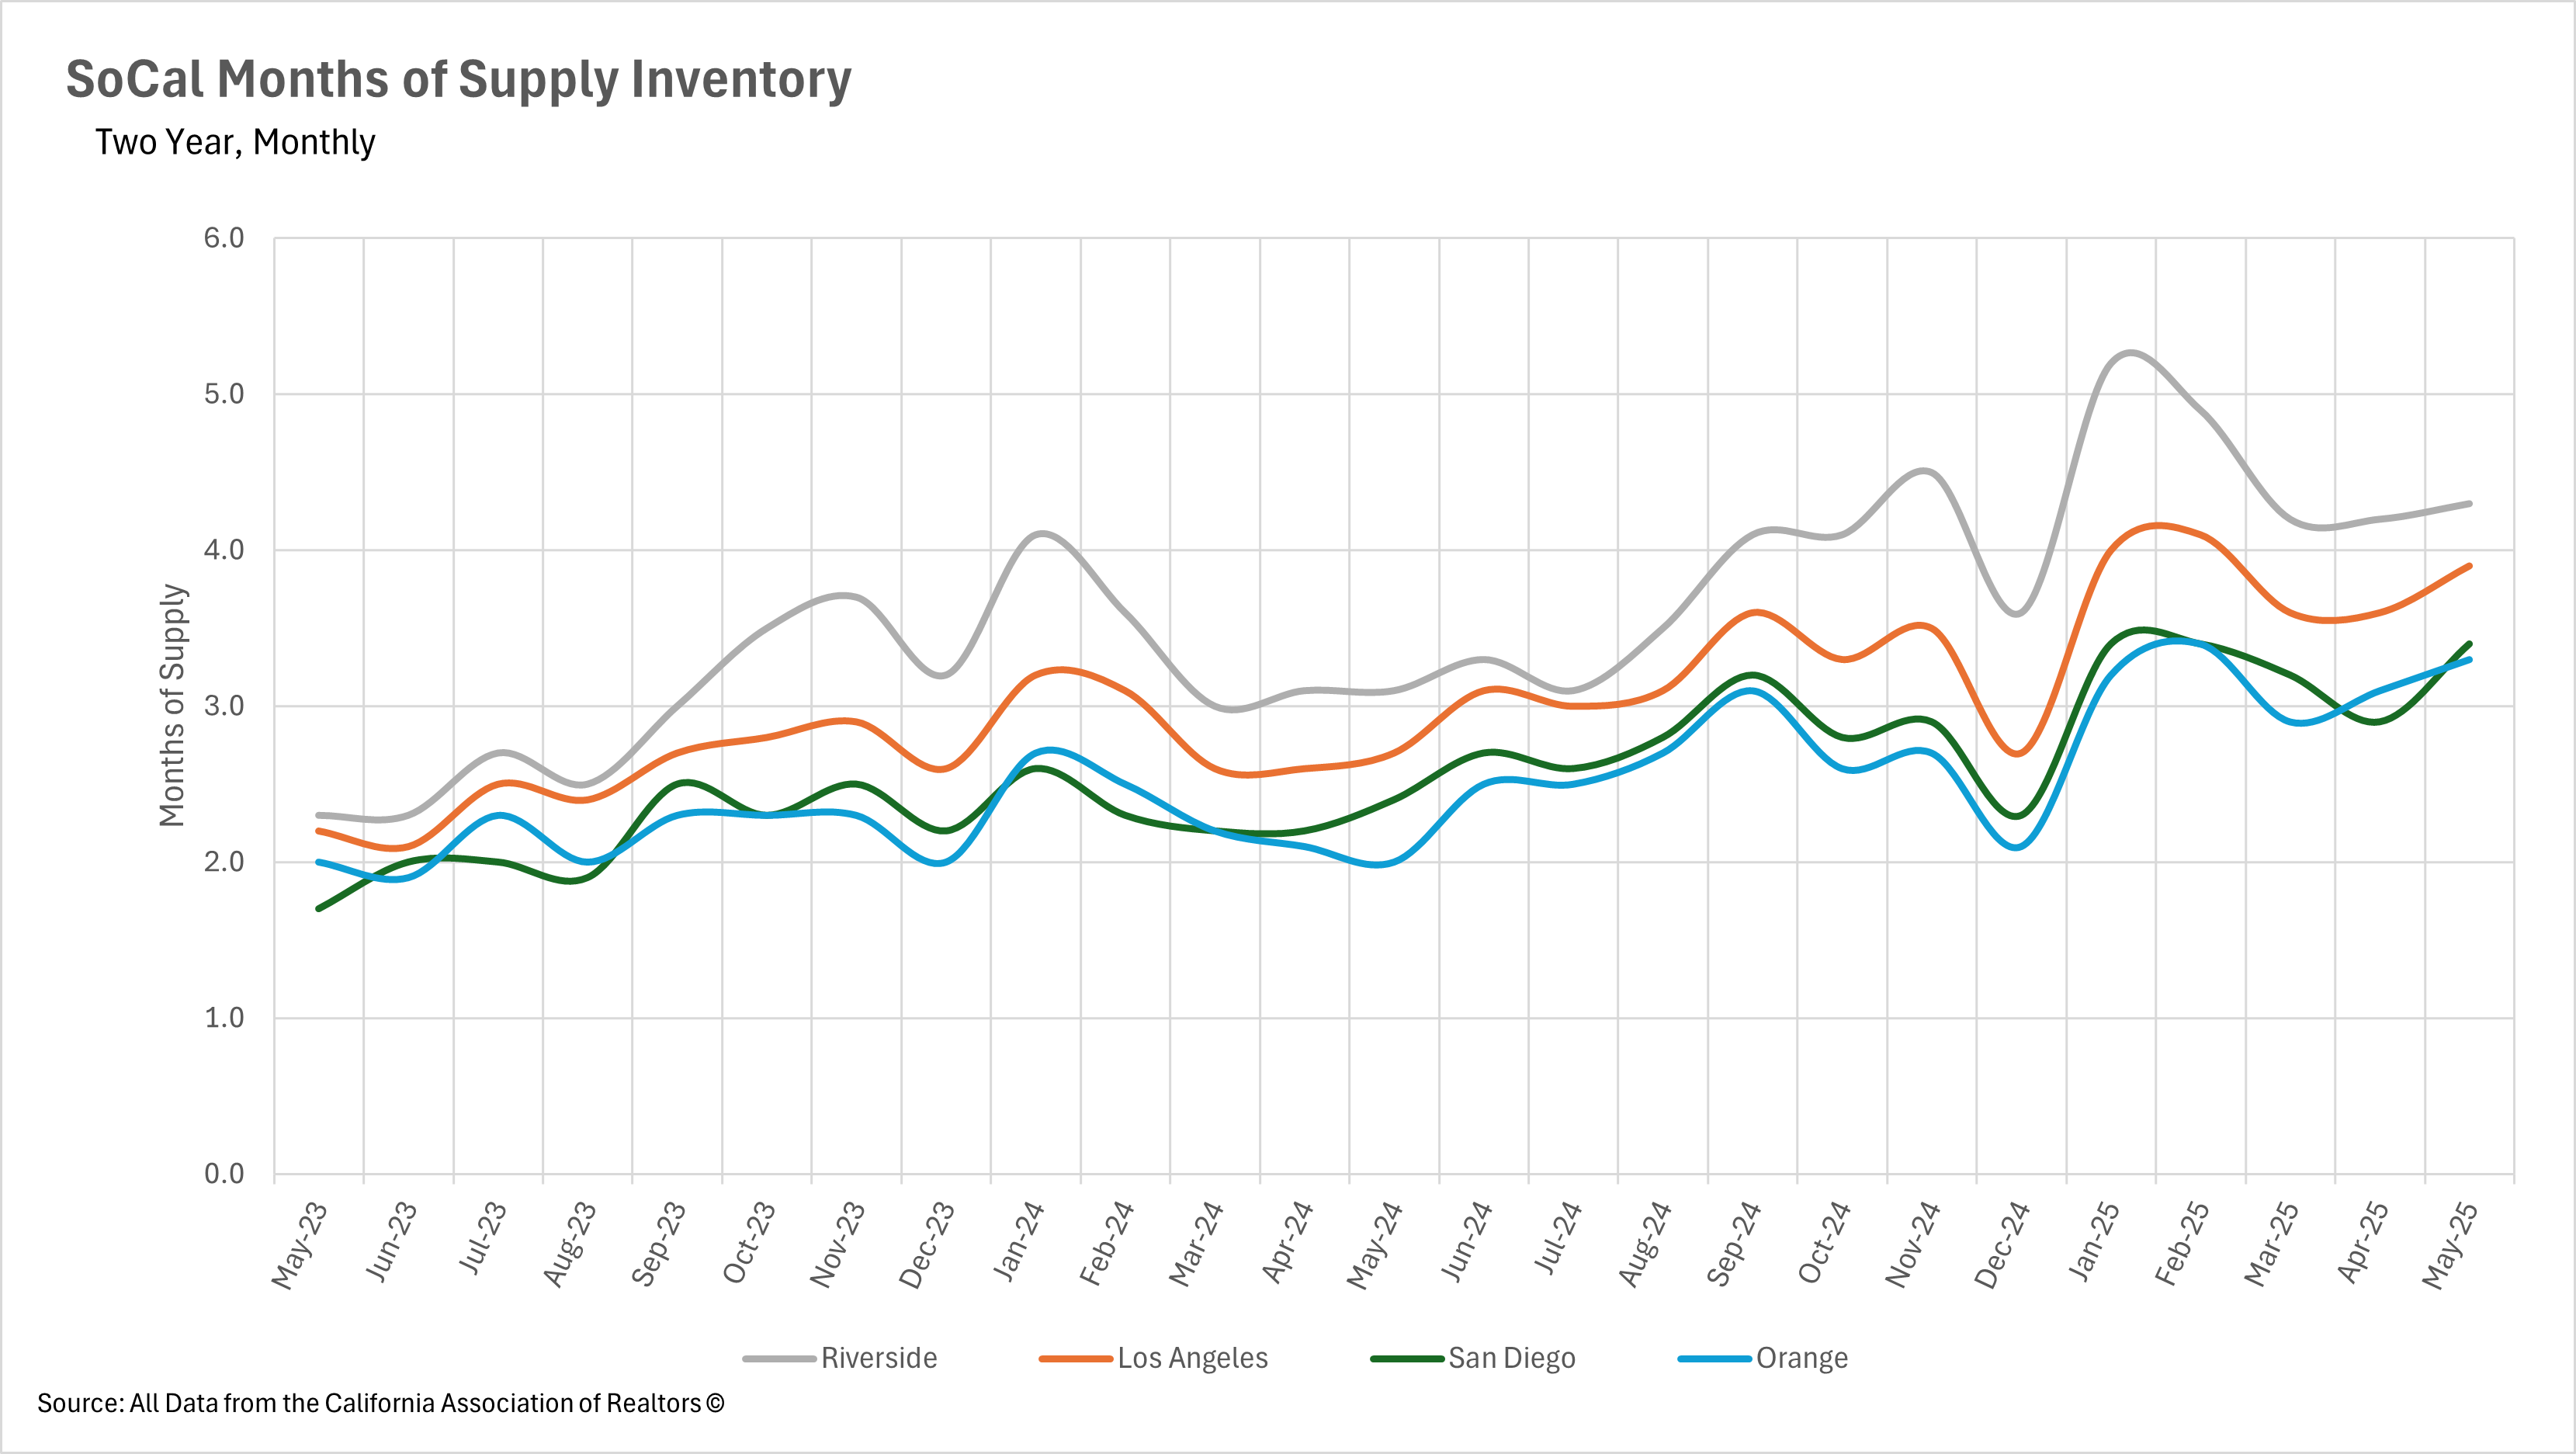
The most significant transformation in Southern California real estate is the complete establishment of buyer's market conditions across all major counties. When measuring Months of Supply Inventory (MSI)—with three months historically representing a balanced California market—every county now operates above this threshold. Riverside County maintains the strongest buyer's market position with 4.3 months of supply in May, followed by Los Angeles County which has deepened into buyer's territory at 3.9 months. San Diego County officially crossed into buyer's market status for the first time in years with 3.4 months in May, while Orange County established itself as a buyer's market at 3.3 months.
This represents a complete reversal from early 2024, when all counties strongly favored sellers with MSI readings typically below 2.5 months. The sustained higher inventory levels mean buyers now have unprecedented choice, time to make decisions, and negotiating leverage, while sellers must fundamentally adjust their strategies, pricing expectations, and timelines to succeed in this transformed market landscape where supply consistently outpaces current absorption rates.
Stay up to date on the latest real estate trends.
May 2026

April 2026
March 2026

February 2026
January 2026

Trusted Experts in the Palisades, Santa Monica, and Brentwood Real Estate Markets

How Sellers In Pacific Palisades, Santa Monica And Brentwood Get It Right

December 2025

November 2025
You’ve got questions and we can’t wait to answer them.