Market Update Los Angeles

Note: You can find the charts & graphs for the Big Story at the end of the following section.
*National Association of REALTORS® data is released two months behind, so we estimate the most recent month’s data when possible and appropriate.
Although we’re still at the point in the season where inventories are supposed to build, they have increased by nearly 20% on a year-over-year basis, from 1,110,000 to 1,330,000, showing that people are hesitant to purchase a new home. Additionally, while inventories have been increasing, the number of existing homes being sold has decreased slightly on a year-over-year basis, with March 2025 numbers coming in at 4,020,000, which is 2.43% lower than where they were last year. Across the country, people are becoming more uncertain of whether or not they should move to a new home, and that is very clearly showing!
This data is just for March though; it will be important to pay attention to how the market reacted to the beginning of the trade war when April’s numbers come out in a couple of weeks. While it’s easy to see how things like the stock market and bond market react to big newsworthy events like this, real estate is incredibly illiquid, so it takes some time for things to play out!
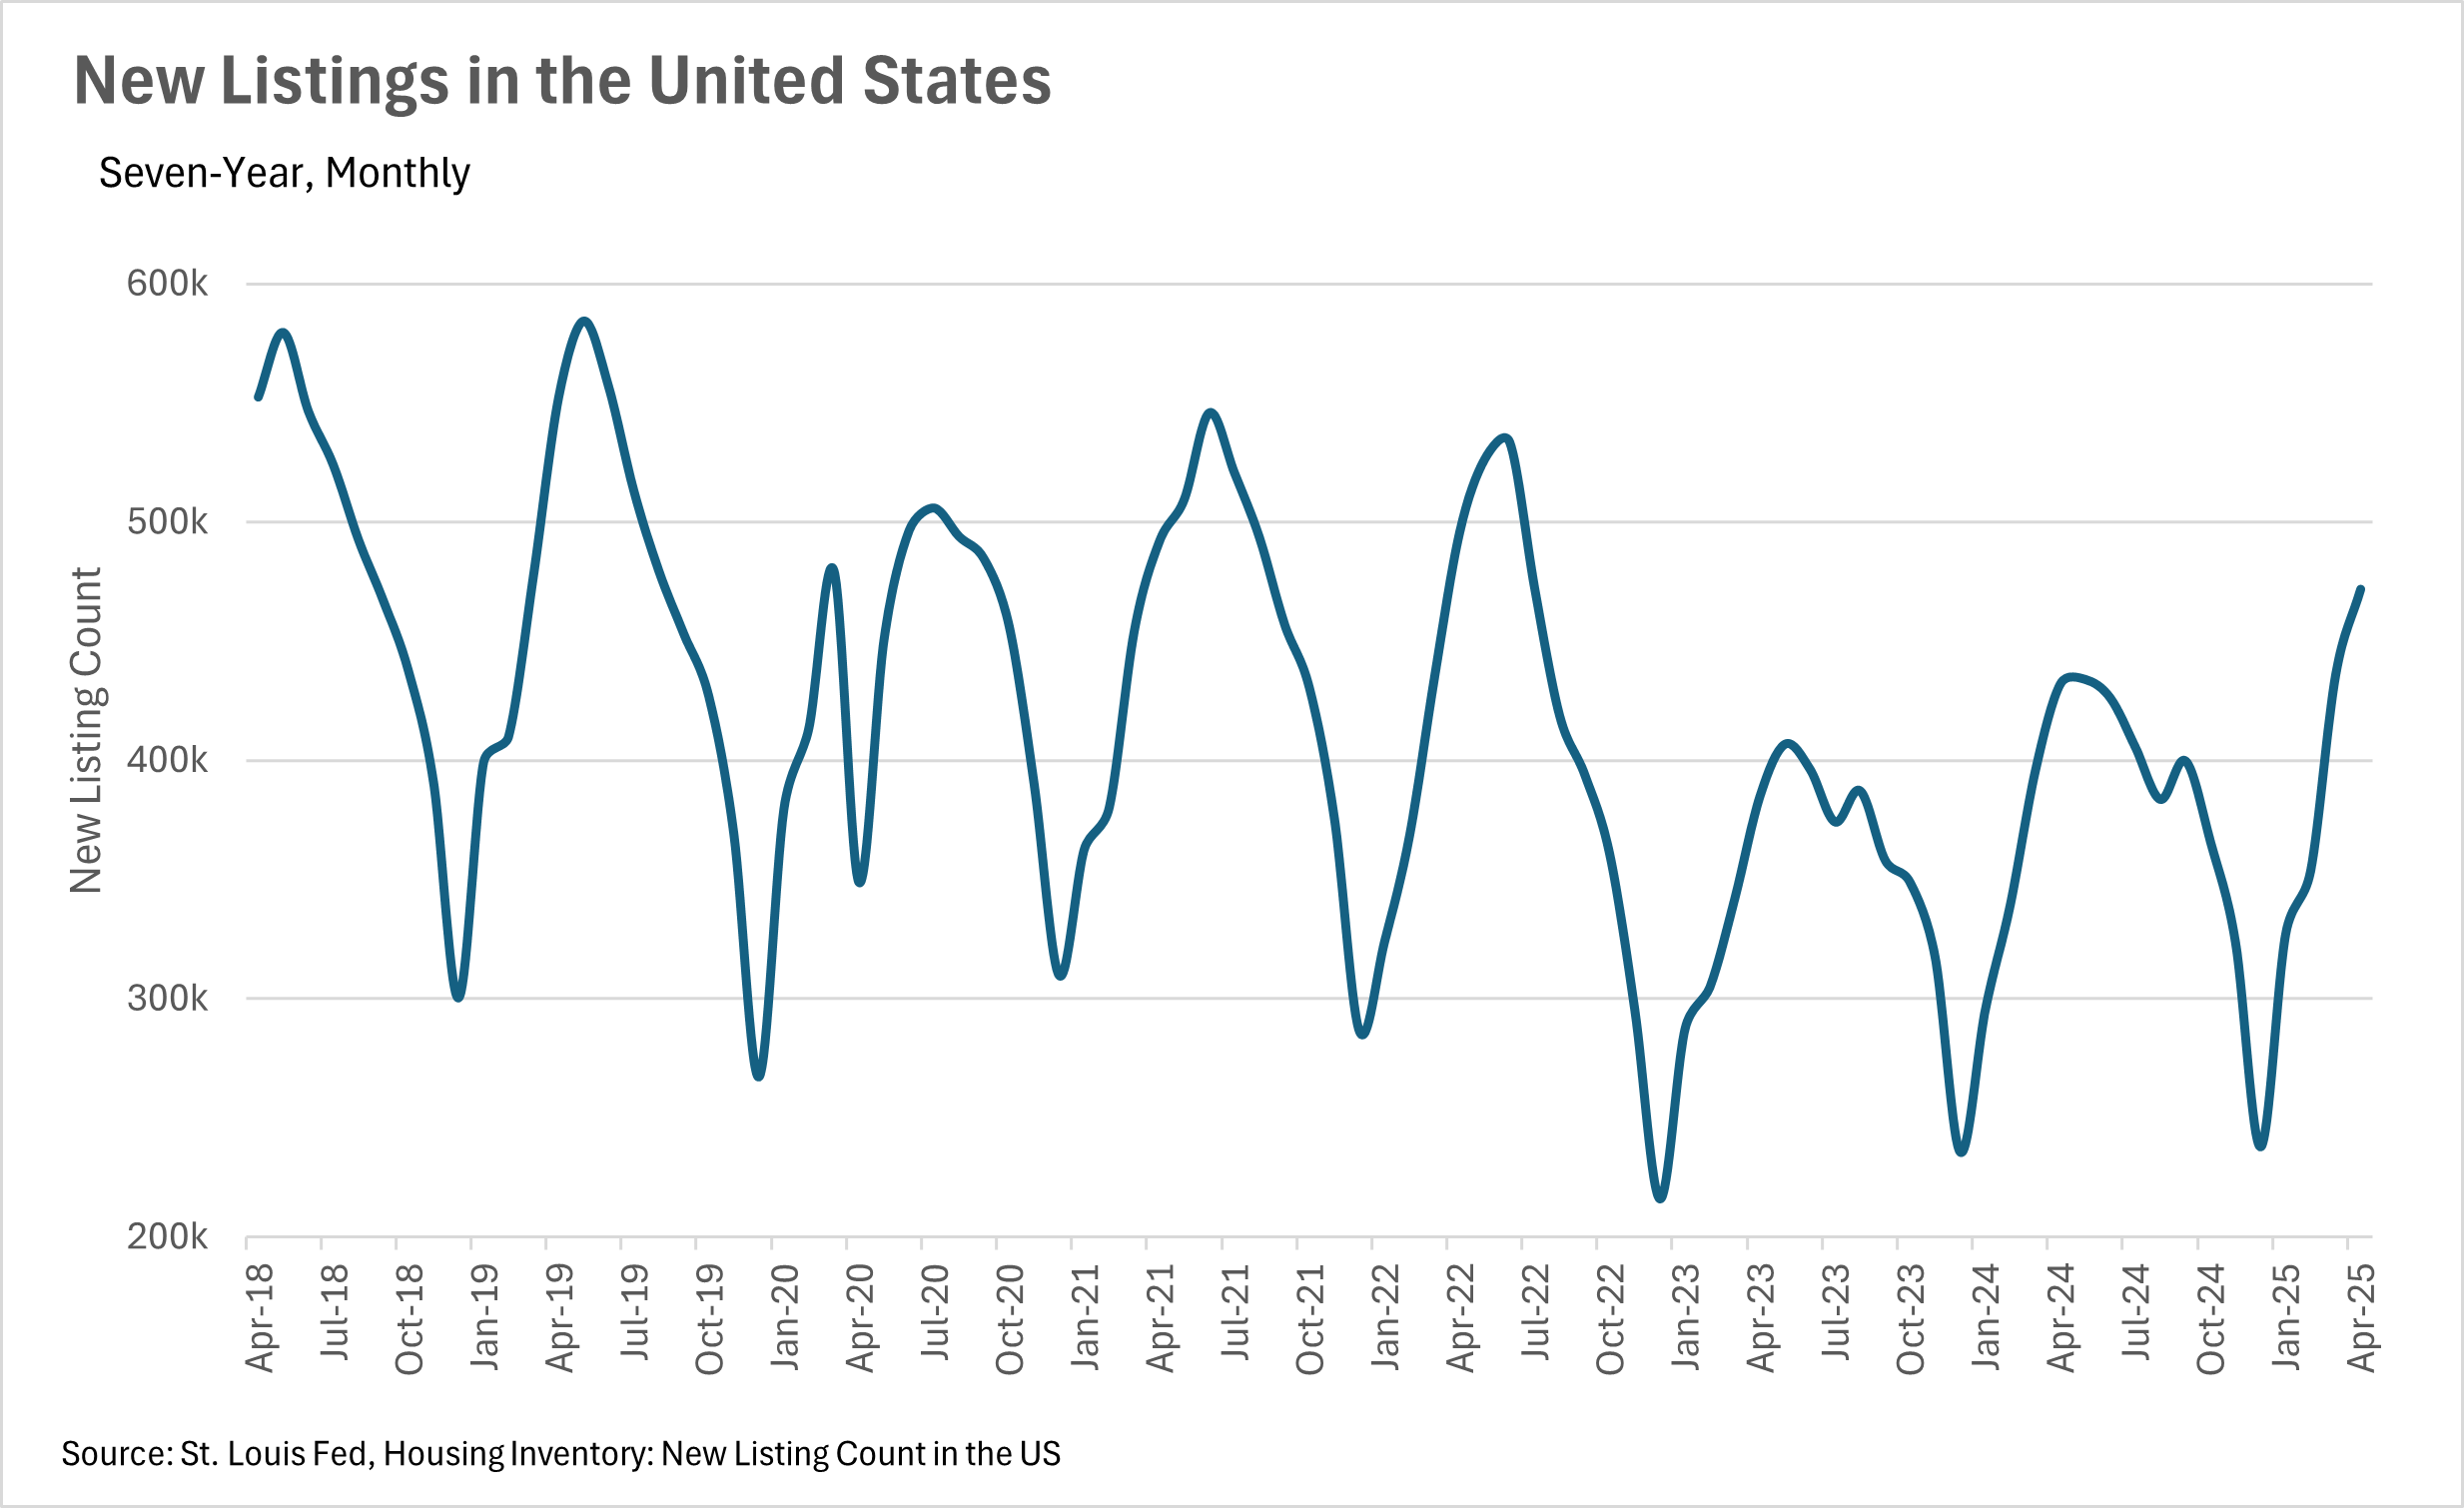
As you might have expected, there was a considerable increase in the number of listings that have hit the market too. For a few months in a row we have seen high single/low double-digit percentage growths in the number of new listings hitting the market in the US. This is likely due to the fact that the people who were holding out for the return of lower interest rates are losing hope, and listing their homes anyway.
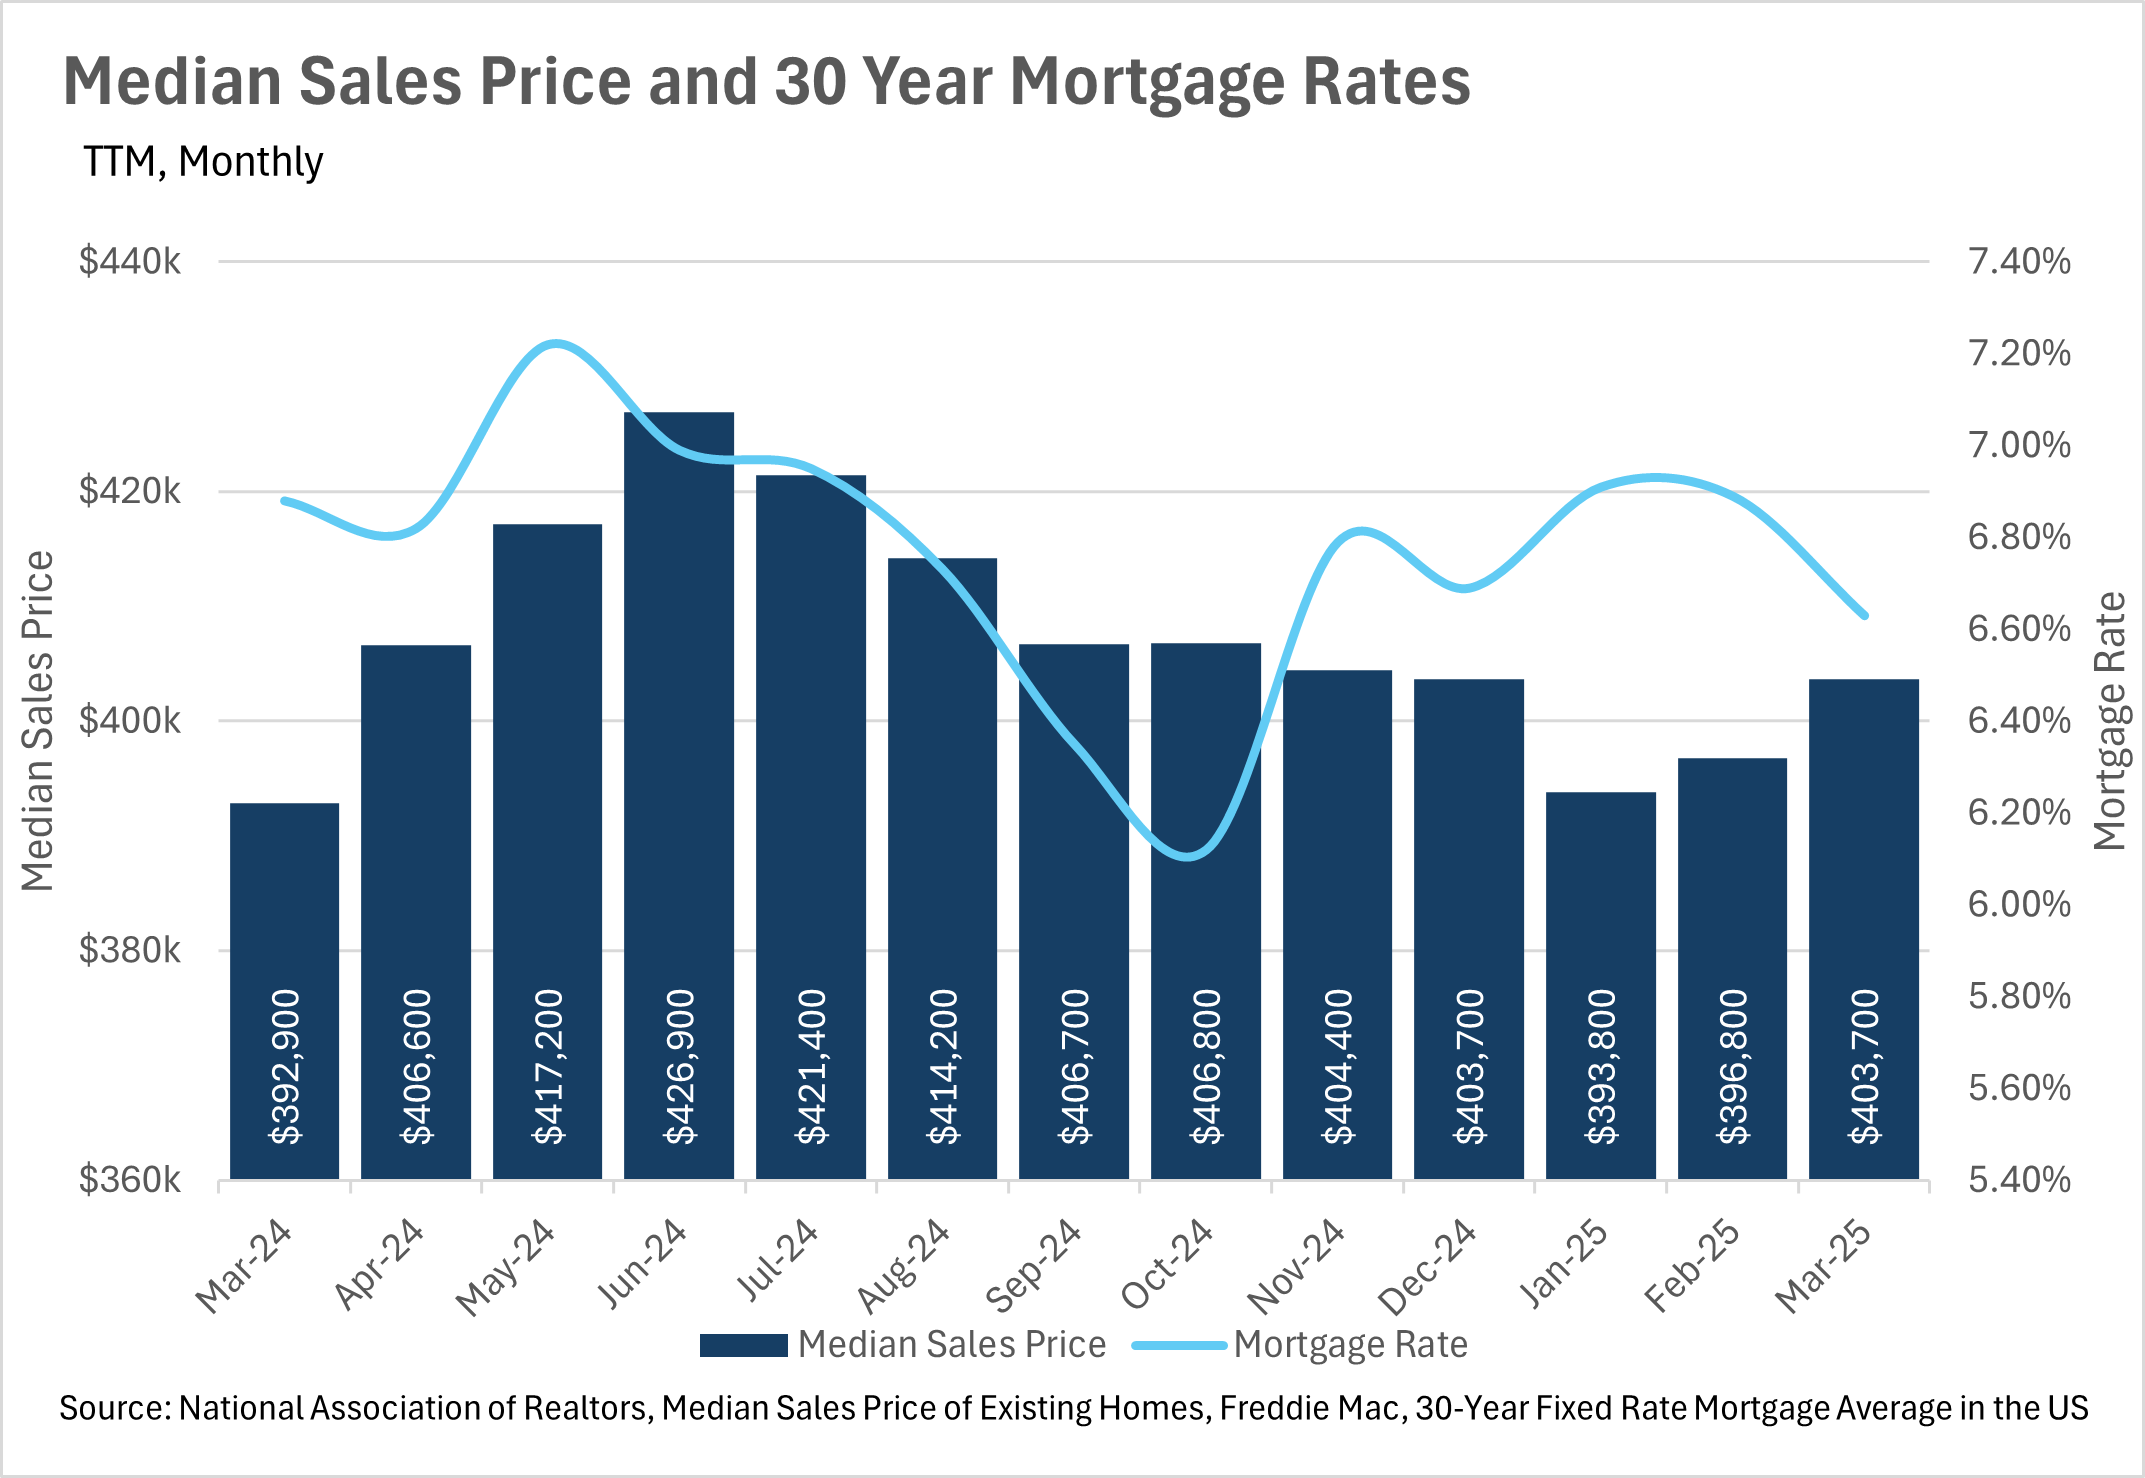
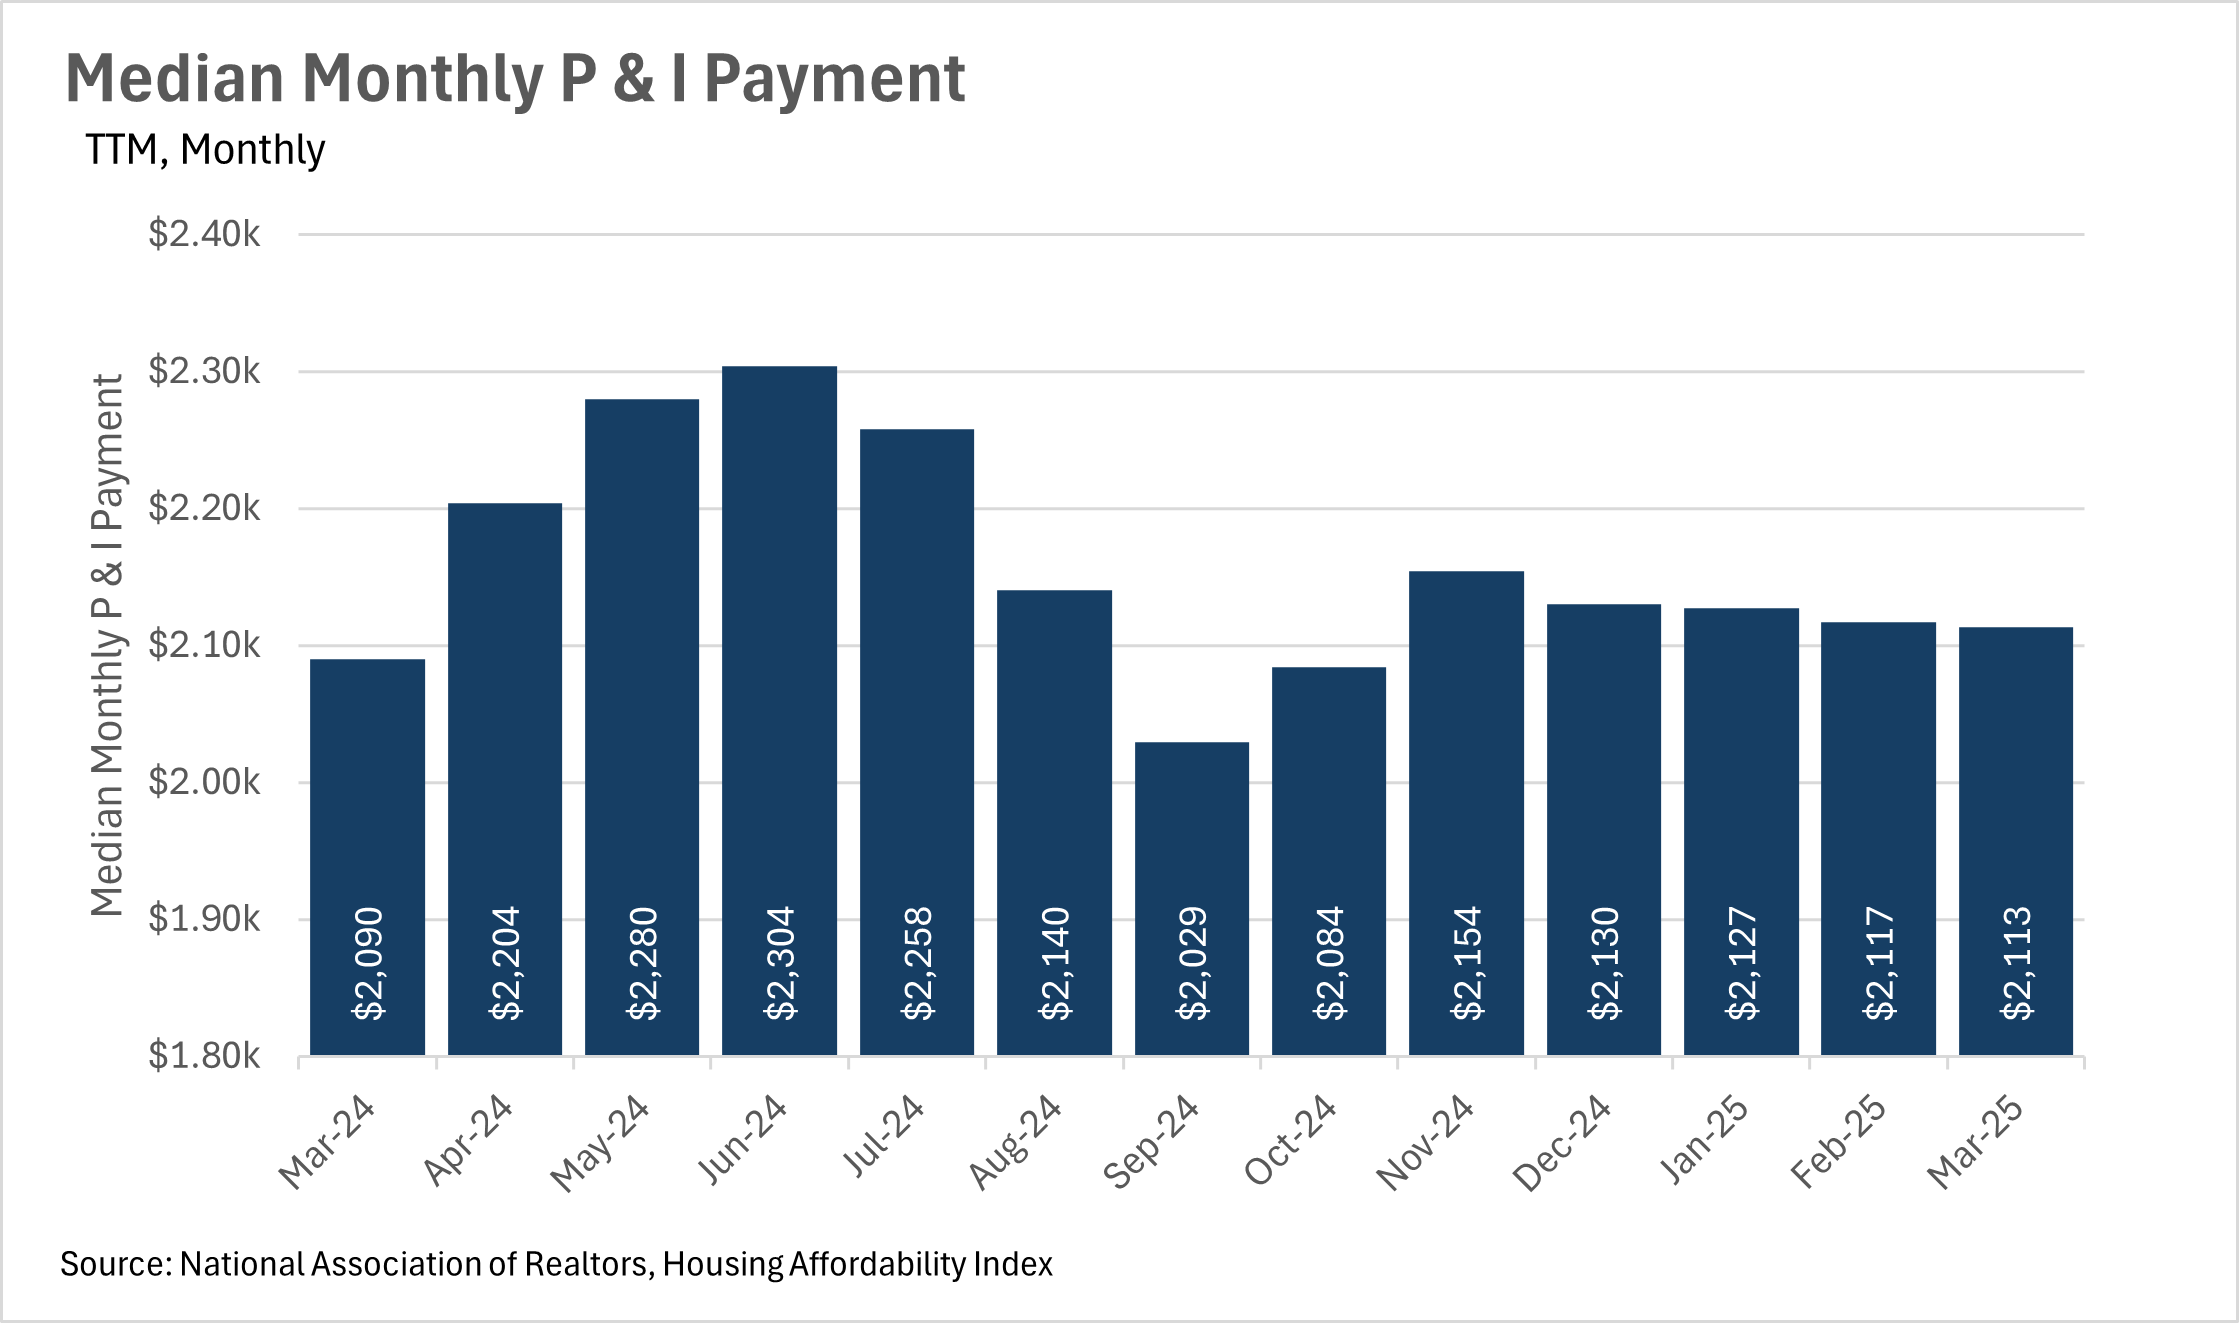
On the bright side, mortgage rates have continued their slow descent, with the average interest rate on a 30-year mortgage in March coming in at around 6.63%, down roughly a quarter point from the year prior. As you might expect, the median monthly P&I payment ticked down slightly, and the median sale price ticked up slightly to match this move.
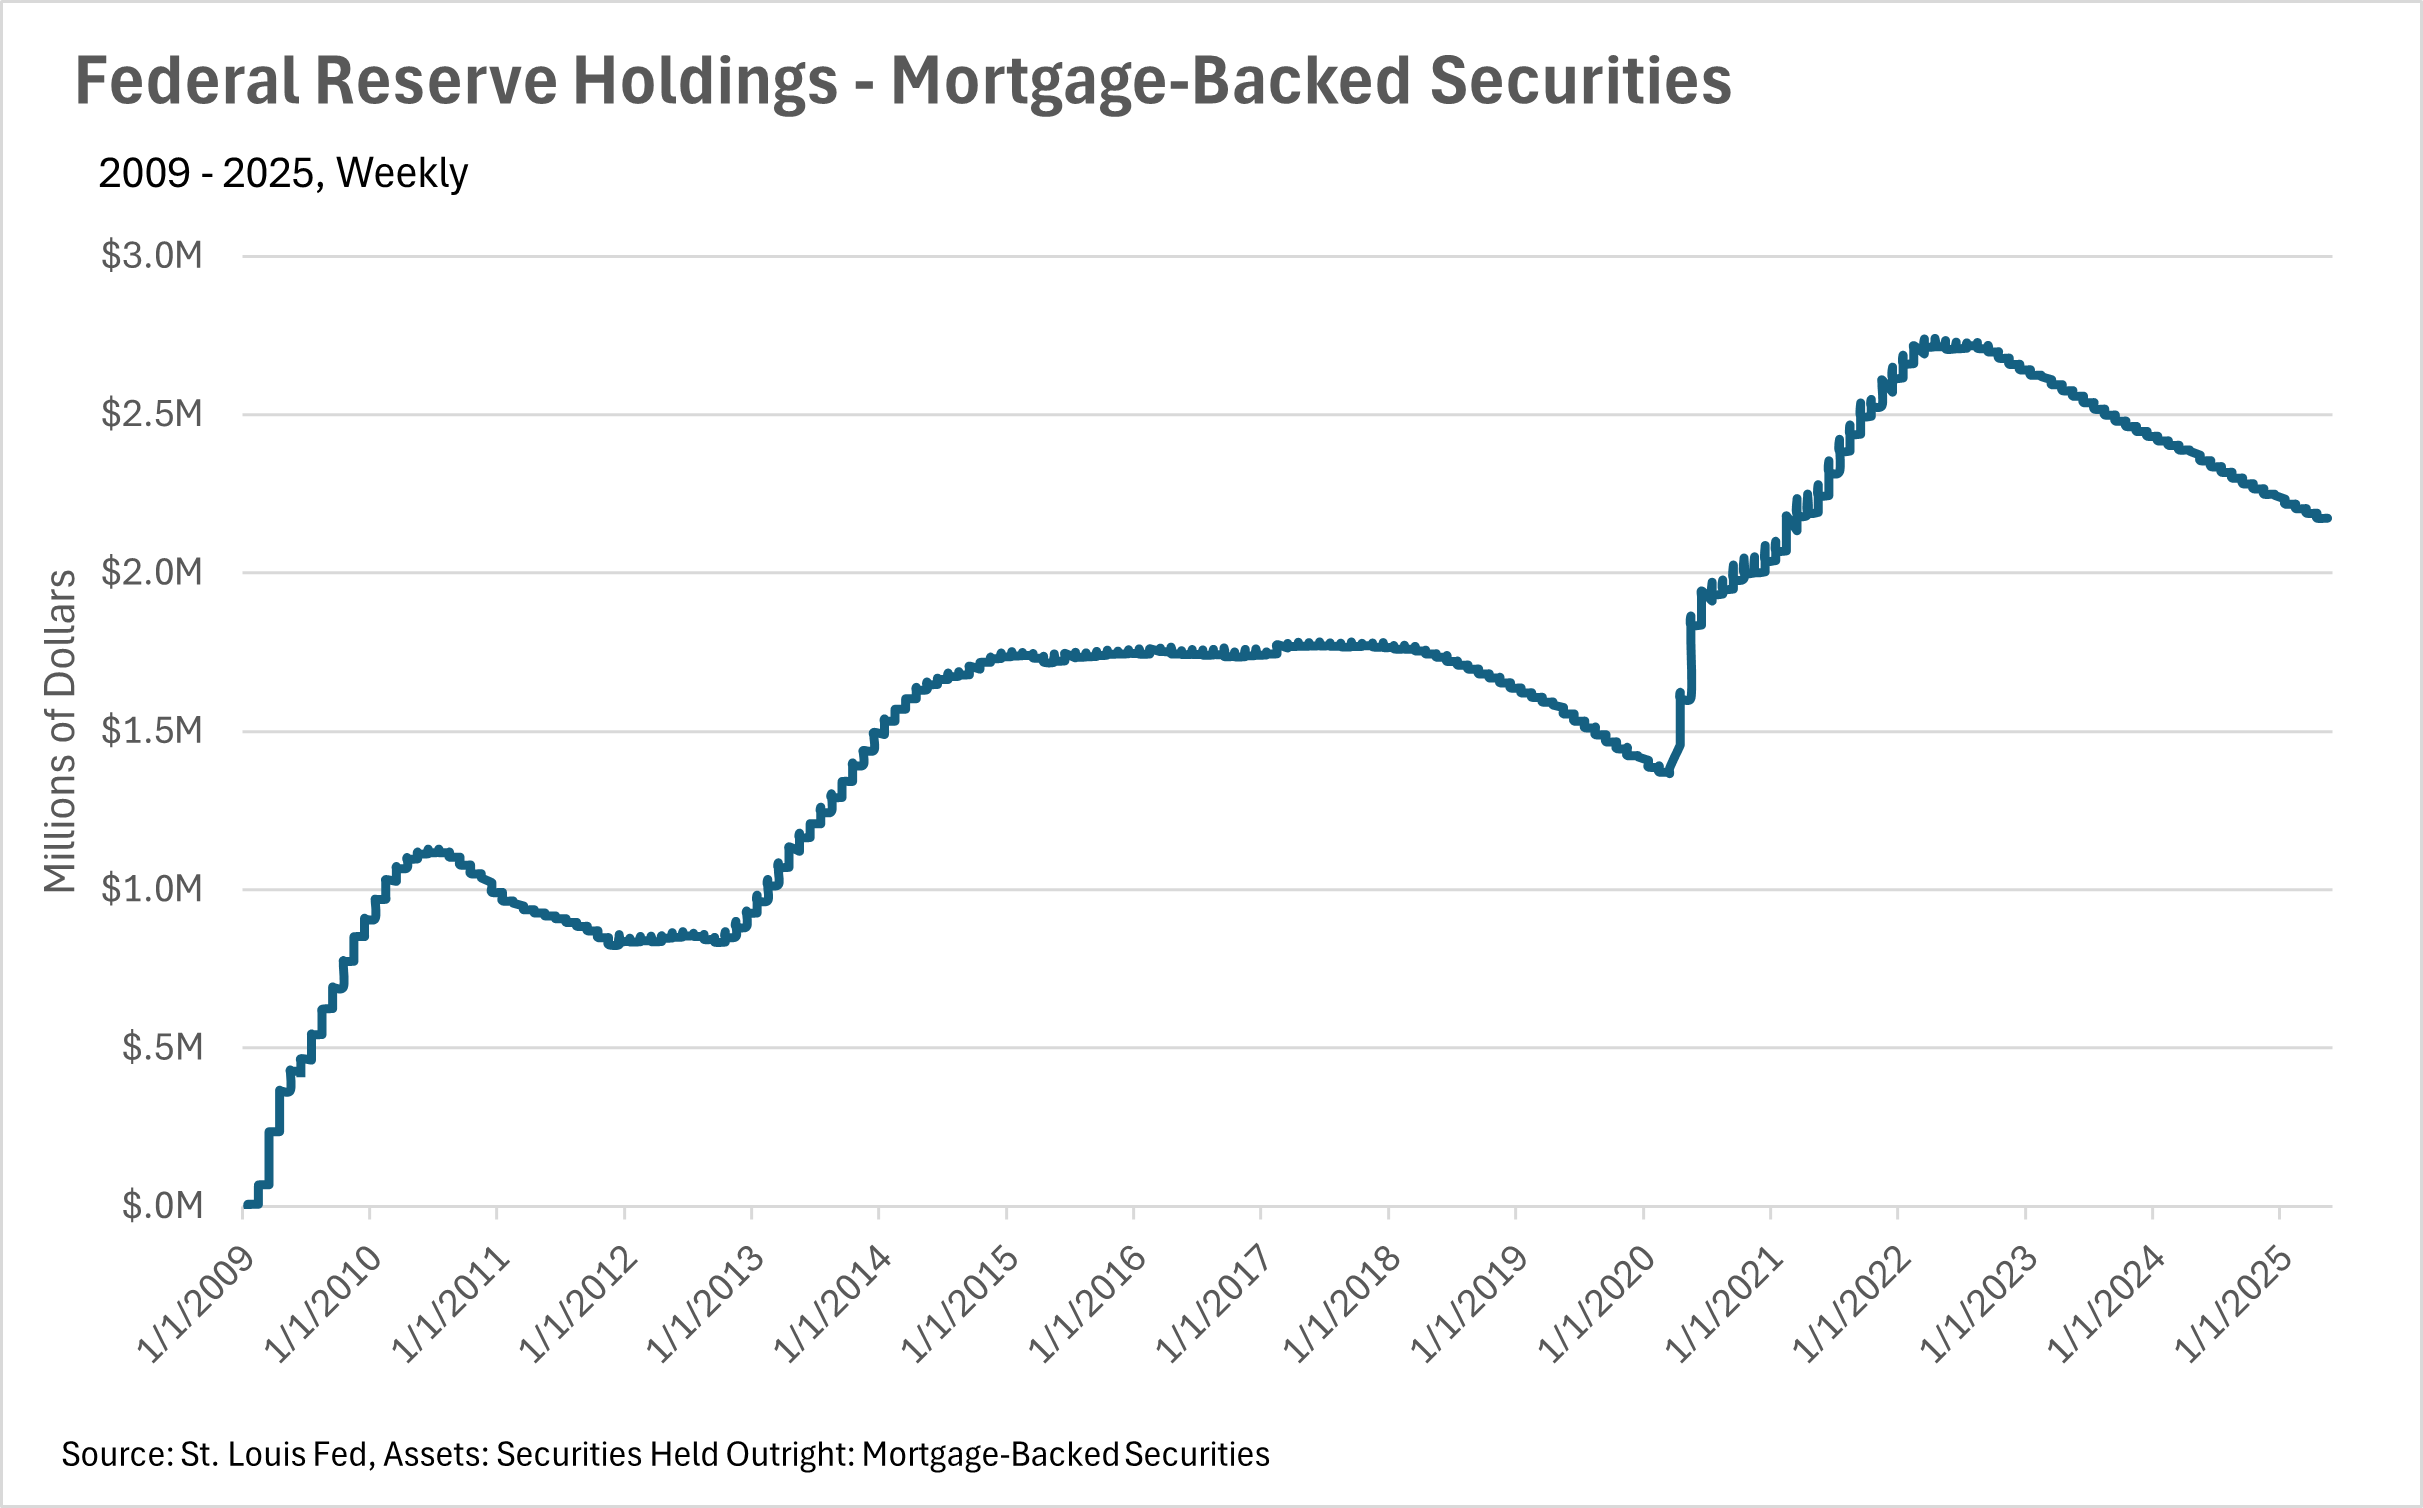
Although mortgage rates have come down a bit, it’s important to remember that the biggest drivers behind mortgage rates are, of course, the 10-year treasury and the federal funds rate. In the most recent Federal Open Market Committee meeting, the Fed has decided to keep the federal funds rate in line with where it’s been over the past few months, despite many Americans feeling the effects of the trade war on their wallets.
As we have discussed in prior months, the Fed is in no rush to lower interest rates anytime soon. However, they do see a not-so-distant future where rates are a good bit lower. When you combine this with the fact that inventories are building at a rapid rate, and the number of units being sold has fallen slightly, this could represent a fantastic buying opportunity!
Ultimately though, this is just what we’re seeing at a national level. As we all know, real estate is an incredibly localized industry, so knowing what’s going on in your own market is pivotal. Below is our local lowdown, that outlines everything you need to know about what’s happening around you in your neighborhood and surrounding areas!

Note: You can find the charts/graphs for the Local Lowdown at the end of this section.
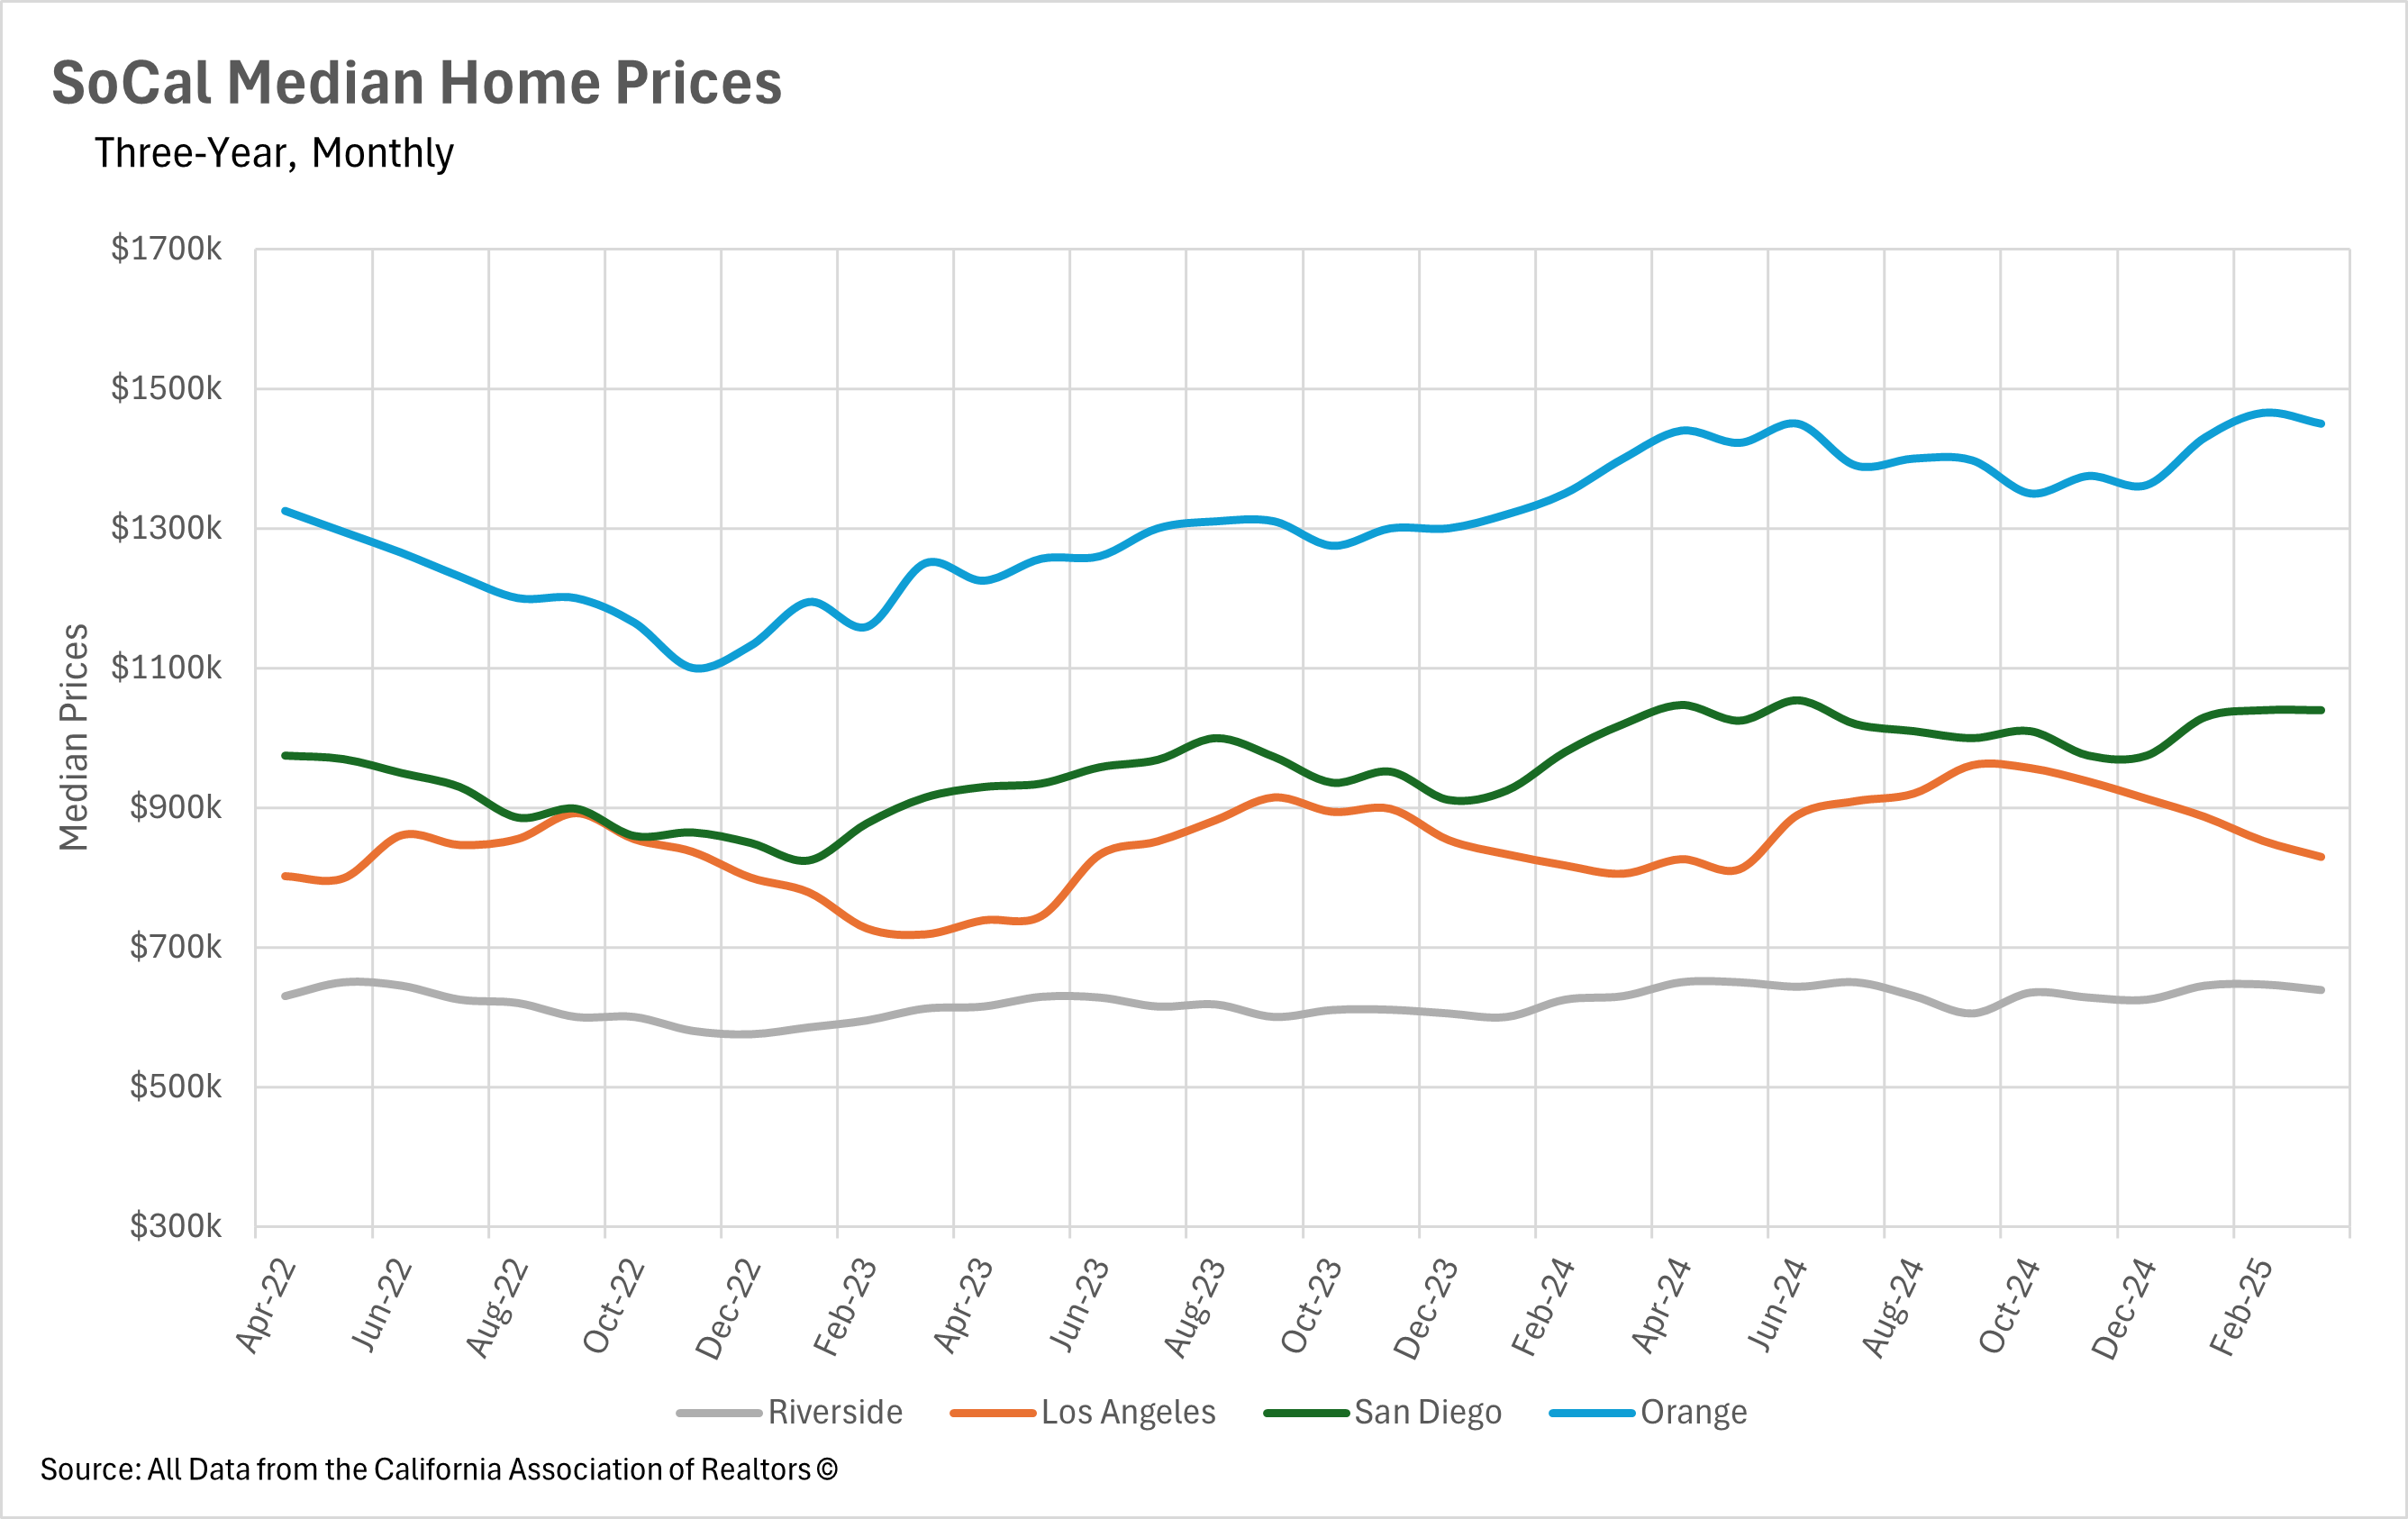
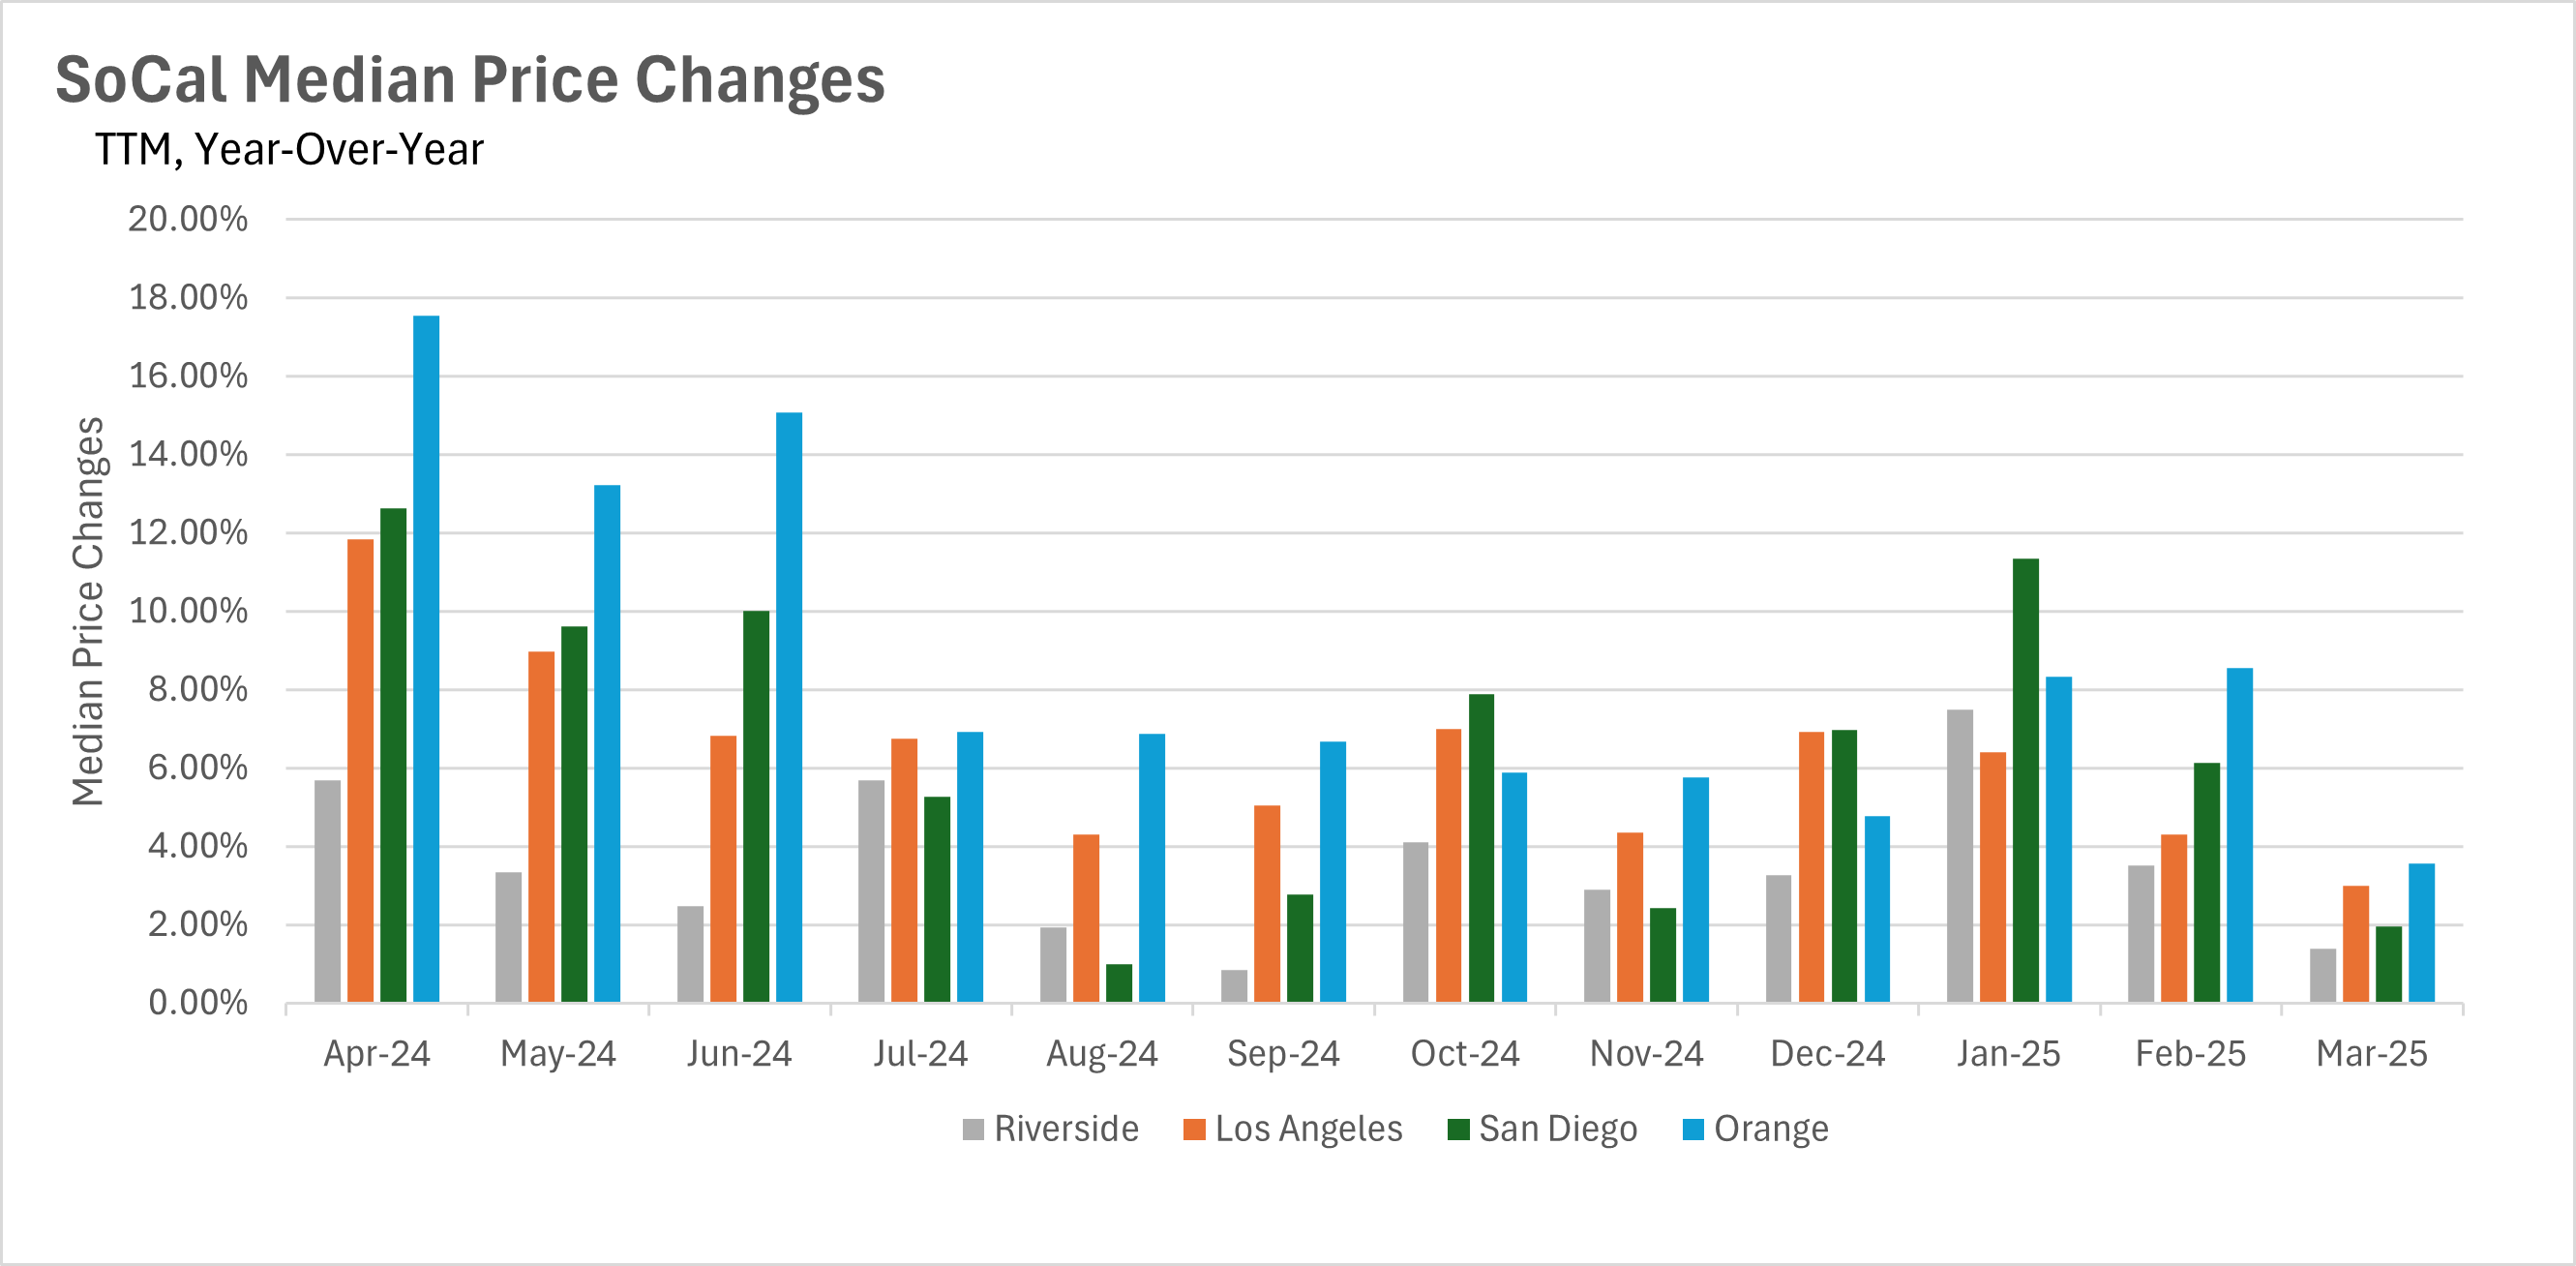
Southern California's real estate market is showing clear signs of cooling after a prolonged period of robust growth. By March 2025, all counties in the region experienced a significant deceleration in price appreciation. Los Angeles County saw median prices increase by just 3.00% year-over-year to $829,260, down from February's 4.29%. Orange County followed a similar pattern with a 3.57% annual gain to $1,450,000, dramatically below February's 8.56% increase. San Diego County experienced the most notable slowdown, with prices gaining just 1.96% to $1,040,000 compared to February's 6.12% growth. Riverside County maintained the most consistent growth at 3.57%. Despite this widespread moderation, it's significant that all markets continue to show positive year-over-year growth, even as inventory levels reach multi-year highs and market balance shifts decidedly toward buyers.
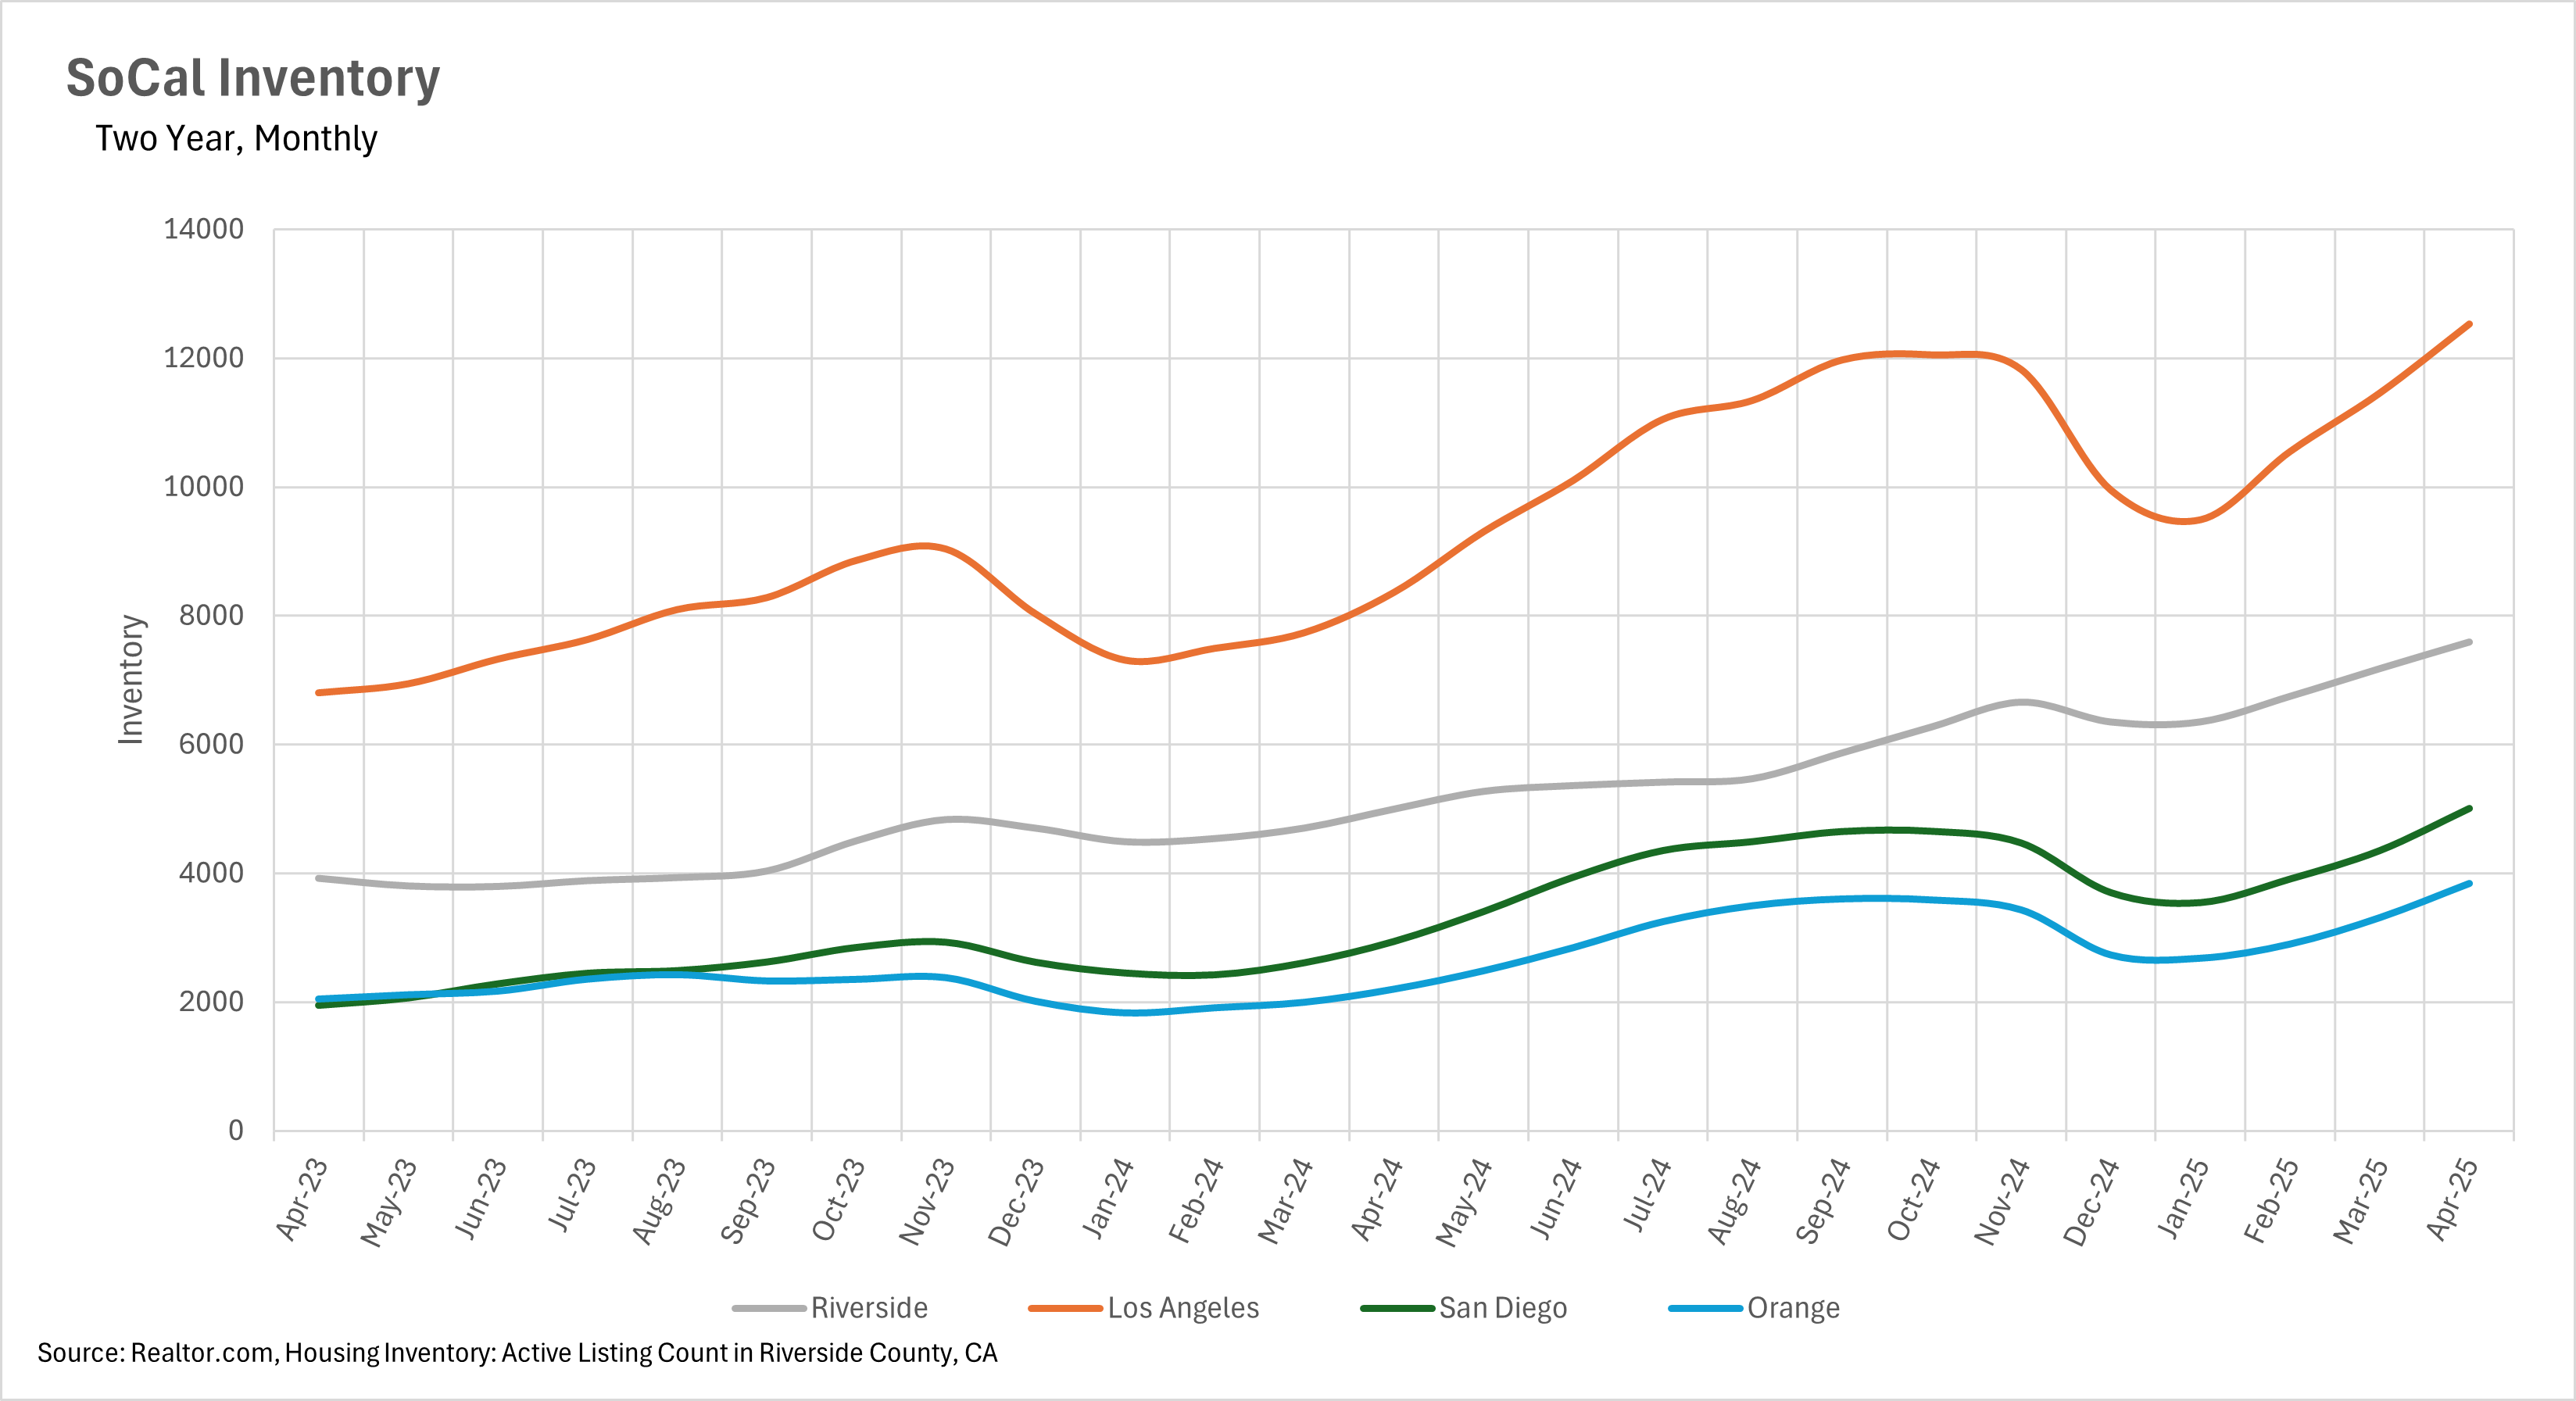
The Southern California real estate landscape has been transformed by an unprecedented surge in available homes. Orange County led this trend with a remarkable 74.68% year-over-year increase in active listings for March 2025, with inventory continuing to build through April. Los Angeles County followed closely with a 49.83% annual increase, while Riverside County saw inventory jump 48.82% compared to the previous year. San Diego County didn't report a March percentage increase but showed continuing inventory growth with April's figures reaching 5,004 available homes, representing a 15% month-over-month increase. This extraordinary growth in options for buyers has fundamentally altered the negotiating landscape throughout Southern California, giving purchasers significantly more leverage than they've had in several years. The consistent month-over-month increases observed across all counties suggest this trend will likely continue through the traditionally busy spring and summer seasons.
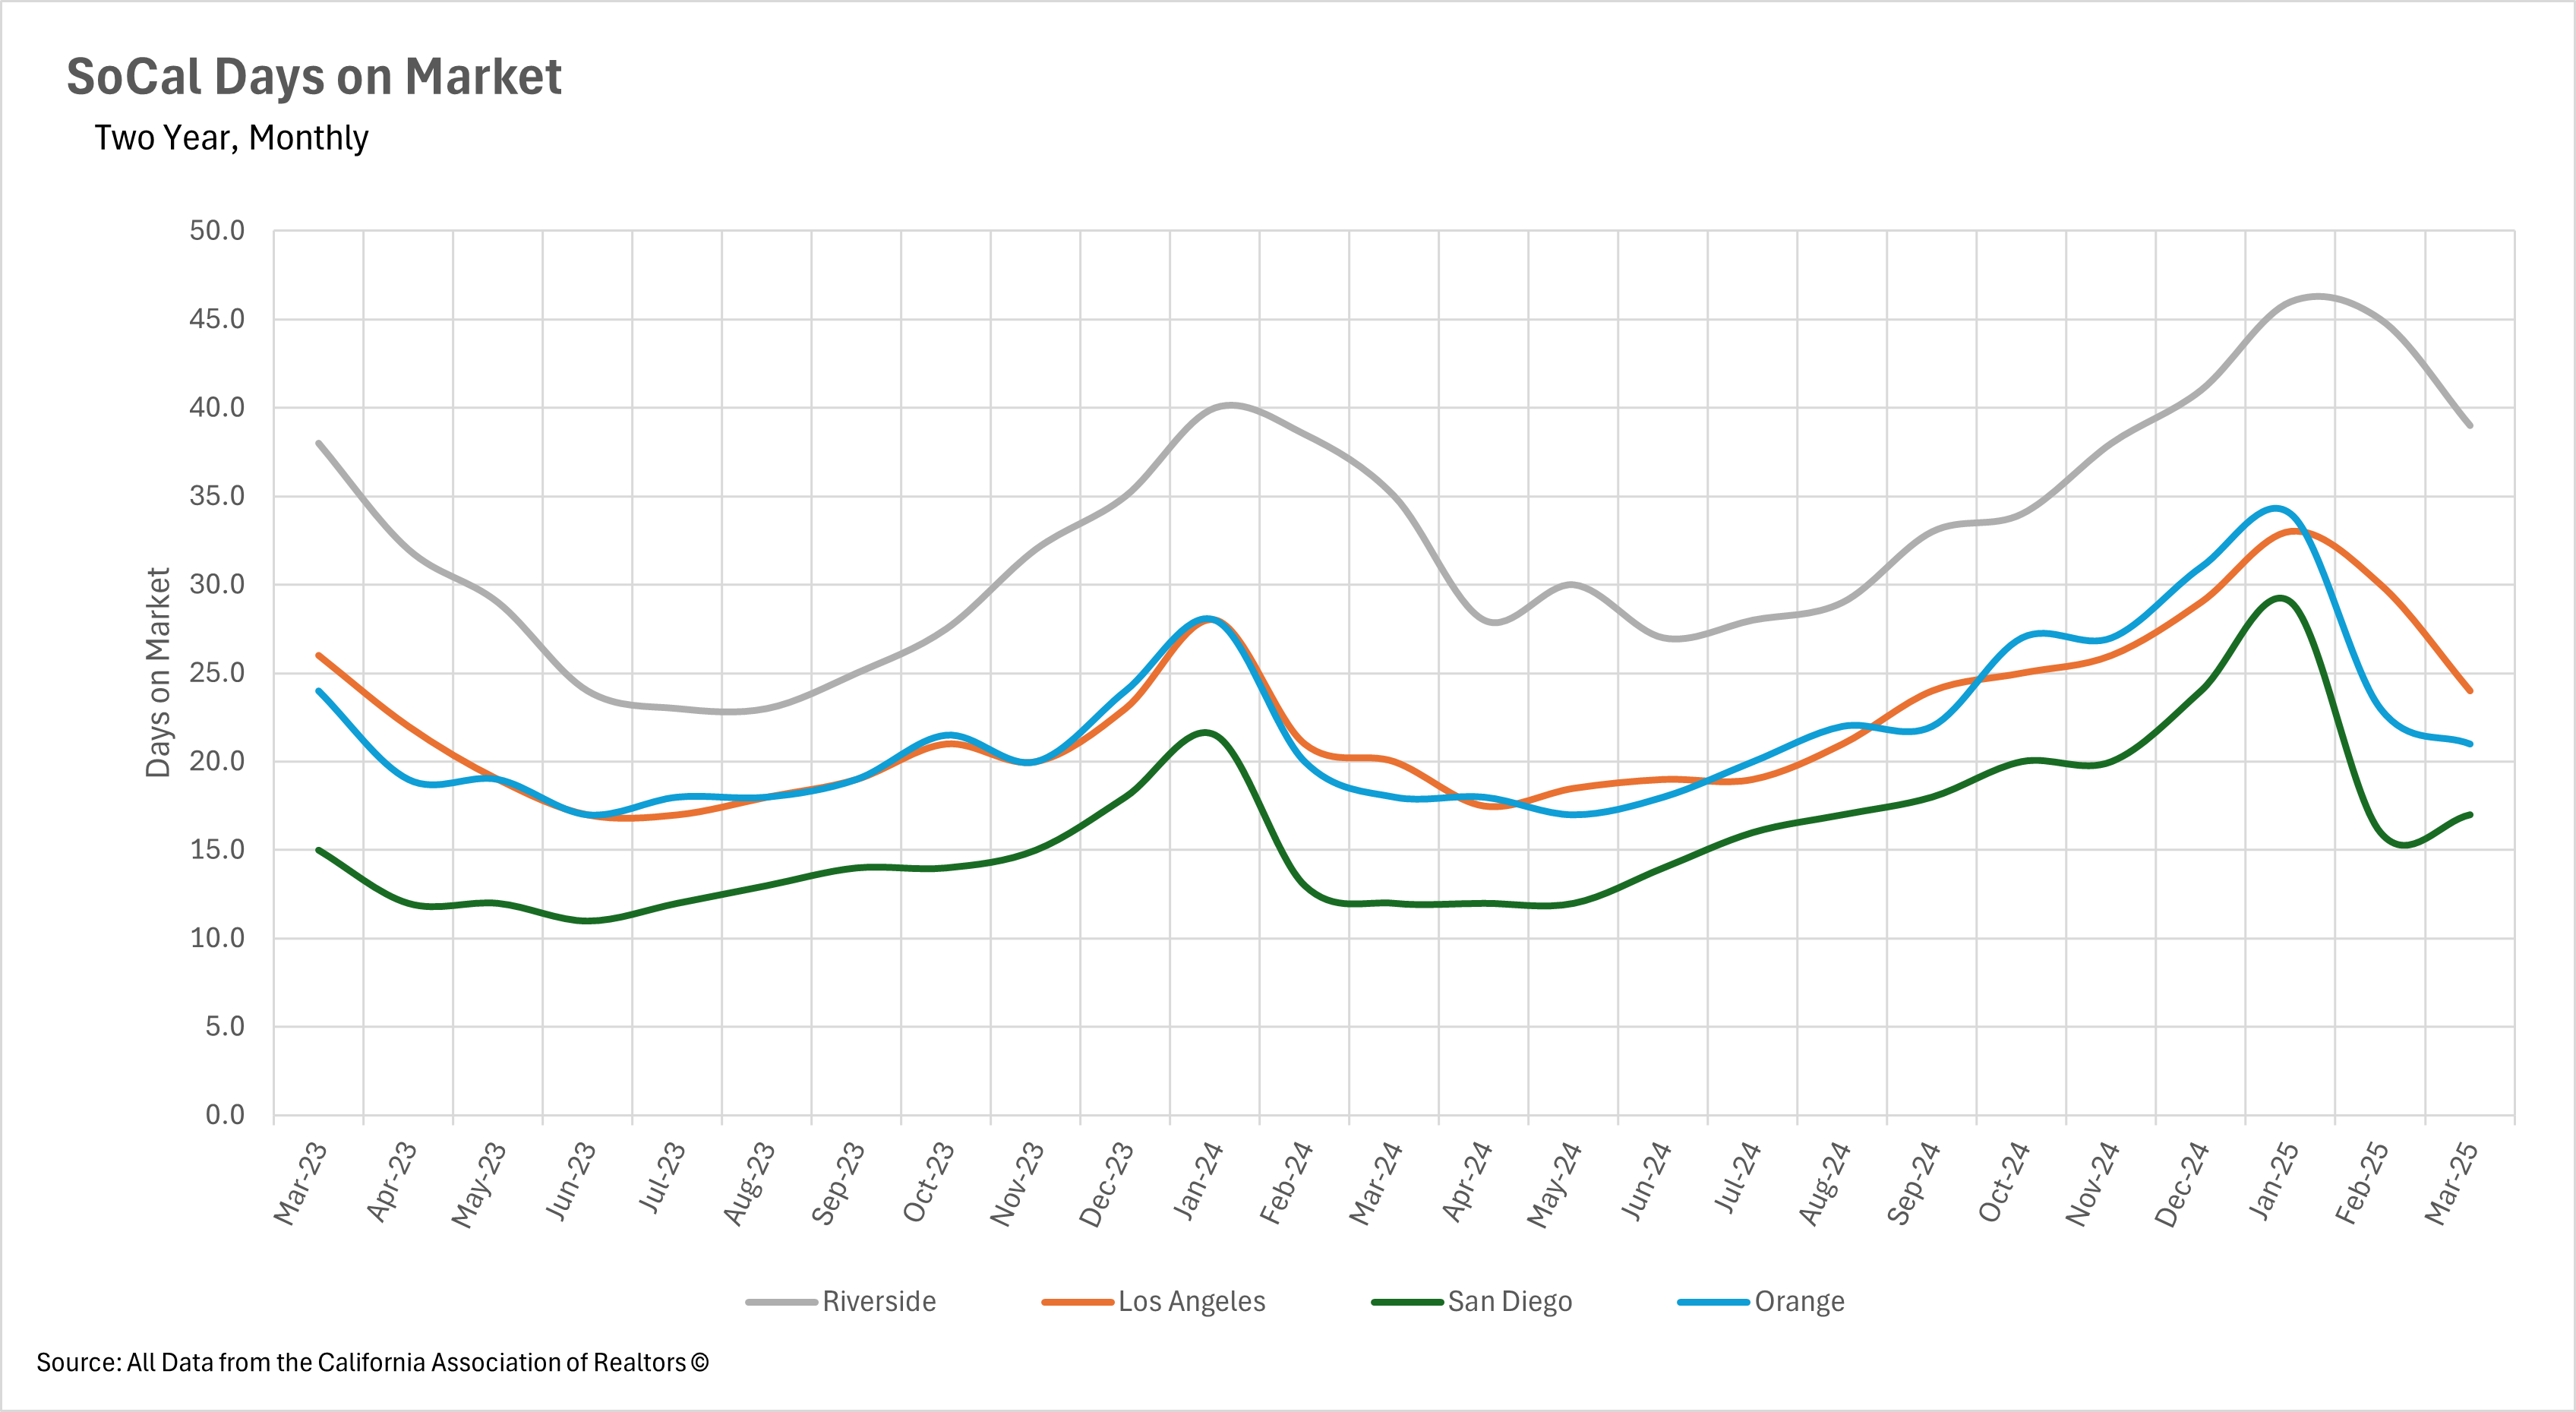
Despite year-over-year increases in marketing time across all counties, March 2025 showed some encouraging signs of seasonal acceleration in most markets. San Diego homes took a median of 17 days to sell, up 41.67% from March 2024 but only slightly higher than February's 16 days. Los Angeles County saw the most dramatic improvement, with days on market dropping to 24 in March from 30 in February, though still 20% higher than last year. Orange County listings spent a median of 21 days on market, improving from February's 23 days but remaining 16.67% higher year-over-year. Only Riverside bucked this trend, with homes taking 39 days to sell in March, representing a 15% increase from the previous year. These month-over-month improvements suggest that well-priced properties are still attracting buyer interest, even as the overall market has slowed considerably from last year's pace.
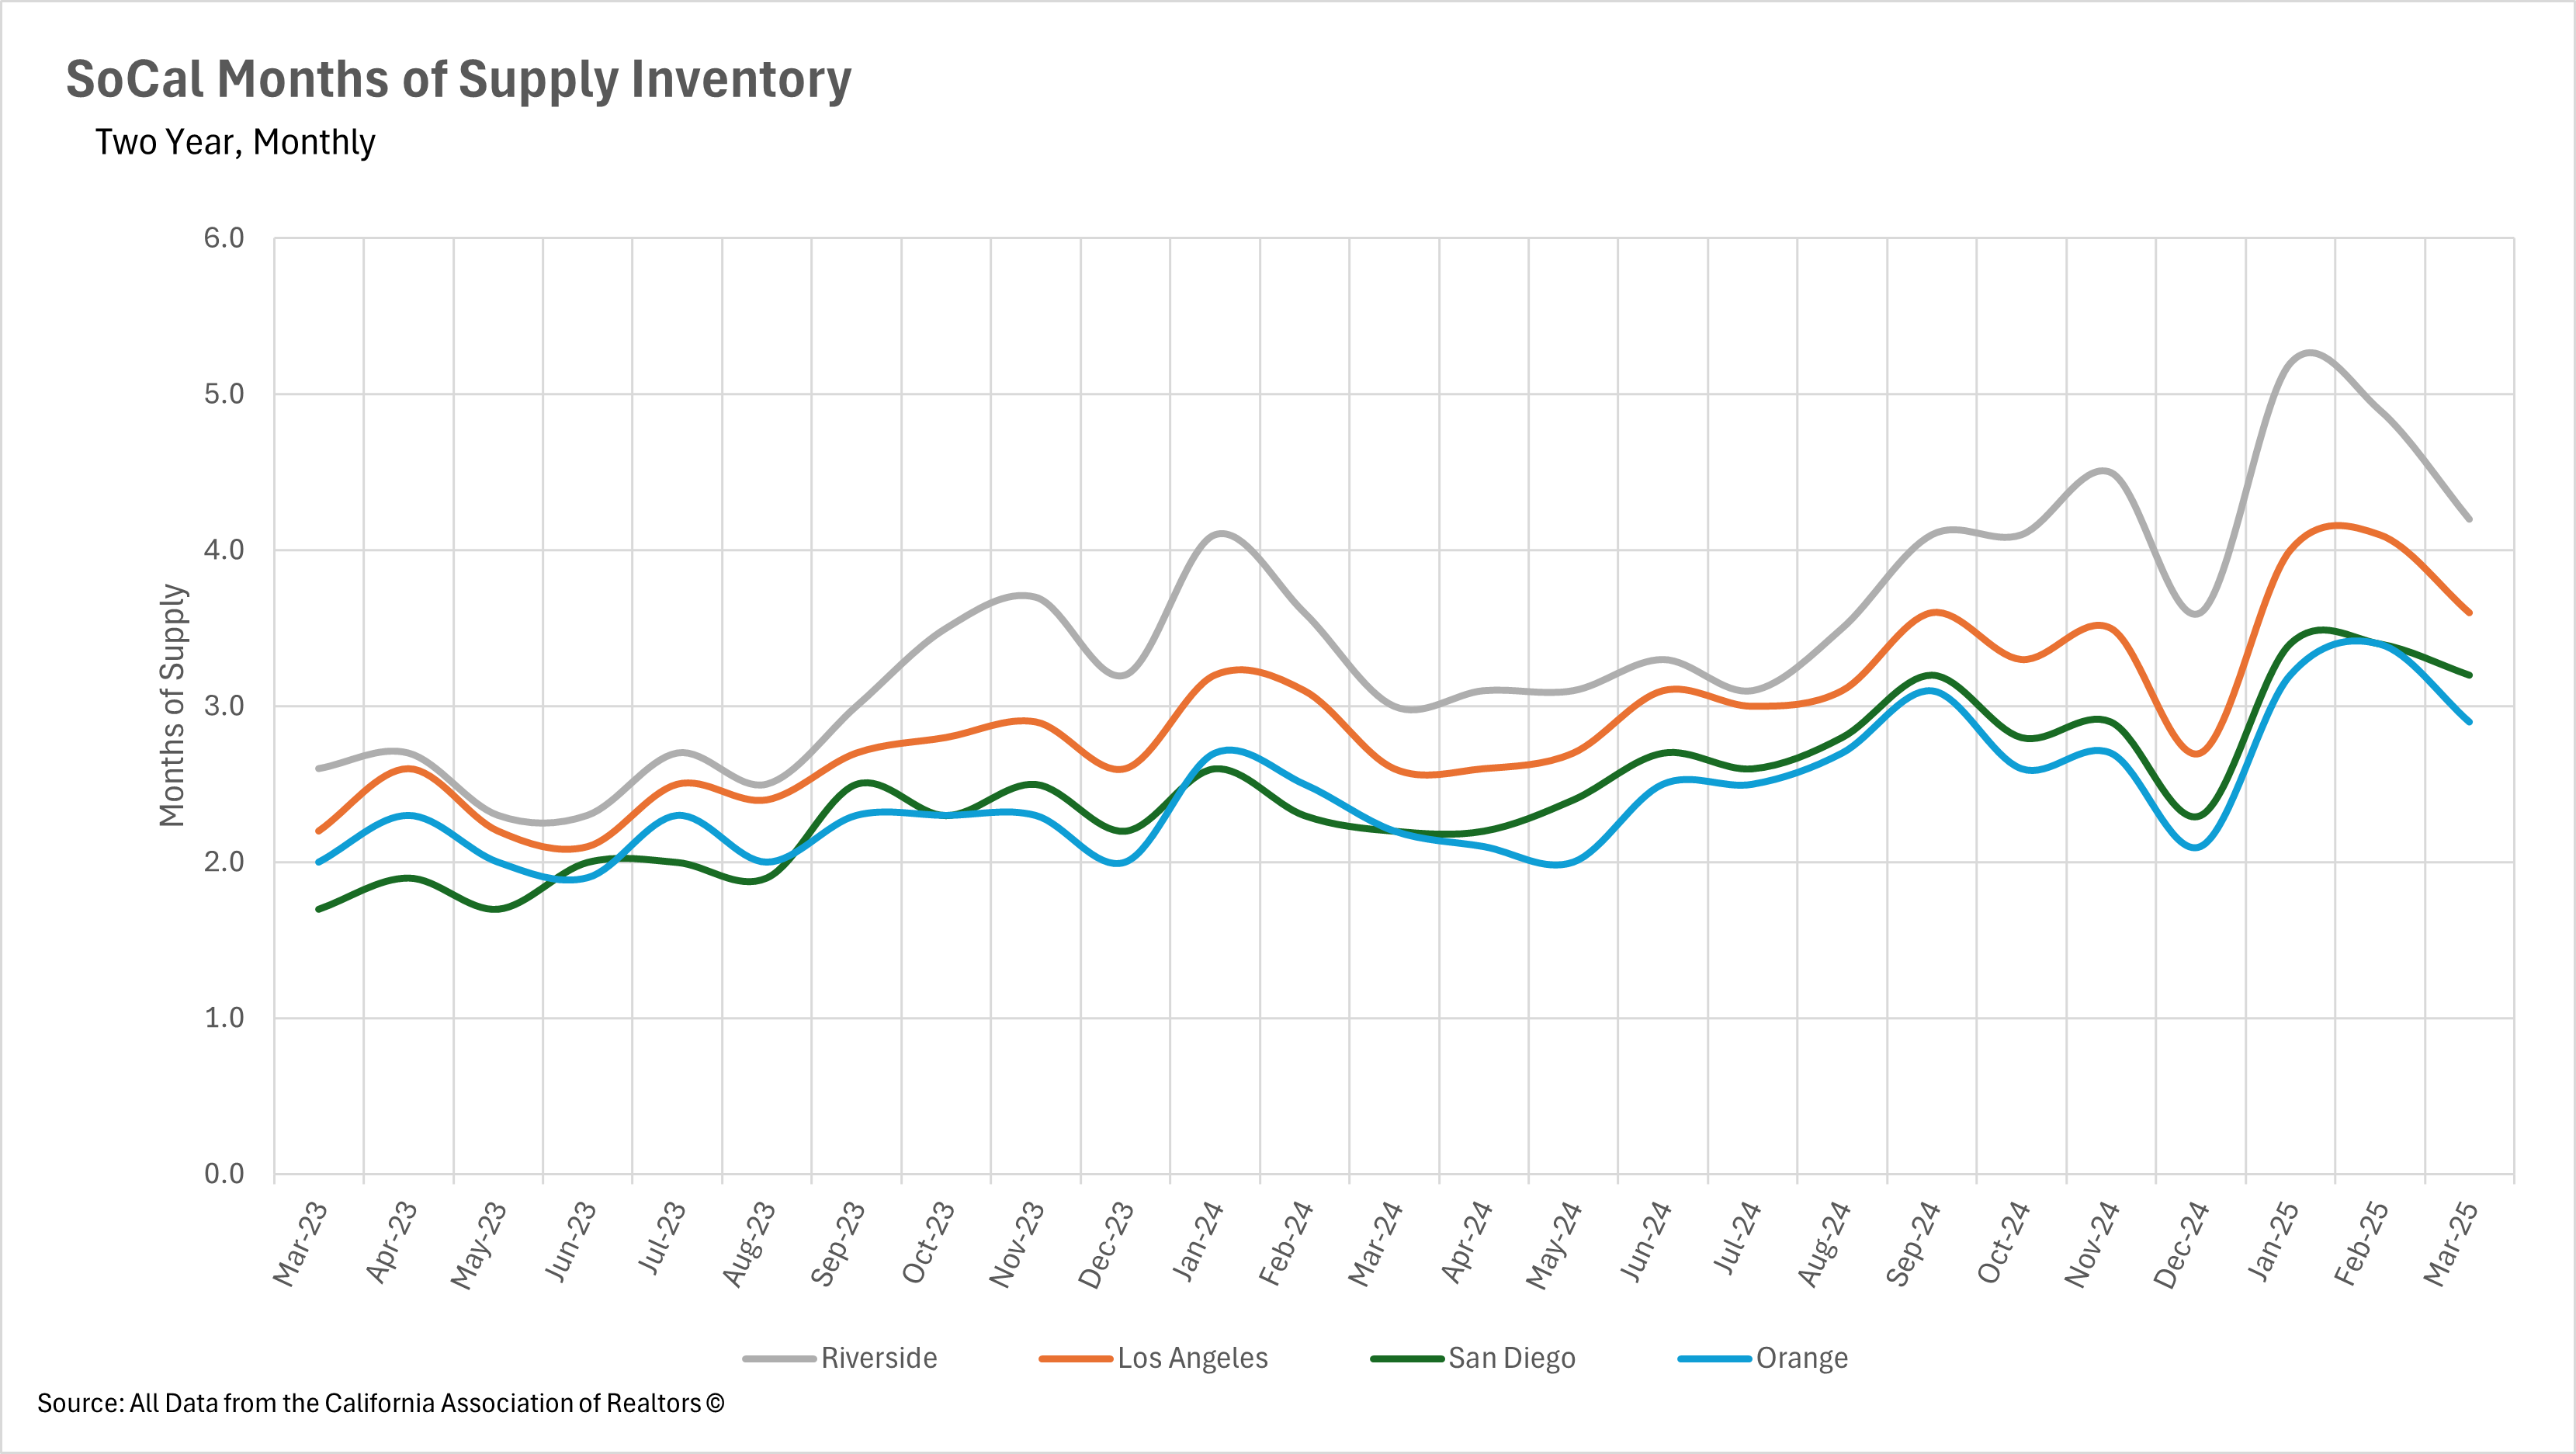
The most significant shift in Southern California real estate is the dramatic rebalancing of negotiating power toward buyers. When measuring Months of Supply Inventory (MSI)—with three months historically representing a balanced California market—we see most counties have moved beyond this threshold.
Riverside maintains the strongest buyer's market position with 4.2 months of supply in February, followed by Los Angeles at 3.6 months in March (improved from February's 4.1 months but still firmly in buyer's territory). San Diego County has moderated to 3.2 months in March from February's 3.4, placing it just above the balanced threshold. Only Orange County has pulled back into more neutral territory, with 2.9 months of supply in March compared to February's 3.4 months.
This represents a remarkable shift from early 2024, when all counties strongly favored sellers. This fundamental change gives buyers significant leverage in negotiations for the first time in several years, while requiring sellers to adjust their strategies to succeed in this evolving landscape.
Stay up to date on the latest real estate trends.

August 2026

July 2026

A Closer Look at Dallas Rental Prices, Hidden Costs, and What Renters Need to Know Before Moving

June 2026

May 2026

April 2026
March 2026

February 2026
January 2026
You’ve got questions and we can’t wait to answer them.