Market Update Los Angeles

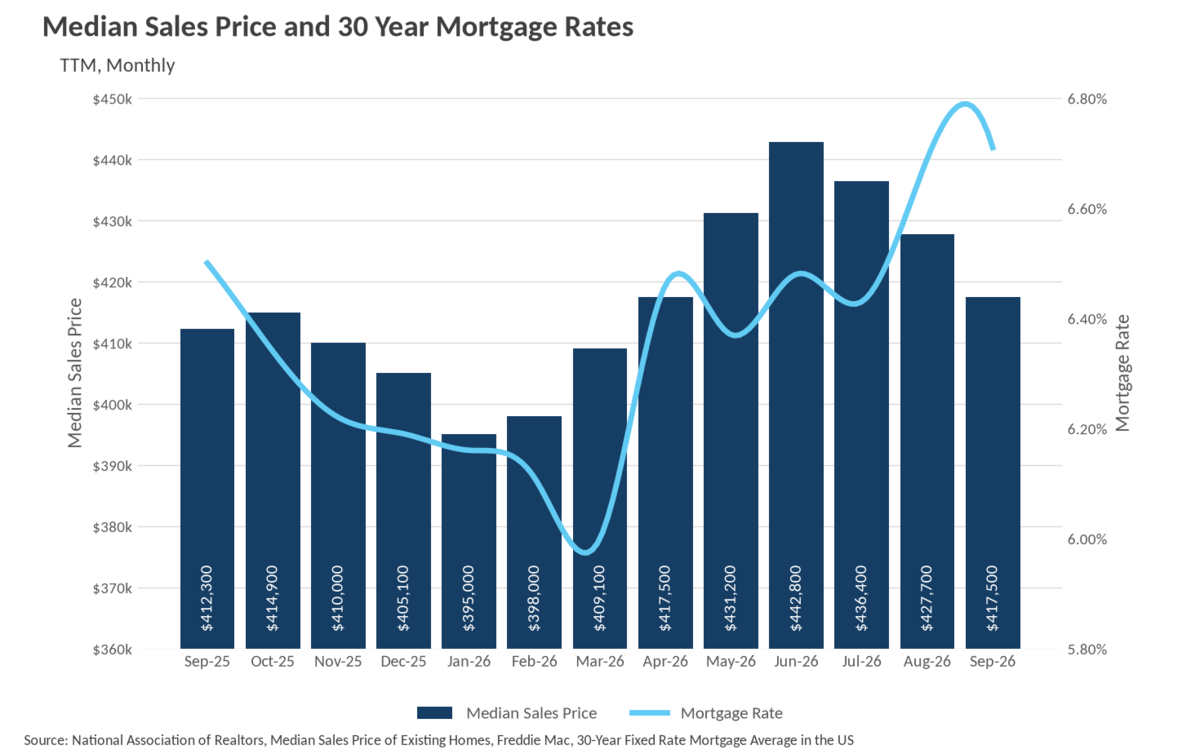
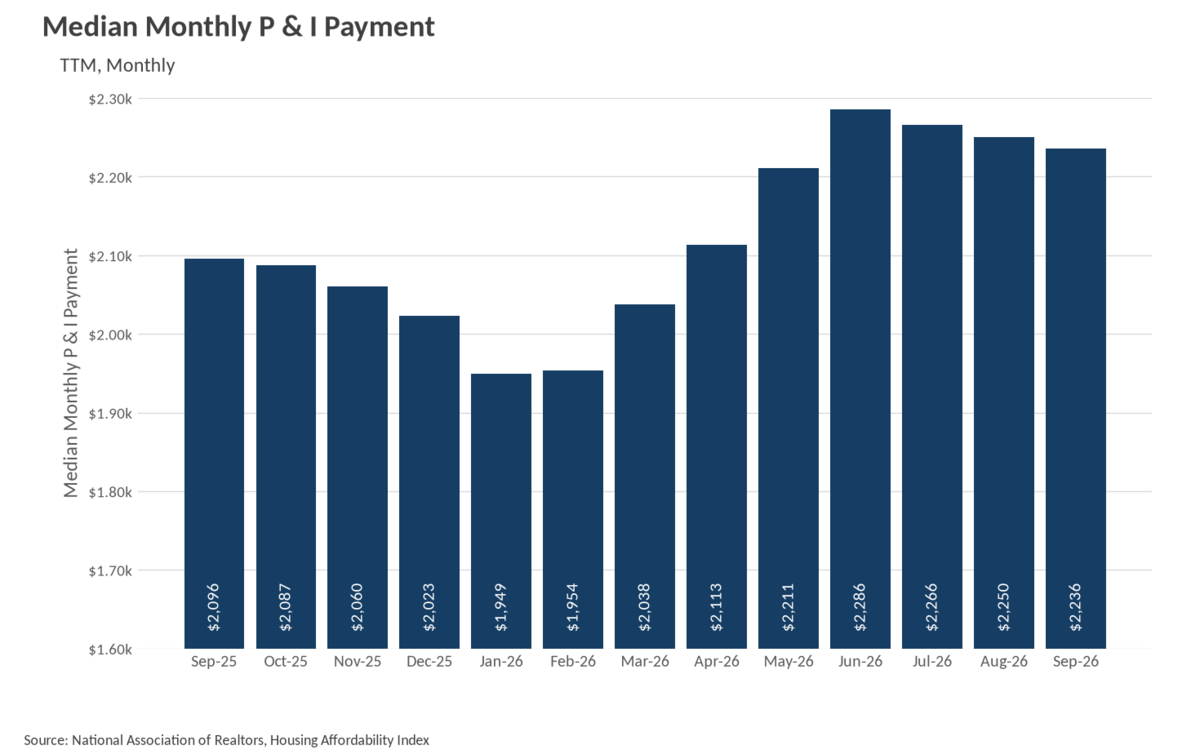
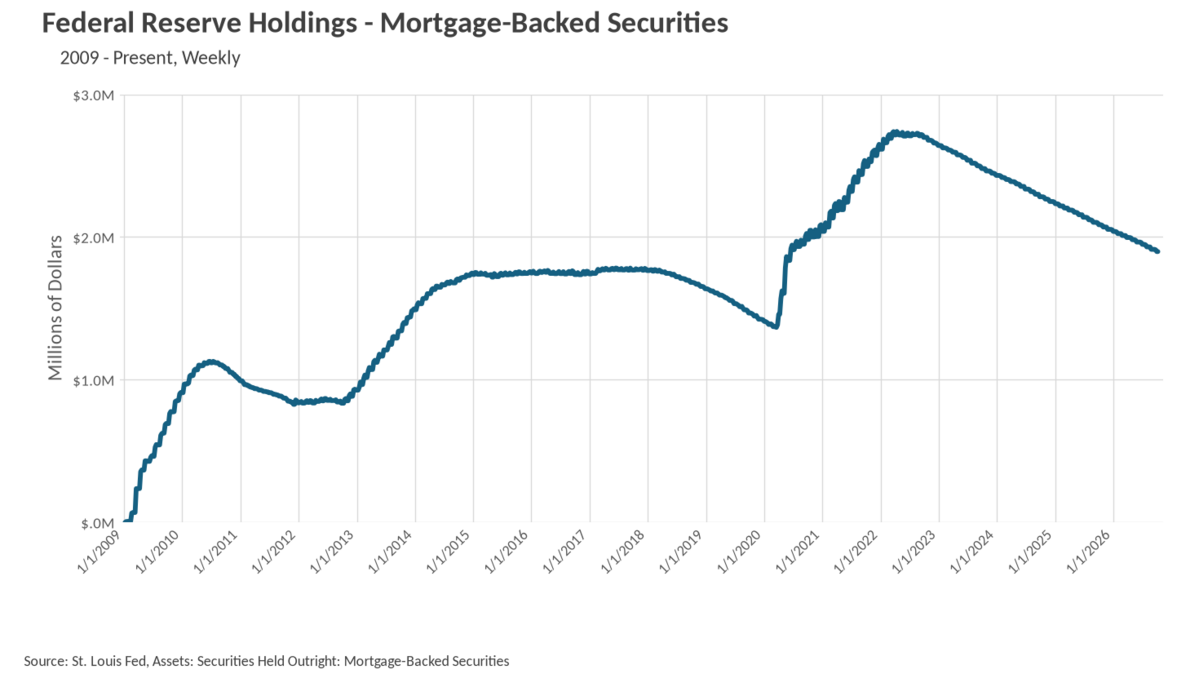
After a five-month run that carried the median sale price from $395,000 in January to a peak of $442,800 in June, prices have now retreated for three consecutive months. In September, the median home sold for $417,500, a 2.39% decline from August's $427,700 and a 5.71% drop from the June high. The one silver lining is that prices are still holding above last year's level, up 1.26% from the $412,300 median we saw in September 2025. Some of this seasonal softening is normal, as the back half of the year typically brings cooler pricing, but the affordability story is doing real damage here. Mortgage rates climbed to 6.71% in September and then jumped sharply to 7.28% in October, a full 128 basis points above the 6.00% low we saw back in March. Even with prices falling, the median monthly P&I payment sits at $2,236, which is 6.68% higher than the $2,096 buyers were paying a year ago and nearly $300 above January's $1,949. In other words, lower prices have not translated into lower payments, and with rates now pushing above 7%, the affordability squeeze is likely to intensify before it eases. Worth watching on that front: the Federal Reserve has continued to let its mortgage-backed securities holdings run off, with the balance falling from roughly $2.04 trillion in January to about $1.90 trillion in October, which removes a meaningful source of demand from the mortgage market.
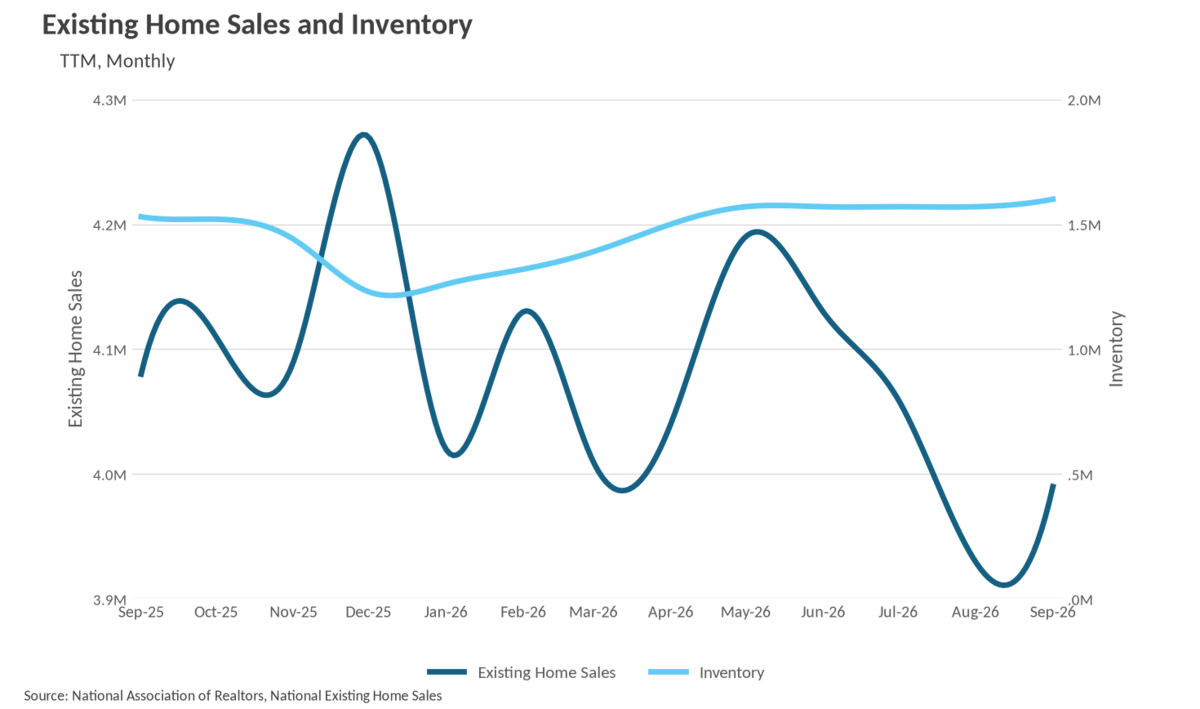
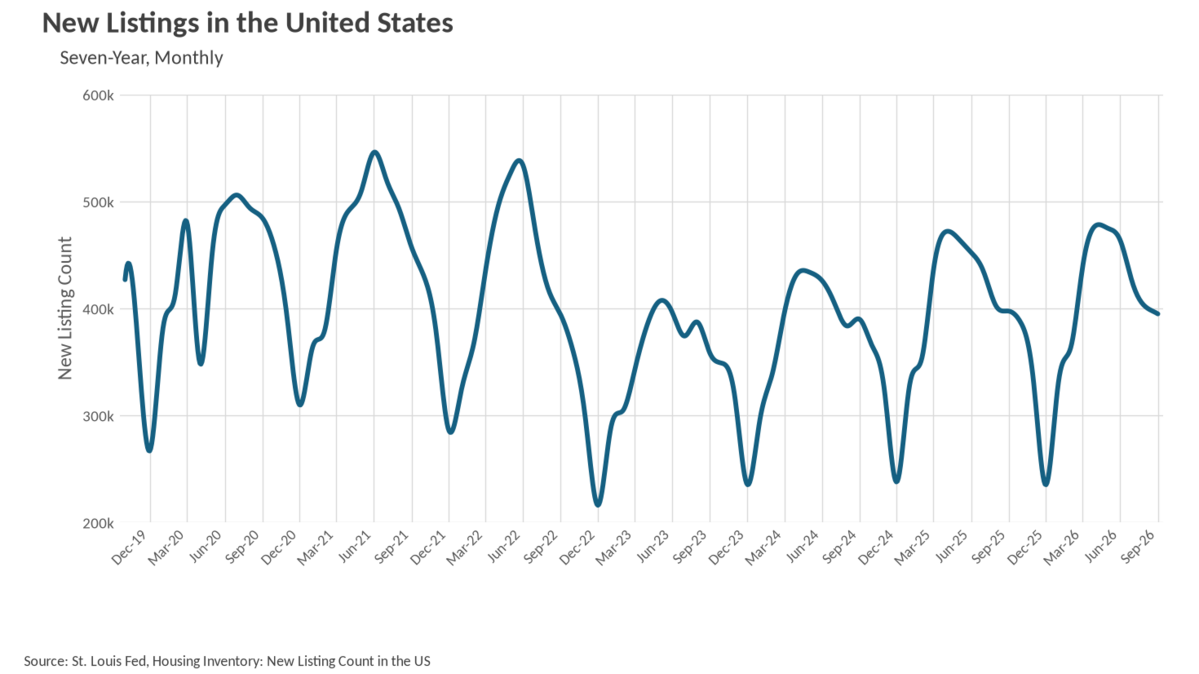
For four straight months, from May through August, inventory sat frozen at 1,570,000 homes. That changed in September, when inventory climbed to 1,600,000, a 1.91% month-over-month increase and a 4.58% gain over the 1,530,000 homes available at this time last year. This is the highest inventory level we have seen in well over a year, and notably it is rising at a point in the calendar when supply usually begins to contract. The new listings data tells a slightly different story, though. September brought 394,830 new listings to market, down 1.72% from August and down 0.65% from the 397,428 we saw in September 2025. So the inventory build is not coming from a flood of new sellers. Instead, it reflects homes sitting on the market longer and failing to clear at current prices. That is a meaningful distinction, because it suggests the supply increase is a demand problem rather than a supply surge, and it helps explain why prices have been drifting lower since June.
Existing home sales came in at 3,990,000 in September, a 1.53% increase from August's 3,930,000, which was the weakest reading in this entire data series. That modest uptick is welcome, but the year-over-year comparison is less encouraging: sales are down 2.21% from the 4,080,000 pace recorded in September 2025. The trend over the past several months has been clearly downward, with sales falling from 4,190,000 in May to 4,130,000 in June, 4,060,000 in July, and then 3,930,000 in August before September's small rebound. The timing lines up almost perfectly with the climb in mortgage rates, which bottomed at 6.00% in March and have risen in nearly every month since. Buyers who were energized by cheaper financing in the spring are now facing a very different math problem. With October rates at 7.28%, it is difficult to build a case for a meaningful rebound in transaction volume in the near term, though lower prices combined with the widest selection of homes in more than a year could tempt patient buyers who have been waiting on the sidelines.
When determining whether a market is a buyers’ market or a sellers’ market, we look to the Months of Supply Inventory (MSI) metric. The state of California has historically averaged around three months of MSI, so any area with at or around three months of MSI is considered a balanced market. Any market that has lower than three months of MSI is considered a seller’s market, whereas markets with more than three months of MSI are considered buyers’ markets.
Nationally, the math now points squarely toward a buyers' market. With 1,600,000 homes available in September against an annualized sales pace of 3,990,000, the national market is carrying roughly 4.8 months of supply, comfortably above the three-month balance point and up from about 4.5 months at this time last year. Inventory is growing, sales are running below last year's pace, and prices have fallen three months in a row, which is exactly the combination you would expect in a market where buyers hold the leverage. The caveat, of course, is that having leverage and being able to use it are two different things. With rates at 7.28% in October and the median P&I payment nearly 7% higher than a year ago, many buyers simply cannot act on the discounts now available to them. Sellers, for their part, should expect longer marketing times and should price realistically rather than anchoring to June's peak. As always, real estate is a highly localized asset, which is why you should check out what's going on in your local market below in the Local Lowdown!
Note: You can find the charts/graphs for the Local Lowdown at the end of this section.
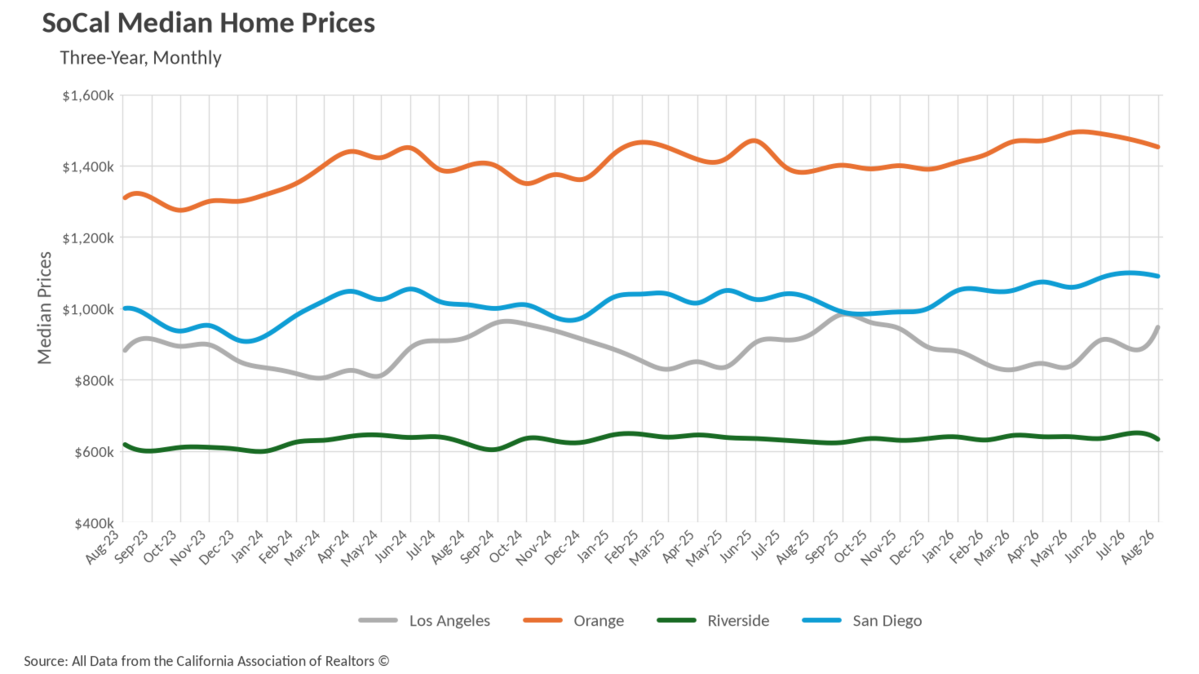
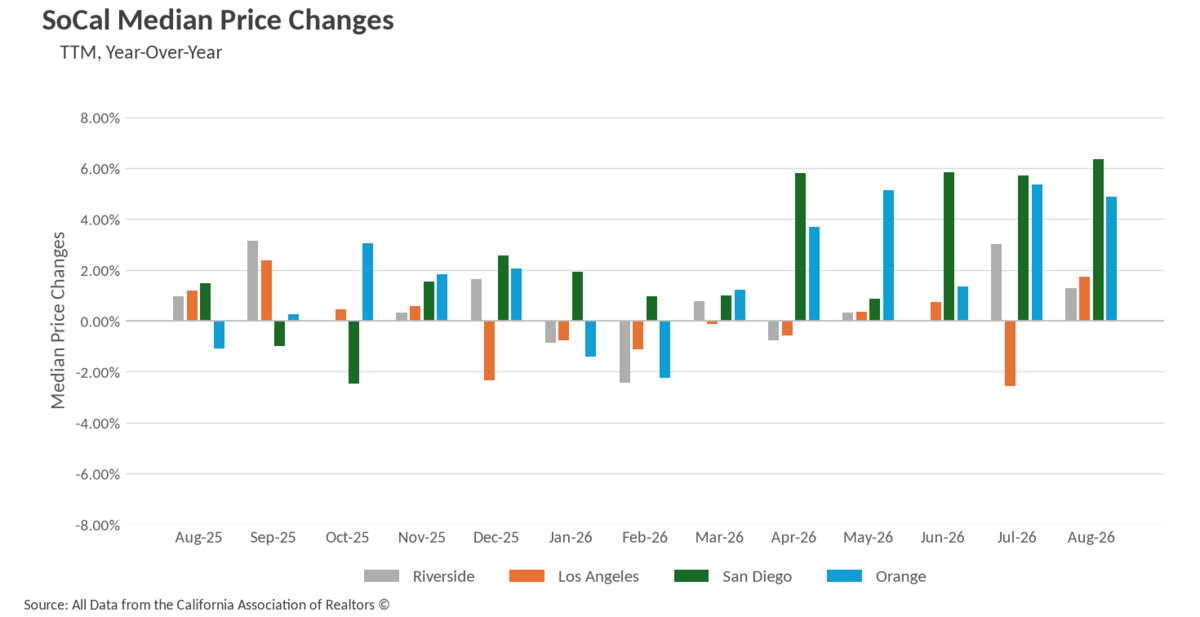
The headline for August is that Southern California prices are higher than they were a year ago in all four counties we track, though the magnitude varies considerably. San Diego led with a 6.34% year-over-year gain to $1,090,000, one of the strongest readings that market has produced in two years, and it came in just 0.86% below July's all-time high of $1,099,500. Orange County was close behind at 4.87%, with a median of $1,452,500 that extended a streak of year-over-year appreciation stretching back to March. Los Angeles turned in the month's biggest surprise, jumping 6.62% from July to $946,950 and posting its strongest median since the September 2025 peak, which reversed a disappointing July that had slipped 2.55% below year-ago levels.
Riverside County rounds out the picture with a more muted result. The median single-family home there sold for $632,990 in August, up 1.28% from last August's $625,000 but down 2.47% from July's $649,000, which had been the highest reading in more than two years. Riverside has been remarkably range-bound, trading between roughly $631,000 and $649,000 all year, and that stability is itself worth noting in a region where the coastal counties have been setting records. The takeaway is a region where values have reset at a higher level, with the steepest gains concentrated in the higher-priced coastal markets and the inland market holding flat rather than correcting.
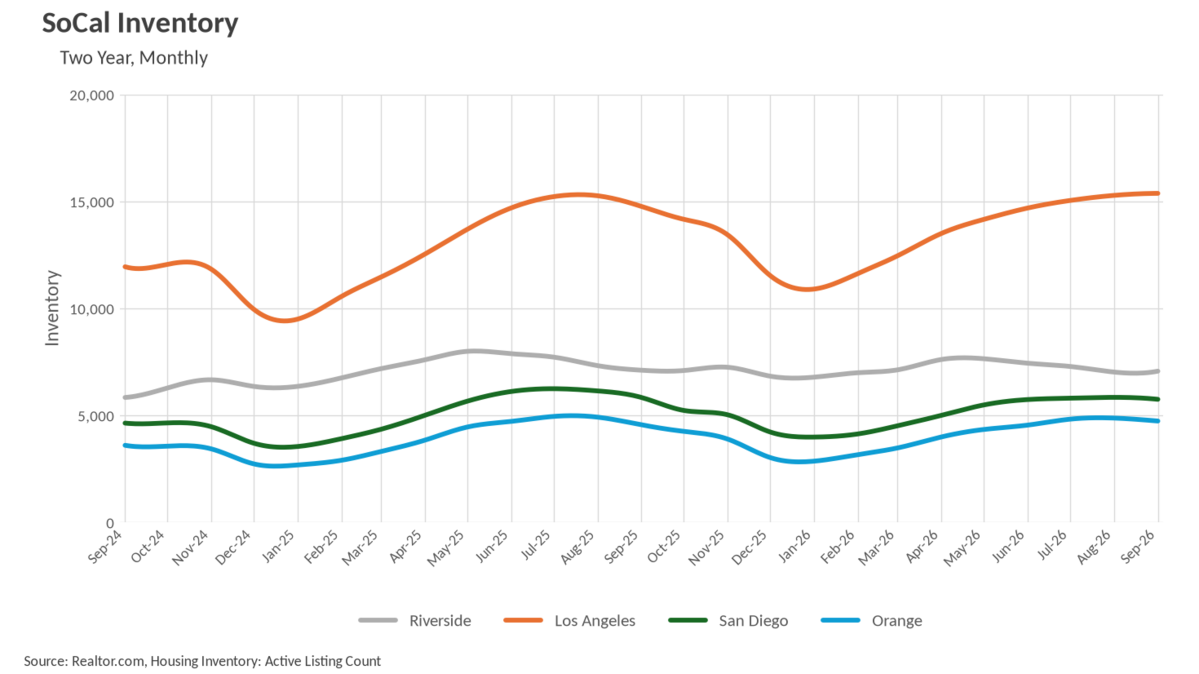
September's supply data divides Southern California into two camps. Los Angeles continued its eight-month climb, reaching 15,374 active listings, 4.13% above last September, though the month-over-month growth rate decelerated sharply to just 0.62% after gains of 1.57% in August and 2.40% in July. Orange County flipped back above year-ago levels with 4,735 listings, a 3.86% annual increase that reversed three consecutive months of running below 2025, even as the absolute count fell 2.85% from August in its first monthly decline since January.
San Diego and Riverside moved the other way. San Diego recorded 5,749 active listings, down 1.58% from August and 1.49% below last September, confirming a tightening trend that began in the spring after the county spent much of 2025 carrying a real inventory overhang. Riverside posted 7,065 listings, essentially flat from August's 7,023 but 0.62% below last September's 7,109, and well off the 7,992 peak reached in May 2025. Across all four counties, roughly 32,900 homes were available in September versus about 32,300 a year ago, a modest 2% increase that masks real divergence underneath. With seasonal drawdown ahead, September likely marks the high-water mark for the year in the markets that are still climbing.
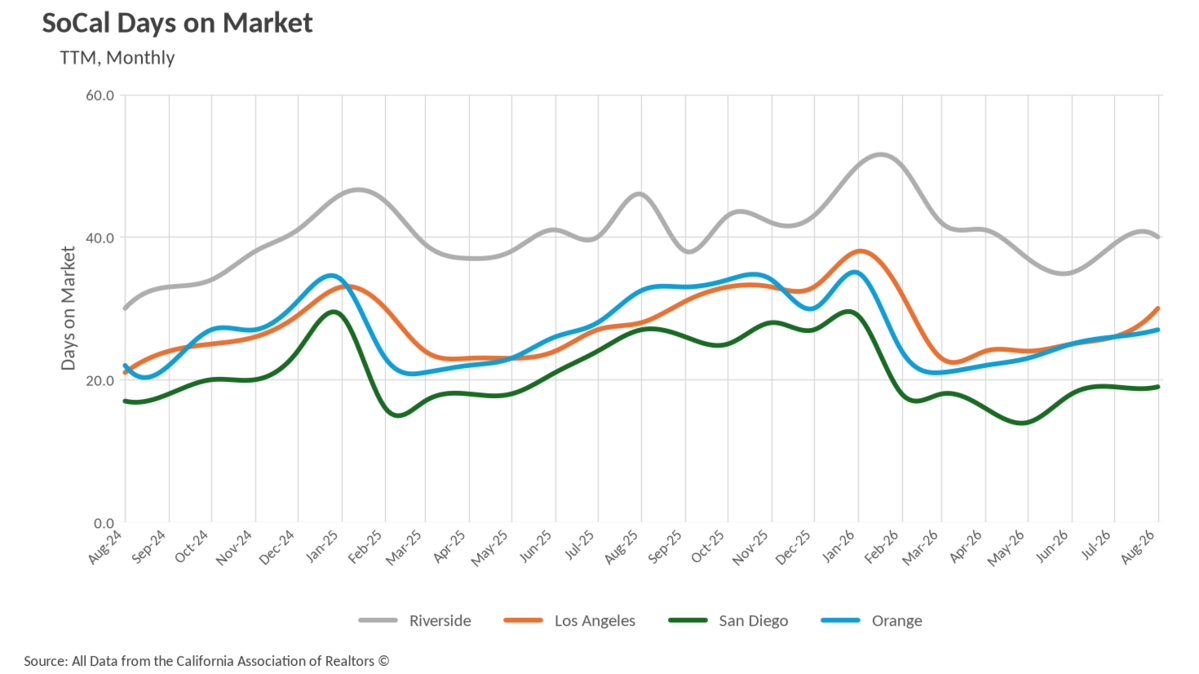
If one metric separates Southern California's submarkets, it is how long homes sit before going under contract. San Diego remains the standout, with the median listing going pending in 19 days in August, unchanged from July and a dramatic 29.63% faster than the 27 days it took a year ago. Orange County followed at 27 days, a 16.92% improvement on last August's 32.5 days and part of a pattern of year-over-year gains that has held all spring and summer. Riverside, despite being the slowest market in absolute terms at 40 days, delivered a meaningful 13.04% improvement from the 46 days recorded last August, and its 2026 readings have run better than 2025 in nearly every summer month.
Los Angeles is the lone county moving the wrong direction on this measure. The median listing spent 30 days on the market in August, a 15.38% jump from July's 26 days and 7.14% above last August's 28 days. That said, a four-day lengthening in late summer is unremarkable, and Los Angeles swung from 28 days last August to 38 days by January, so the current reading reflects normal seasonal transition more than deterioration. The broader regional message is that three of four counties are absorbing listings faster than they did a year ago, which is the single most encouraging data point in this month's numbers.
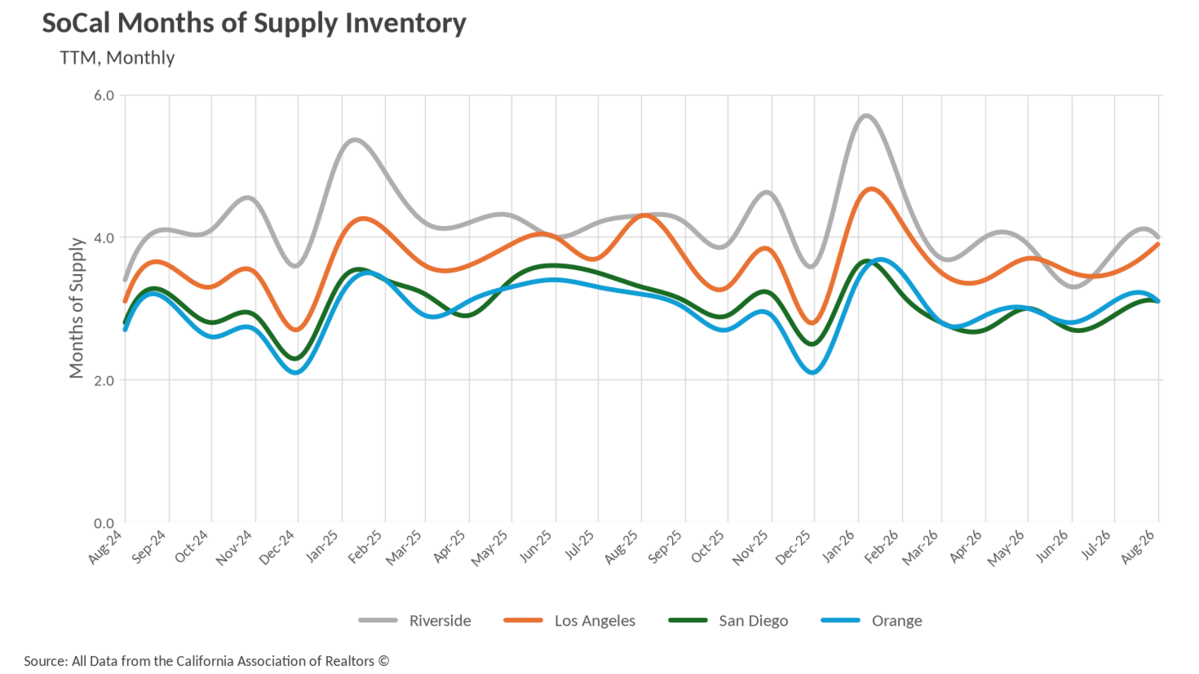
When determining whether a market is a buyers’ market or a sellers’ market, we look to the Months of Supply Inventory (MSI) metric. The state of California has historically averaged around three months of MSI, so any area with at or around three months of MSI is considered a balanced market. Any market that has lower than three months of MSI is considered a seller’s market, whereas markets with more than three months of MSI are considered buyers’ markets.
As of August, no Southern California county we track sits on the seller's side of that line, but none is deep into buyers' territory either. Orange County and San Diego both registered 3.1 months of supply, placing them squarely at balance, with Orange unchanged from July and down 3.13% year over year and San Diego up 6.90% from July's 2.9 months but still 6.06% below last August's 3.3 months. Los Angeles came in at 3.9 months, modestly on the buyers' side and up 11.43% from the 3.5 months recorded in June and July, though that represents a 9.30% improvement from last August's 4.3 months. Riverside carries the loosest conditions at 4.0 months, up from 3.8 in July but down 6.98% from last August's 4.3 months, and far better than the 5.6-month reading it posted in January.
The consistent thread is that every county is better supplied than it was a year ago in relative terms, yet every county has improved its MSI year over year. That combination describes a region that has found genuine equilibrium. Sellers in San Diego and Orange County hold a slight edge given faster sales and stronger price growth, while buyers in Los Angeles and especially Riverside have enough selection and enough time on the clock to negotiate. Expect MSI to drift modestly higher into the fall as transaction volume slows, but the underlying balance looks durable heading into winter.
Stay up to date on the latest real estate trends.
November 2026

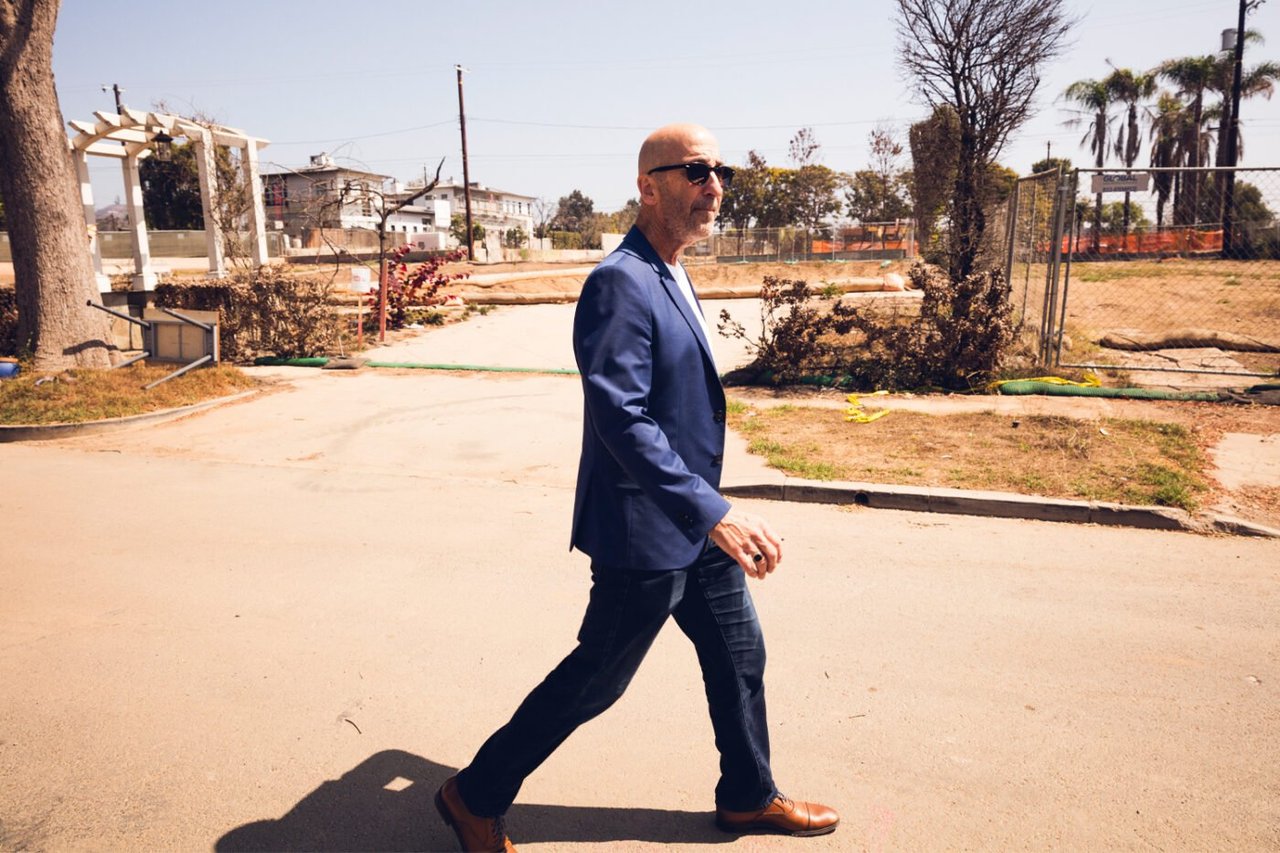
21 Months After the Fire: What’s Really Happening in Pacific Palisades Real Estate?
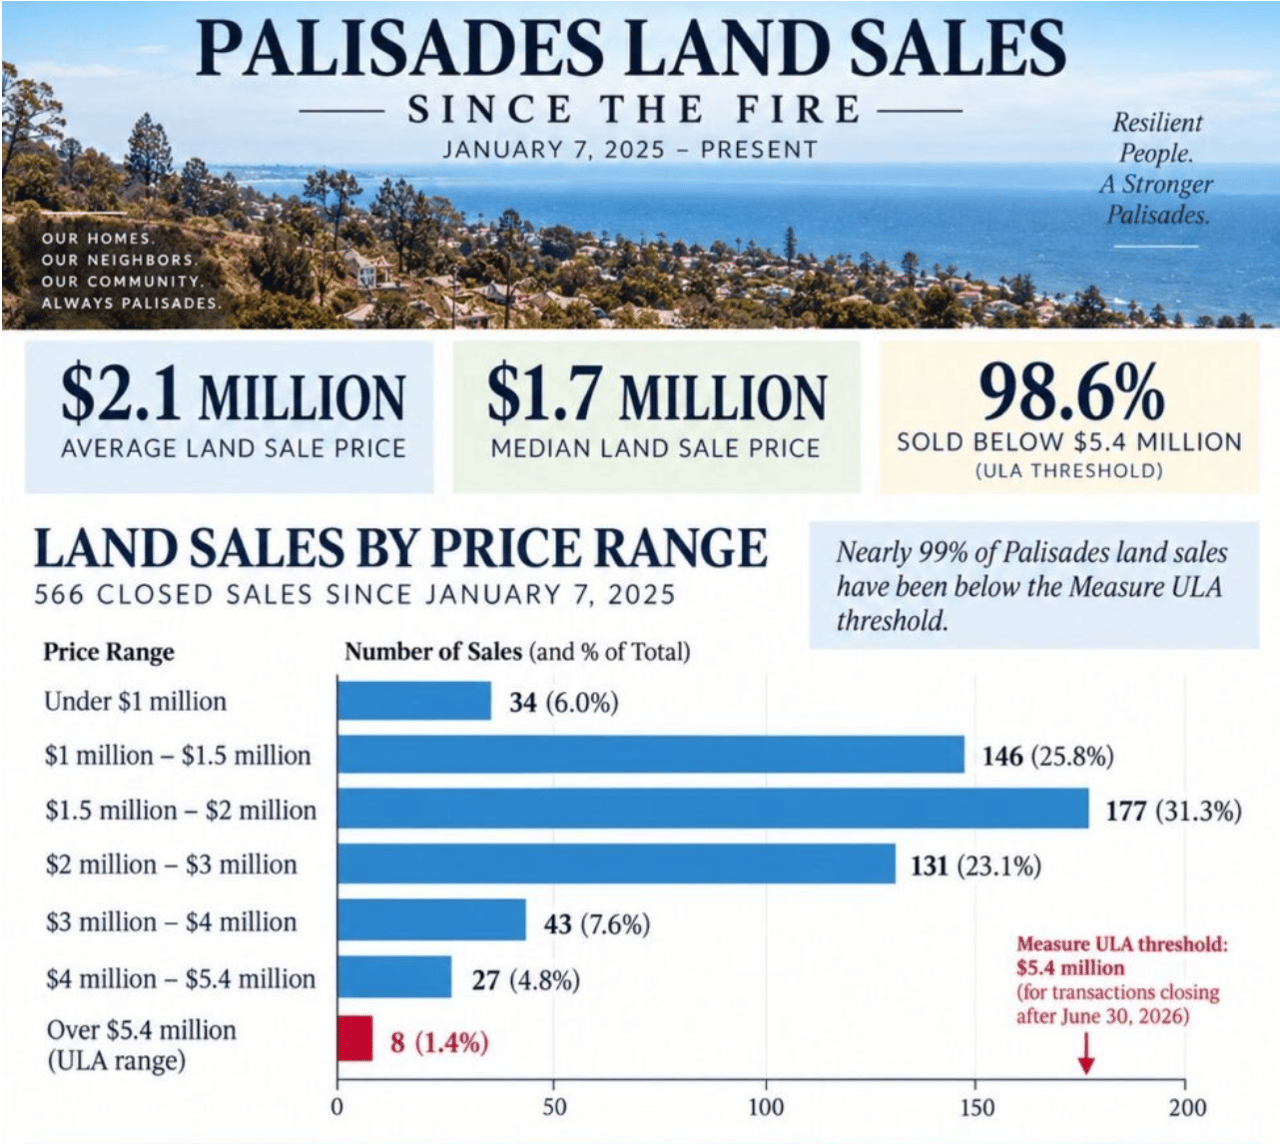
Foreclosure activity has risen since 2025, but the latest numbers remain a small fraction of the Palisades housing market.
October 2026

September 2026

August 2026
You’ve got questions and we can’t wait to answer them.