Market Update Los Angeles
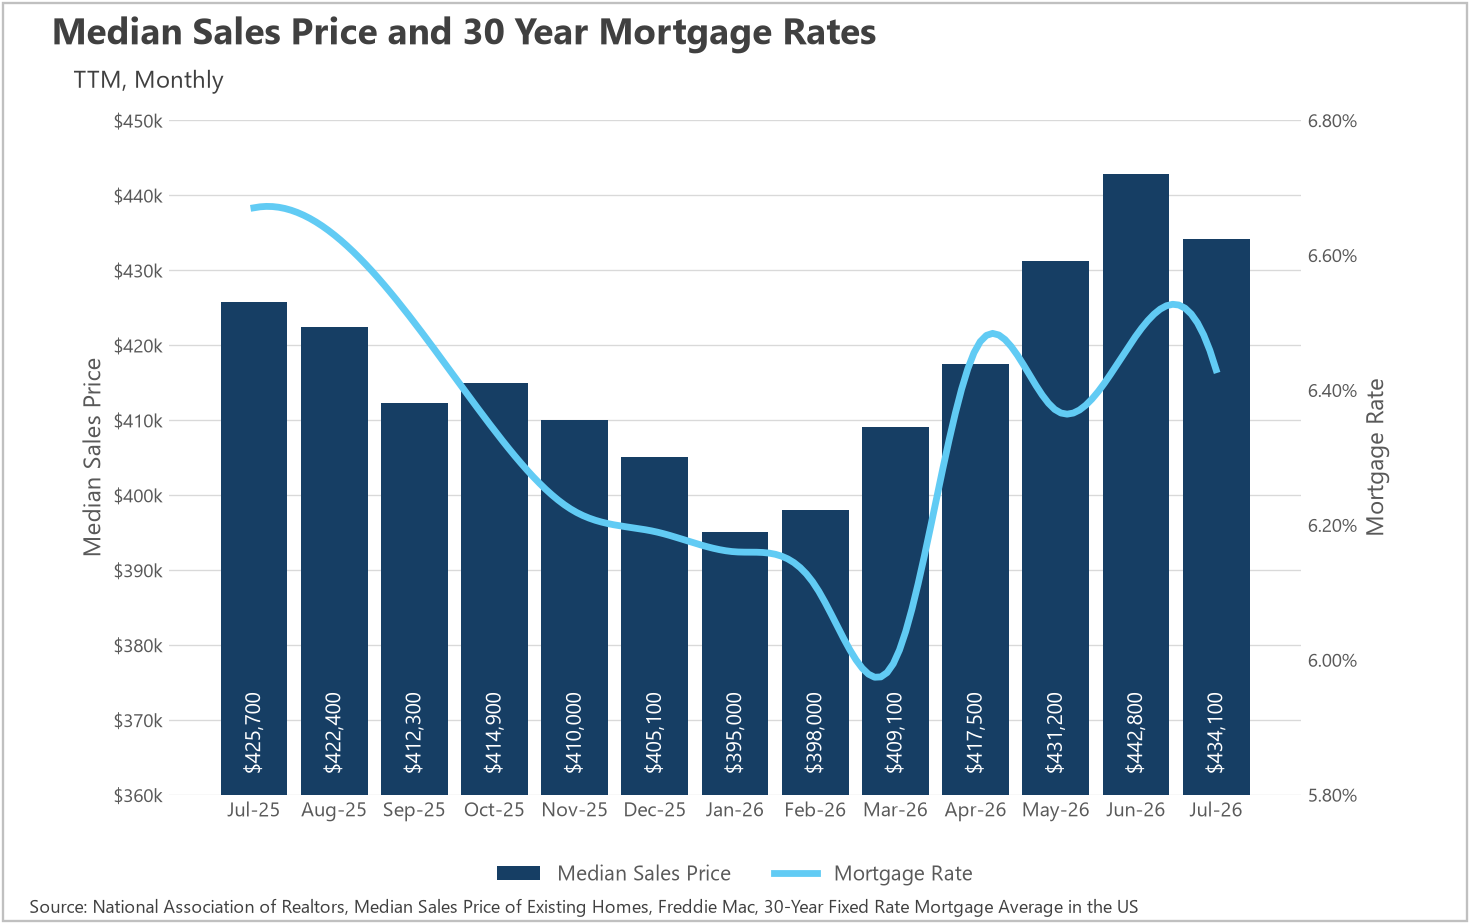
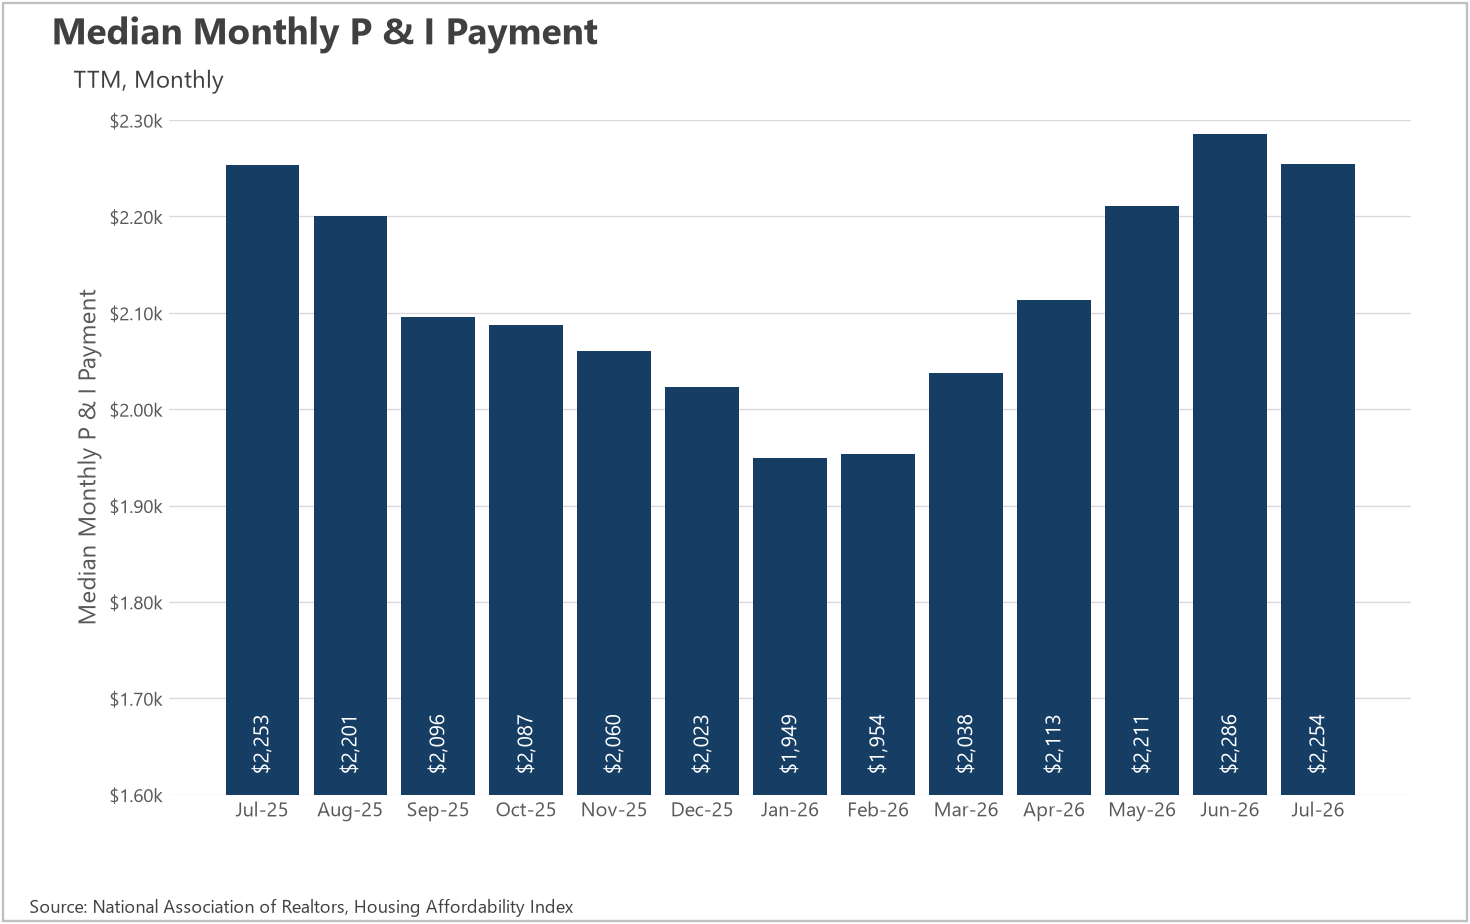
After five straight months of gains carried the median sale price to $442,800 in June, July brought the first pullback of the year. The median home sold for $434,100, a 1.96% decline from June, though still 1.97% higher than the $425,700 we saw in July of last year. A modest summer dip is not unusual, and the bigger picture is that prices have climbed roughly 9.9% since January's $395,000 trough. On the financing side, the 30-year mortgage rate eased slightly to 6.43% in July before jumping to 6.69% in August, its highest level since last summer and a meaningful move away from the 6% low we saw back in March. That combination of a slightly lower price and a slightly lower rate trimmed the median monthly P&I payment to $2,254 in July, down from $2,286 in June. The catch is that this figure is now essentially identical to the $2,253 buyers were paying a year ago, meaning the affordability advantage that lower rates delivered earlier in the year has been completely erased. With August rates moving higher, payments look likely to head back up.
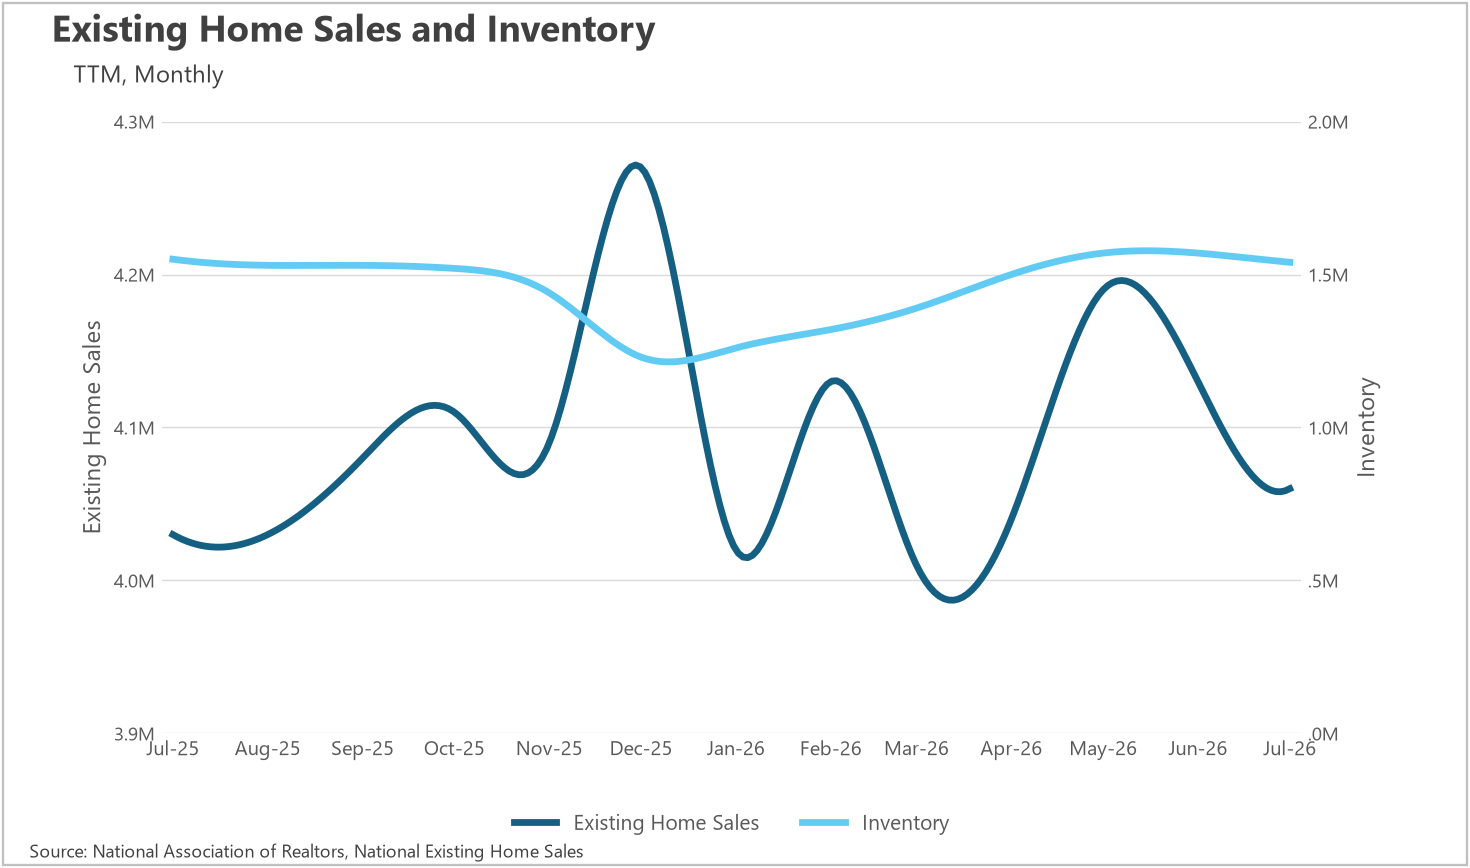
Inventory data runs one month ahead of the other figures, and it tells us the supply build that defined the first half of the year has reversed course. July inventory came in at 1,540,000 homes, a 1.91% decline from the 1,570,000 available in both May and June, and now 0.65% below the 1,550,000 we had at this time last year. That is a notable shift, because inventory had been running above year-ago levels through the spring. New listings reinforce the story.
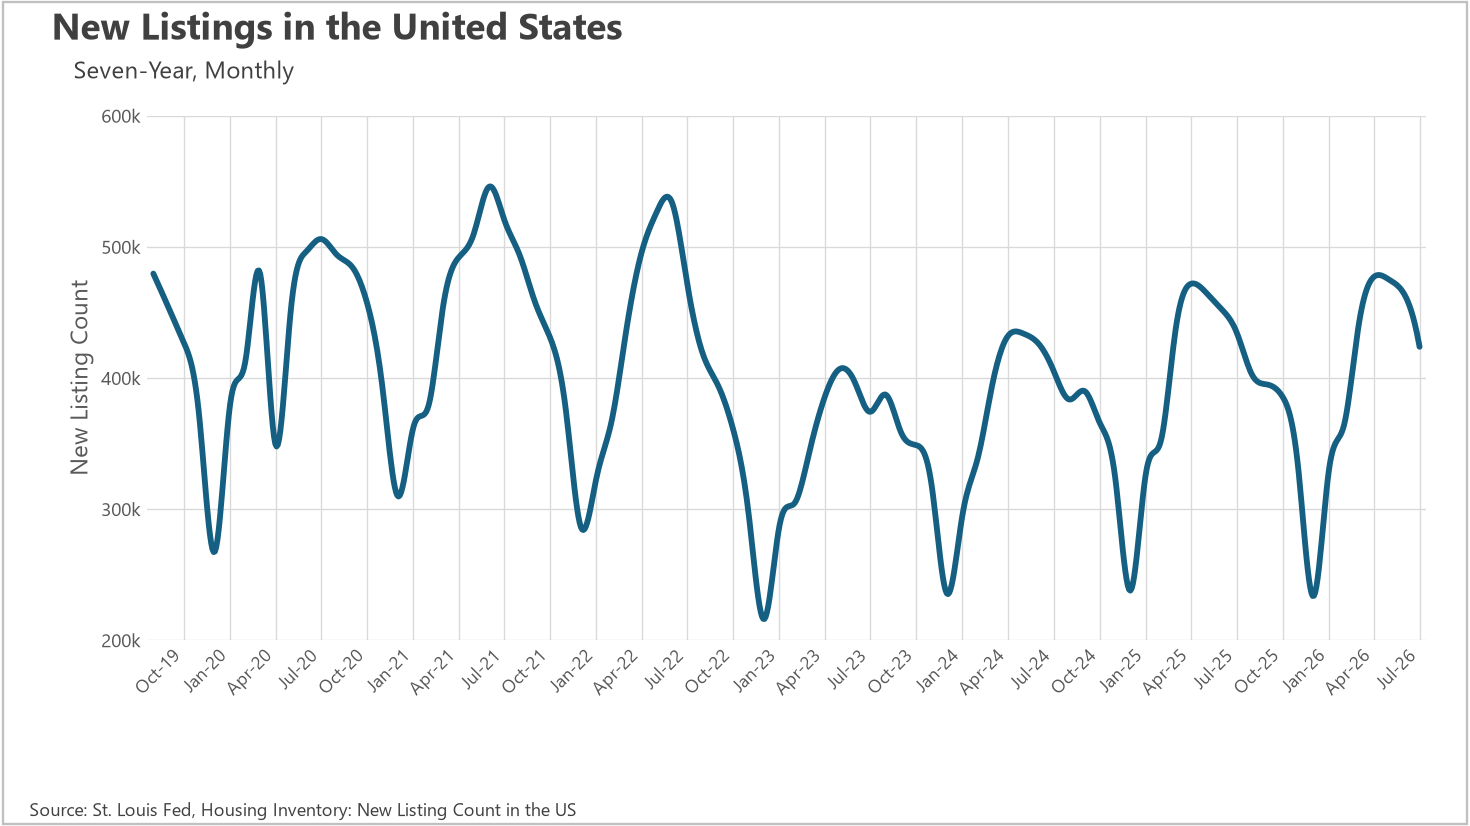
Sellers brought 423,732 new listings to market in July, an 8.58% drop from June and 2.55% below last July's 434,816. Seasonality explains part of that decline, since listing activity typically peaks in late spring, but the year-over-year decrease suggests homeowners are becoming a bit more hesitant as rates push back toward 6.7%. Fewer new listings combined with steady sales activity means the pool of available homes is likely to keep thinning through the back half of the summer.
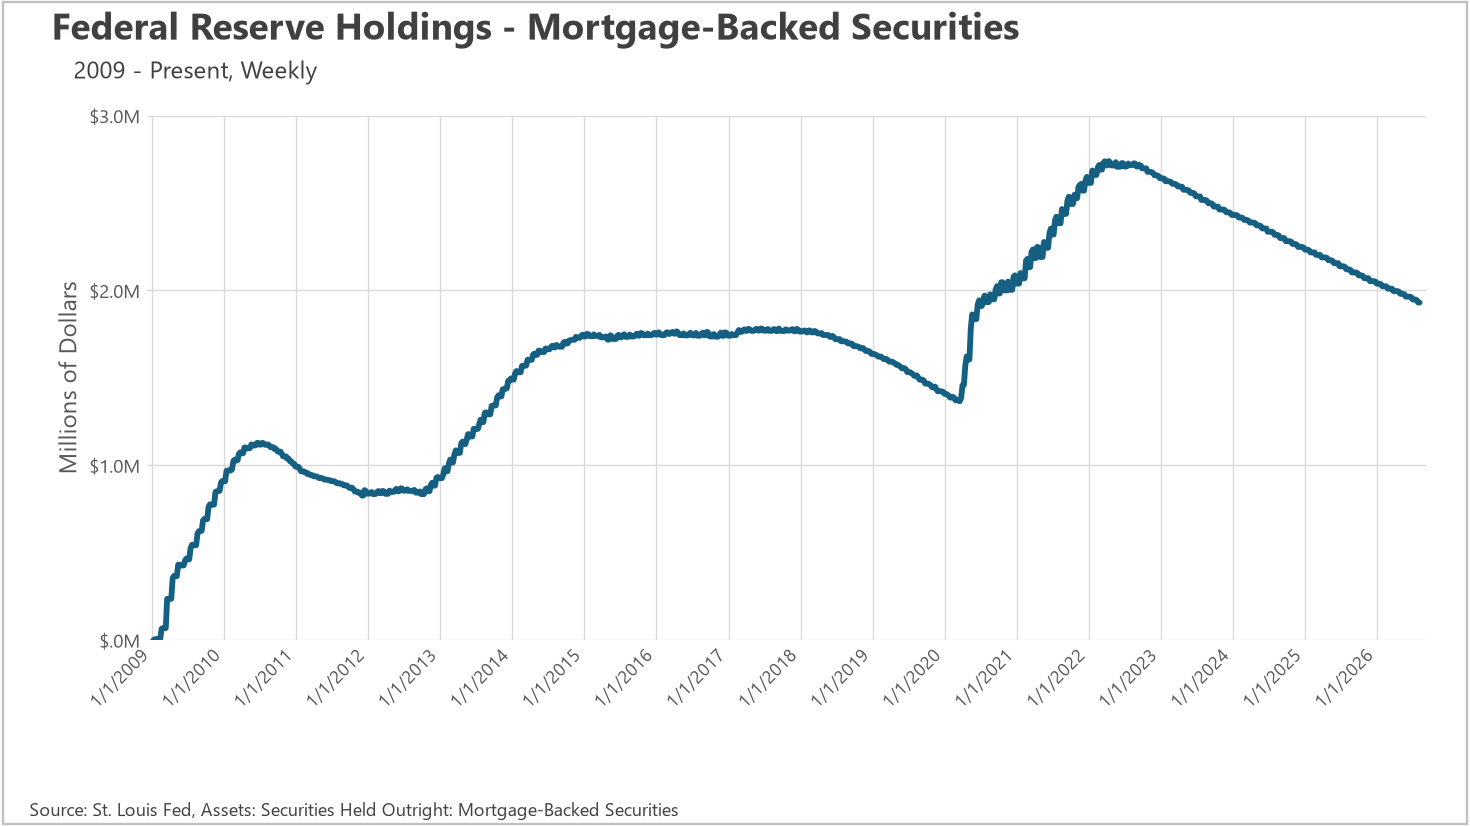
Existing home sales registered 4,060,000 in July, down 1.69% from June's 4,130,000 and roughly 3% below May's 4,190,000 high for the year. On a year-over-year basis, however, sales are up 0.74% from last July's 4,030,000, which means demand is essentially holding steady rather than deteriorating. That is a reasonable outcome given what buyers are facing. Monthly payments are back to where they were a year ago, and the run of price appreciation from January through June asked buyers to stretch further with every passing month. What is encouraging is that sales have stayed in a fairly narrow band between 4,010,000 and 4,190,000 all year, showing a market that has found a floor even as financing costs have moved around. Also worth watching in the background: the Federal Reserve's mortgage-backed securities holdings continue to shrink, falling to $1.93 trillion in August from nearly $2.07 trillion last November, which removes a source of support for mortgage rates over time.
When determining whether a market is a buyers’ market or a sellers’ market, we look to the Months of Supply Inventory (MSI) metric. The state of California has historically averaged around three months of MSI, so any area with at or around three months of MSI is considered a balanced market. Any market that has lower than three months of MSI is considered a seller’s market, whereas markets with more than three months of MSI are considered buyers’ markets.
Nationally, 1,540,000 homes for sale against a sales pace of 4,060,000 homes per year works out to roughly 4.5 months of supply, which puts the country as a whole comfortably in buyers' market territory by California's three-month yardstick. That said, the trend is moving in sellers' favor. A year ago the same math produced closer to 4.6 months, and with inventory down 1.91% month over month, new listings down 8.58%, and sales holding above last year's level, supply is tightening rather than loosening. The counterweight is affordability: with the median P&I payment back at year-ago levels and August rates at 6.69%, demand could soften enough to keep the balance where it is. As always, real estate is a highly localized asset, which is why you should check out what's going on in your local market below in the Local Lowdown!
|
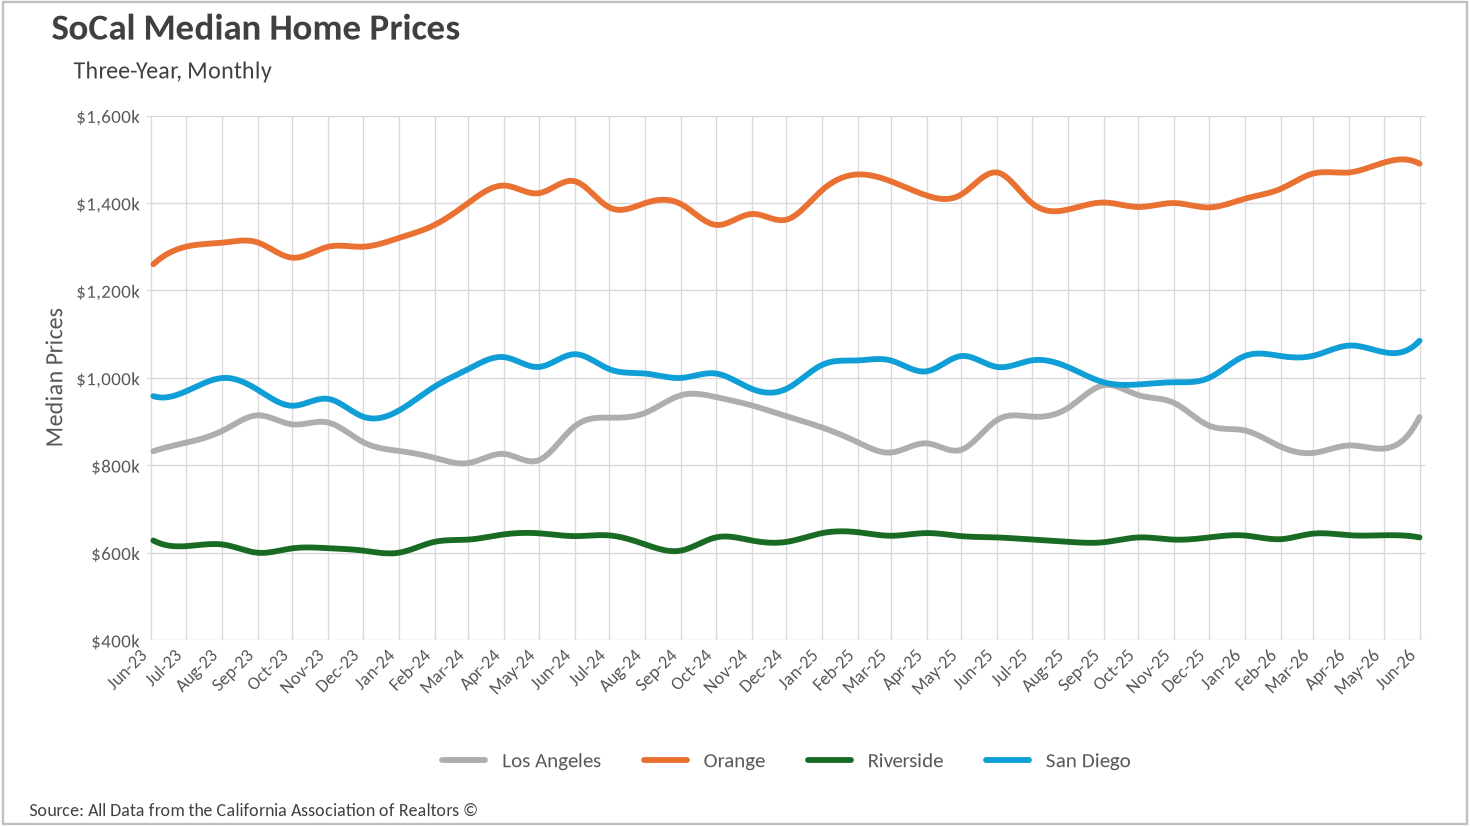
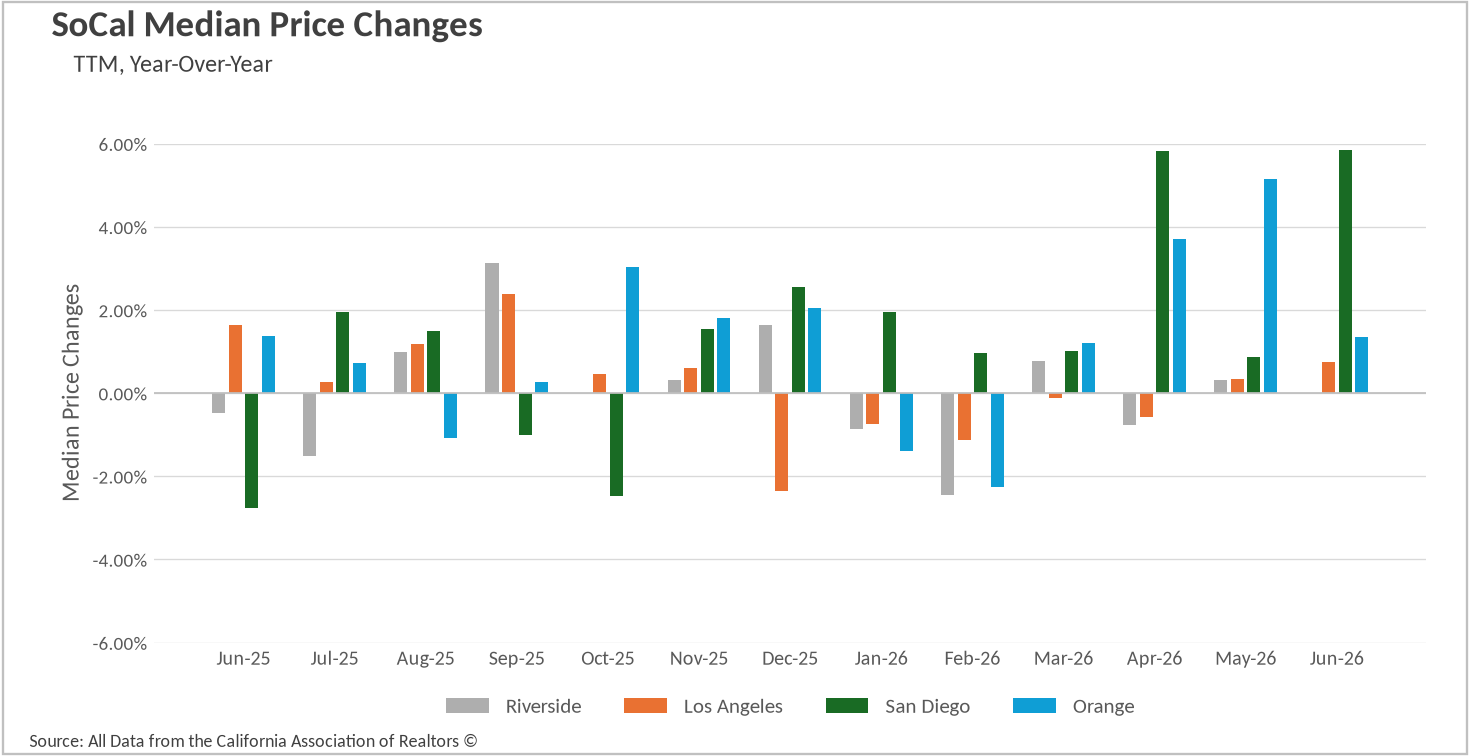
June was a good month for Southern California sellers, though the gains were distributed unevenly. San Diego did the heavy lifting, pushing its median single-family sale price to $1,085,000, the highest figure in the series and a 5.85% improvement on June 2025. That is now nine consecutive months of year-over-year growth in San Diego, and the county has added roughly $95,000 to its median since November. Orange County stayed essentially level with May's all-time high, printing $1,490,000 for a 1.36% annual gain and a fourth straight month of appreciation, even if the pace cooled sharply from May's 5.14% reading.
Los Angeles produced the most dramatic month-over-month move, jumping 8.59% from $838,350 in May to $910,370 in June. That figure is only 0.74% above last June, but it represents the second consecutive month of year-over-year growth after a five-month run of declines that stretched from December through April, and it puts the county back above the $900,000 threshold. Riverside, meanwhile, is the picture of stability. At $635,000, the county matched June 2025 exactly, slipped 0.78% from May's $640,000, and has spent the entire year trading in a narrow band between $631,000 and $643,740. Riverside is not appreciating the way the coastal counties are, but it is not giving ground either, and the roughly $450,000 gap between the San Diego and Riverside medians is a reminder of why the Inland Empire continues to absorb price-sensitive demand.
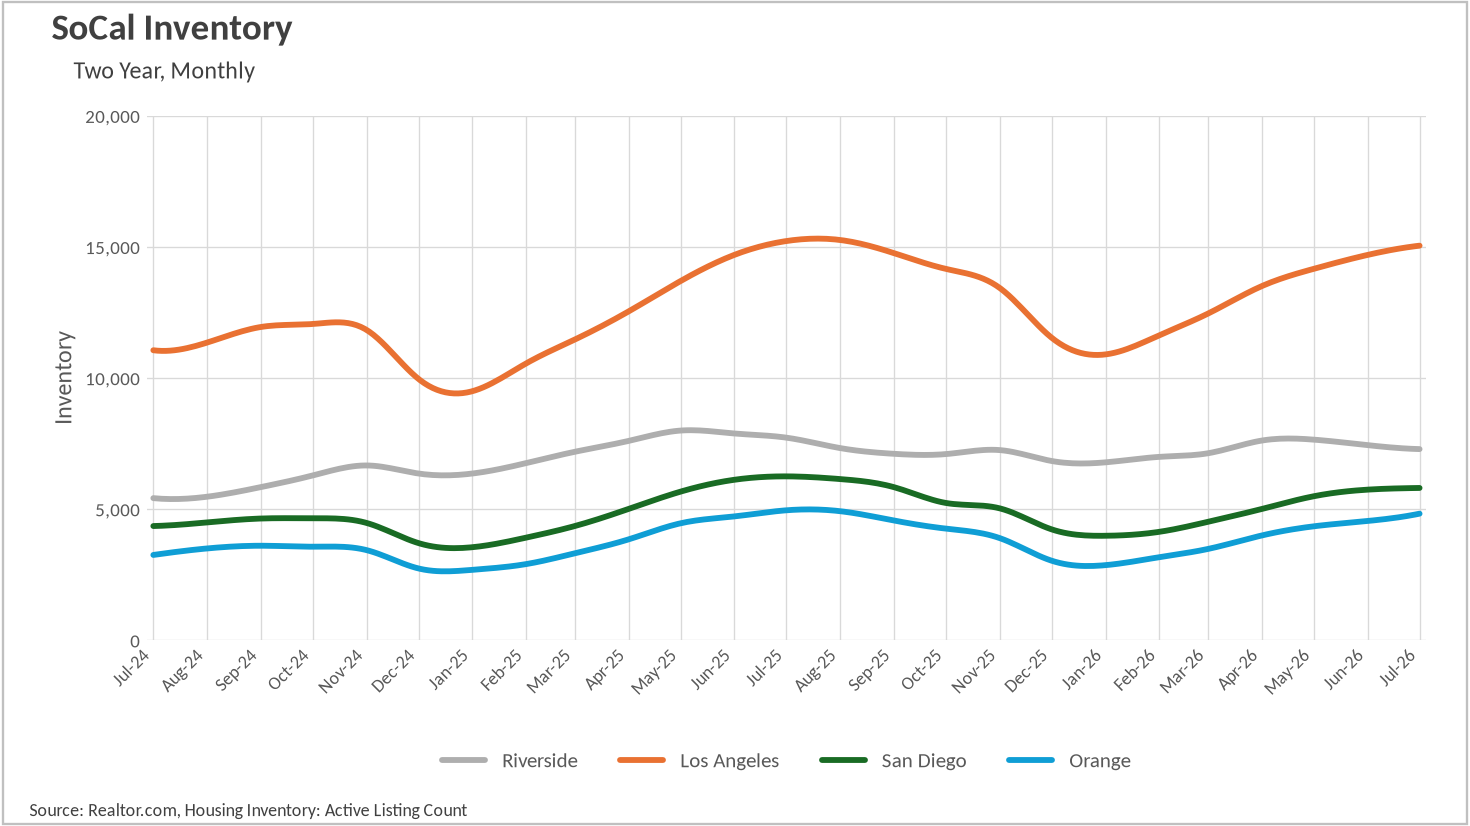
The most consistent theme in this month's data is inventory, and it is a story that has completely inverted from where it stood a year ago. Because inventory data runs a month ahead of our other metrics, we can already see July, and every single market came in below its July 2025 mark. San Diego leads with 5,803 active listings, down 7.08% from 6,245 a year ago and a fourth straight month of annual declines. Riverside follows at 7,285 listings, 5.65% below last July's 7,721. Orange County's 4,823 listings sit 2.60% under year-ago levels for a third consecutive month, and Los Angeles finally crossed the line with 15,042 listings, 1.16% below July 2025.
What separates Riverside from the rest is the direction of its monthly trend. While Los Angeles added 2.40% to its count between June and July, Orange County added 6.14%, and San Diego added a modest 1.12%, Riverside actually shed 2.03%, falling from 7,436 in June to 7,285 in July. That is a second consecutive monthly decline for a county whose inventory peaked at 7,646 in May, and it comes at the point in the calendar when supply normally tops out. Across the region, the pattern is the same even if the magnitudes differ: the oversupply that weighed on pricing through late 2025 and early 2026 has been worked off, and Southern California is heading into the second half of the year with a leaner shelf than it had twelve months ago.
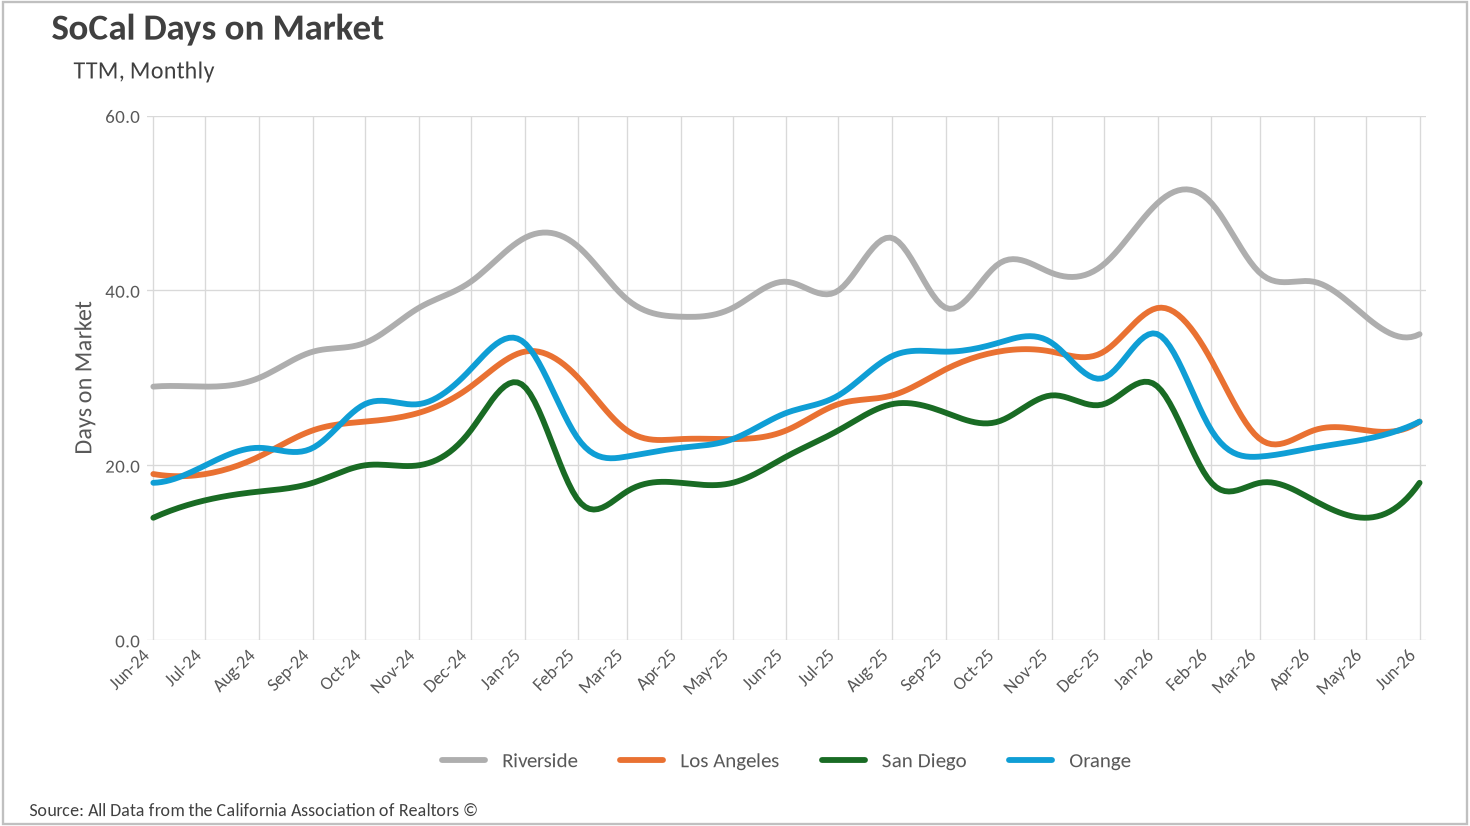
Days on market told an encouraging story almost everywhere. San Diego remains the fastest market in the region at 18 days, up from May's series-low 14 but still 14.29% quicker than last June's 21 days. Orange County came in at 25 days, a one-day improvement over June 2025 that broke a three-month streak of flat year-over-year readings. Los Angeles was the lone exception, ticking from 24 days in May to 25 in June and landing one day slower than a year ago, though at that scale the change is closer to noise than signal.
Riverside deserves particular attention here. At 35 days, it remains the slowest market in the region by a wide margin, but it is also improving the fastest. That is a six-day improvement from June 2025's 41 days, a 14.63% gain, and it extends a remarkable four-month acceleration from January and February's 50-day readings. Riverside is the only one of the four counties where days on market actually fell month over month, down from 37 in May. For context, this is the quickest Riverside has moved since the summer of 2024, and it suggests the county's flat pricing is doing exactly what flat pricing is supposed to do, which is clear inventory.
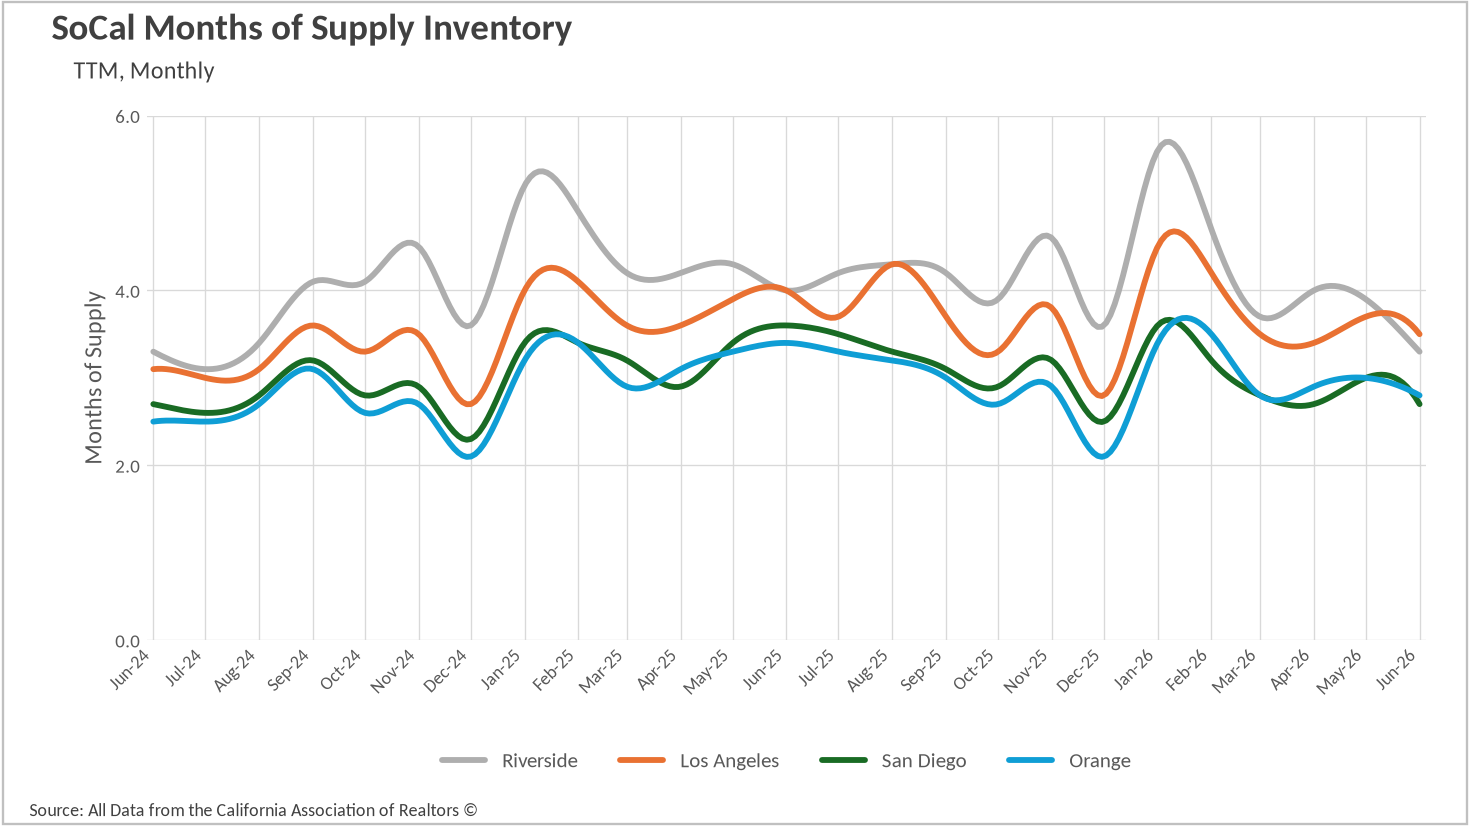
When determining whether a market is a buyers’ market or a sellers’ market, we look to the Months of Supply Inventory (MSI) metric. The state of California has historically averaged around three months of MSI, so any area with at or around three months of MSI is considered a balanced market. Any market that has lower than three months of MSI is considered a seller’s market, whereas markets with more than three months of MSI are considered buyers’ markets.
Every market in Southern California tightened on a year-over-year basis in June, which is the single most important takeaway from this month's numbers. San Diego sits at 2.7 months of supply, down 25% from the 3.6 months it carried last June and squarely on the seller's side of the line. Orange County is right behind at 2.8 months, a 17.65% improvement over last year's 3.4 and enough to nudge the county back below the three-month threshold. Riverside made the most striking single-month move, dropping from 3.9 months in May to 3.3 in June, a 15.38% decline that leaves it 17.5% below last June's 4.0 months and marks its tightest reading since July 2024. Los Angeles rounds out the group at 3.5 months, down from 3.7 in May and 12.5% below last June's 4.0.
Technically, that leaves Riverside and Los Angeles on the buyers' side of the line, but the label is doing a lot less work than it did a year ago. Both counties are inside half a month of balanced conditions, both have inventory that is flattening or falling, and both are moving in the same direction as their coastal neighbors. If listings roll over from their July peak as they typically do, the region could spend the back half of the year with three or even four of its major counties operating at or below balanced supply. Sellers across Southern California are in a materially stronger negotiating position than they were last summer, and buyers who have been waiting for the inventory glut to deliver leverage should recognize that the window has largely closed.
|
Stay up to date on the latest real estate trends.
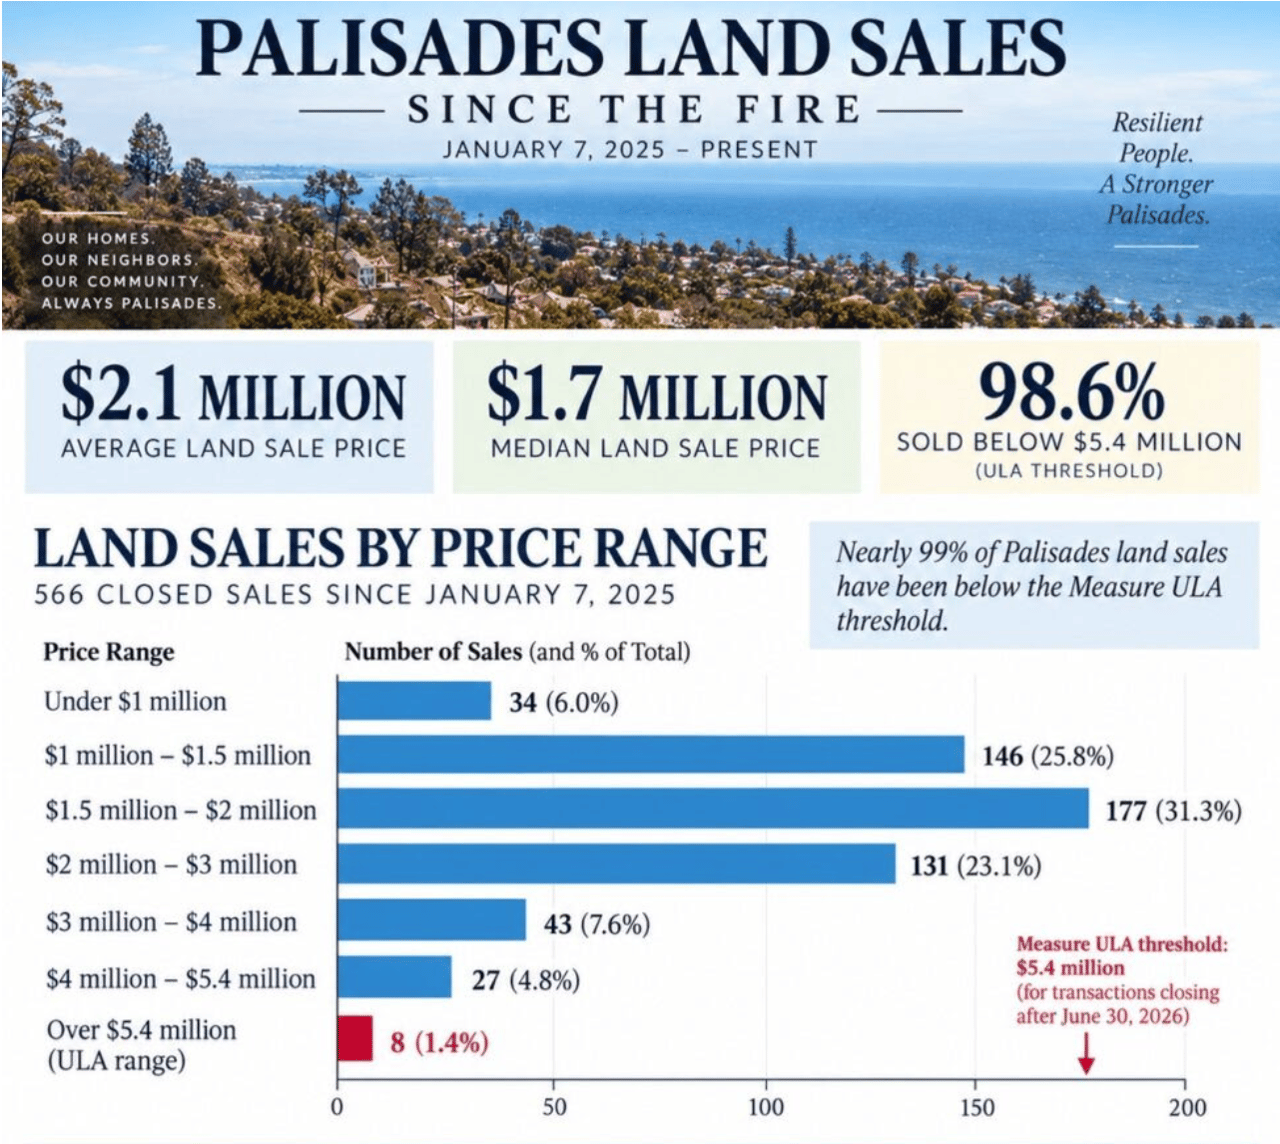
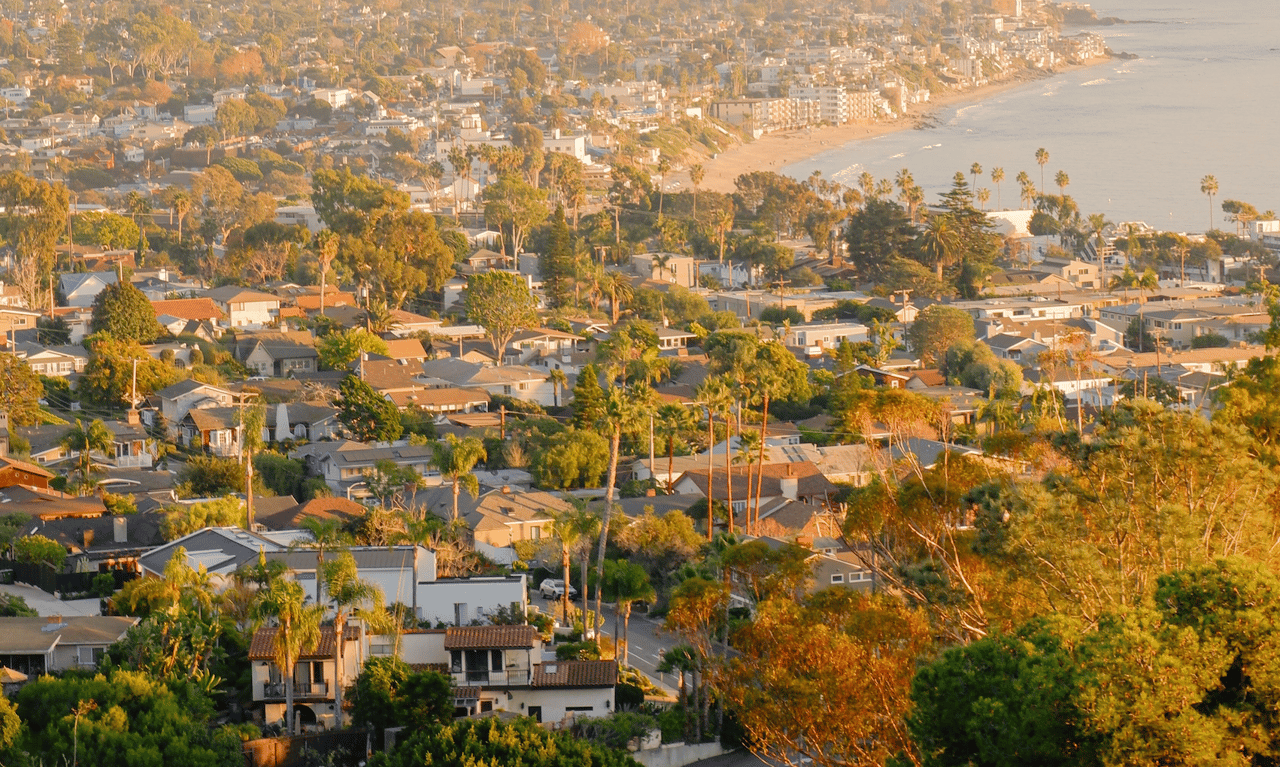
Foreclosure activity has risen since 2025, but the latest numbers remain a small fraction of the Palisades housing market.
October 2026

September 2026
August 2026
July 2026
A Closer Look at Dallas Rental Prices, Hidden Costs, and What Renters Need to Know Before Moving
You’ve got questions and we can’t wait to answer them.