Palisades Pulse Part 1 | October 2026

Written By Anthony Marguleas | October 12, 2026
It’s hard to believe it has been 21 months since the devastating Palisades fire. My family and I lost our home and my office, and we’re rebuilding, just like so many of our neighbors. I know these decisions are about much more than real estate.
I’ve been selling real estate in the Palisades for over 30 years. Since the fire, we have helped 106 families sell, buy, or lease their properties. I wanted to share the trends we’re seeing and, more importantly, what they mean for homeowners deciding whether to sell, rebuild, rent or wait.
The Palisades is not one single market. A cleared lot, an existing home, a condo and a Riviera estate each face different supply and demand. Here is what the data tells us.
A note about the data
If you've compared various real estate newsletters, media reports or online statistics, you may have noticed that Palisades sales figures do not always match. Differences in reporting periods, geographic boundaries and property classifications can all affect the results.
Why fire-damaged property classifications matter
Following the fire, many off market burned lots were miscategorized in MLS records as home transactions rather than land sales. This distorted comparisons of land and existing-home activity. Our team reviewed transactions property by property to identify the appropriate category. The MLS has reportedly addressed the issue. Together with our property-by-property review along with the recent MLS correction, gives us greater confidence that the figures in this report accurately reflect the market.
Our approach
The figures in this edition reflect the supplied October 7, 2026 MLS exports and the definitions noted beside each chart. Small samples, relistings and differences in property mix can still affect comparisons. Our aim is to explain the numbers and what they mean, rather than imply that any one statistic tells the whole story.
What to watch
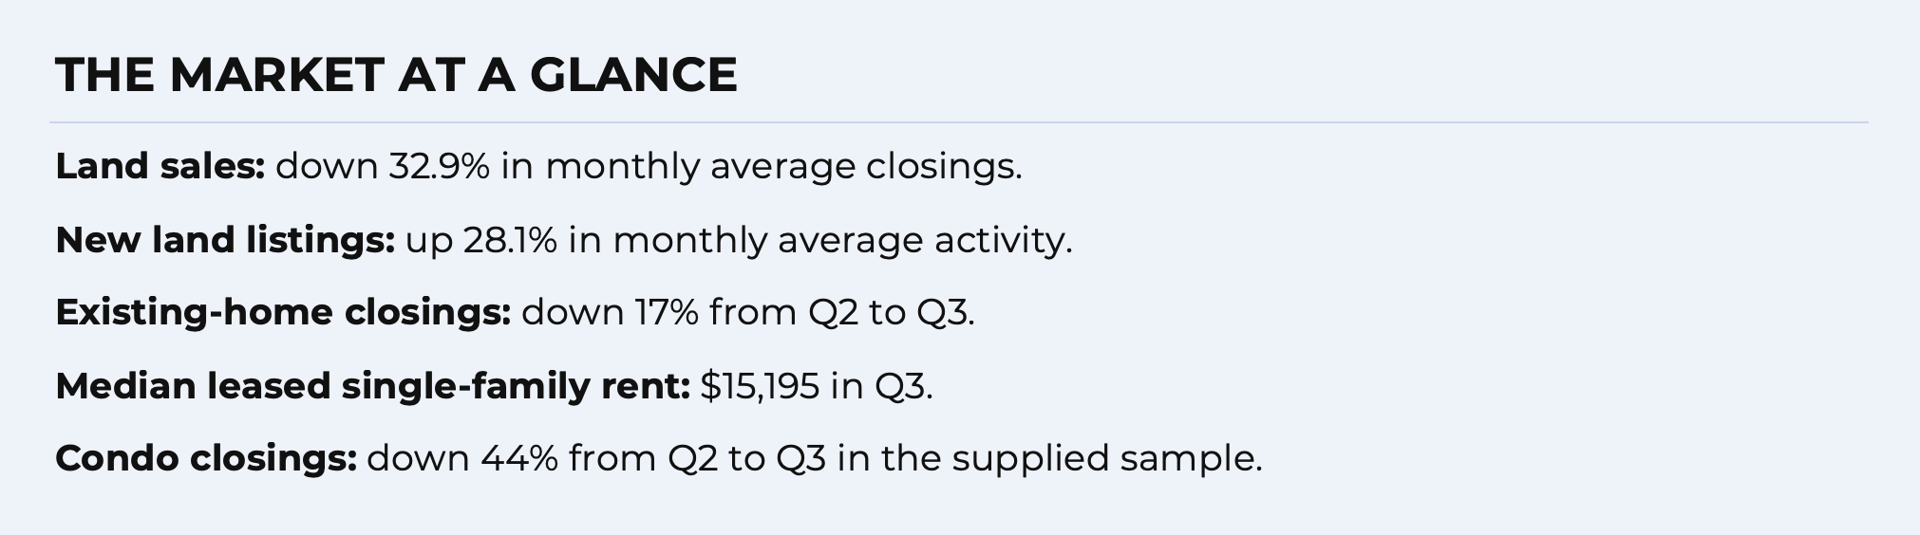
Land closings slowed while new listings increased. Existing-home sales also eased, condos took longer to sell, and the extraordinary post-fire rental surge has normalized. The pages that follow show the supporting evidence and my interpretation.
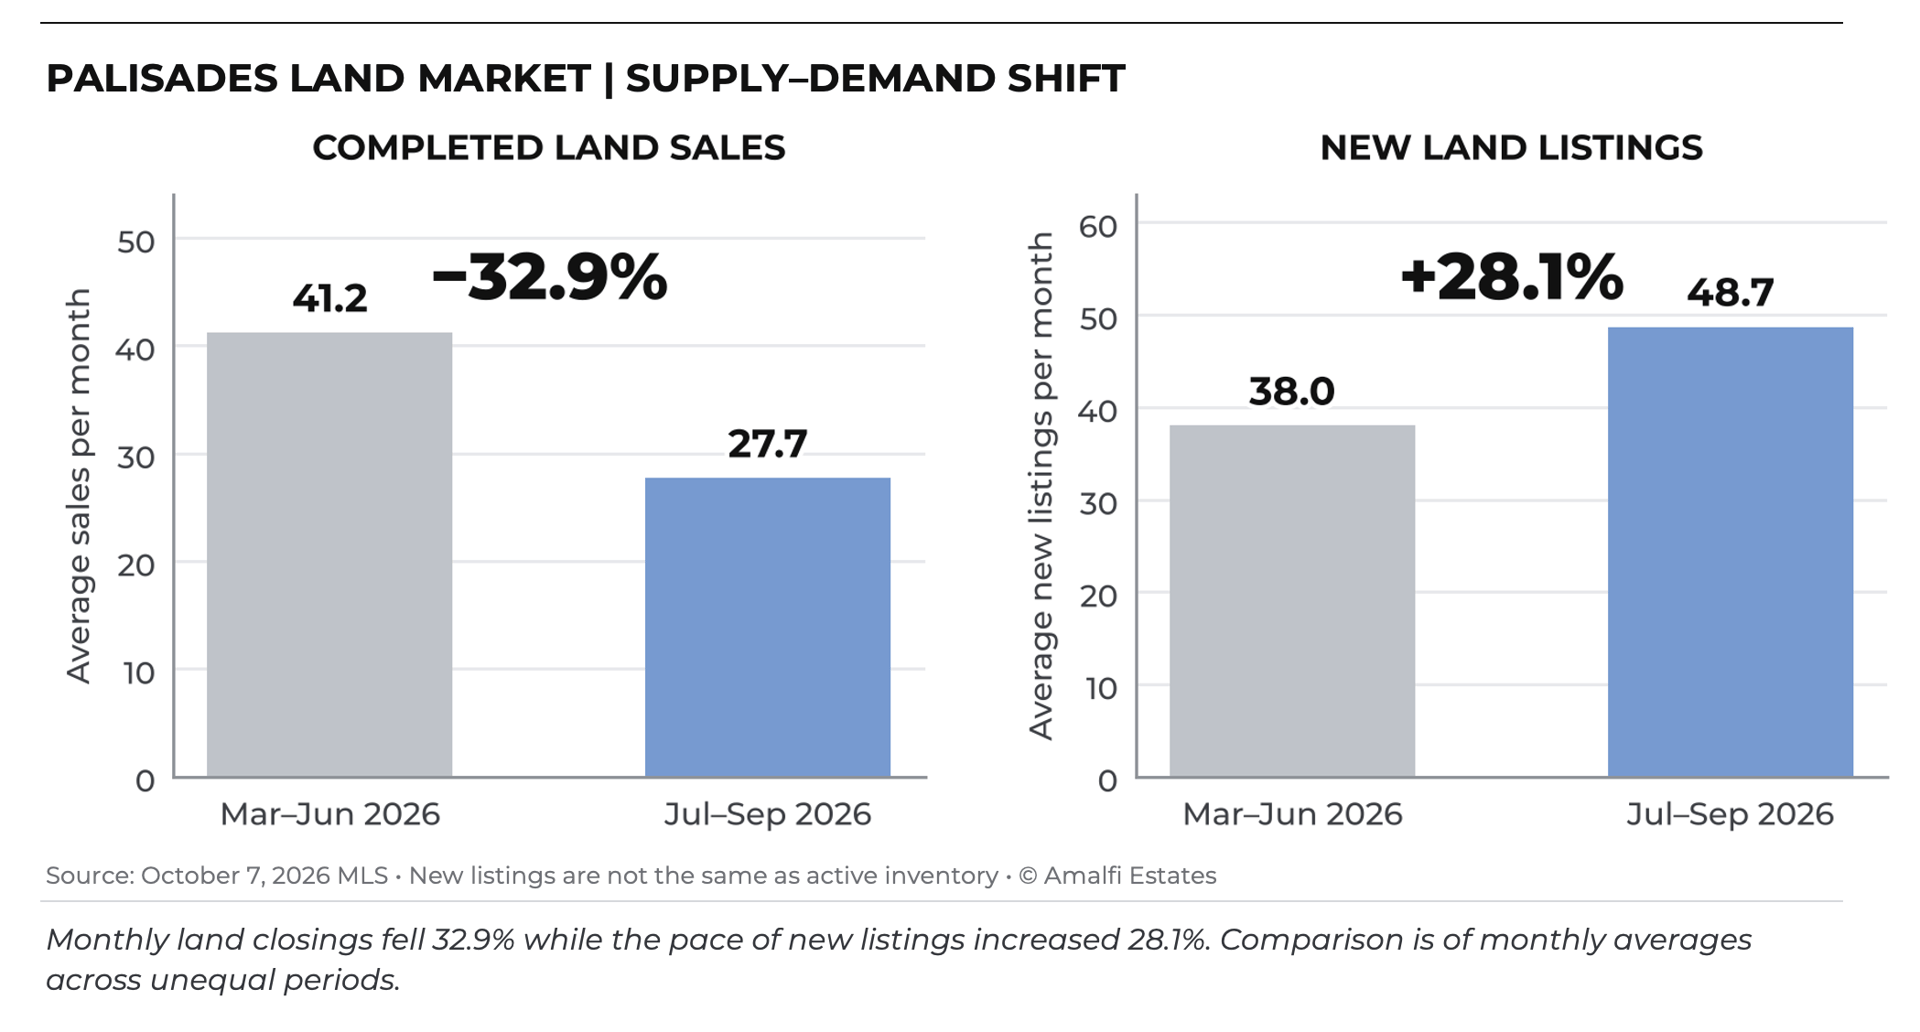
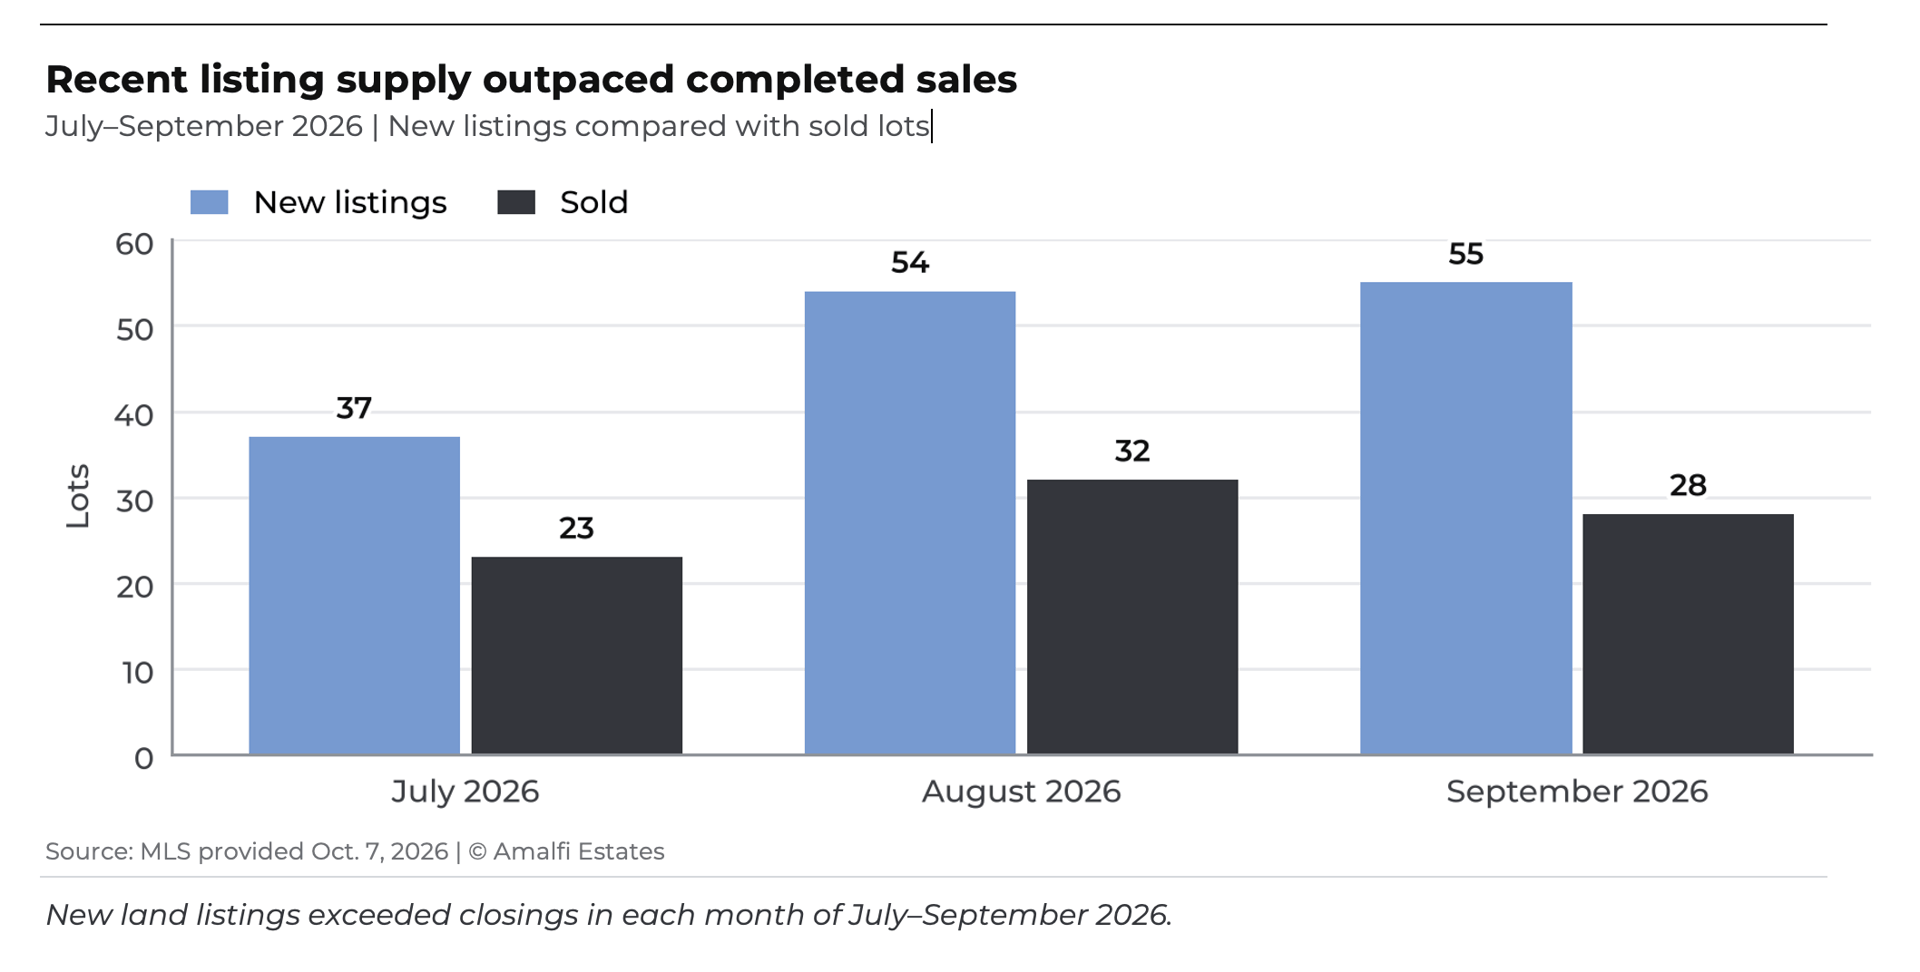
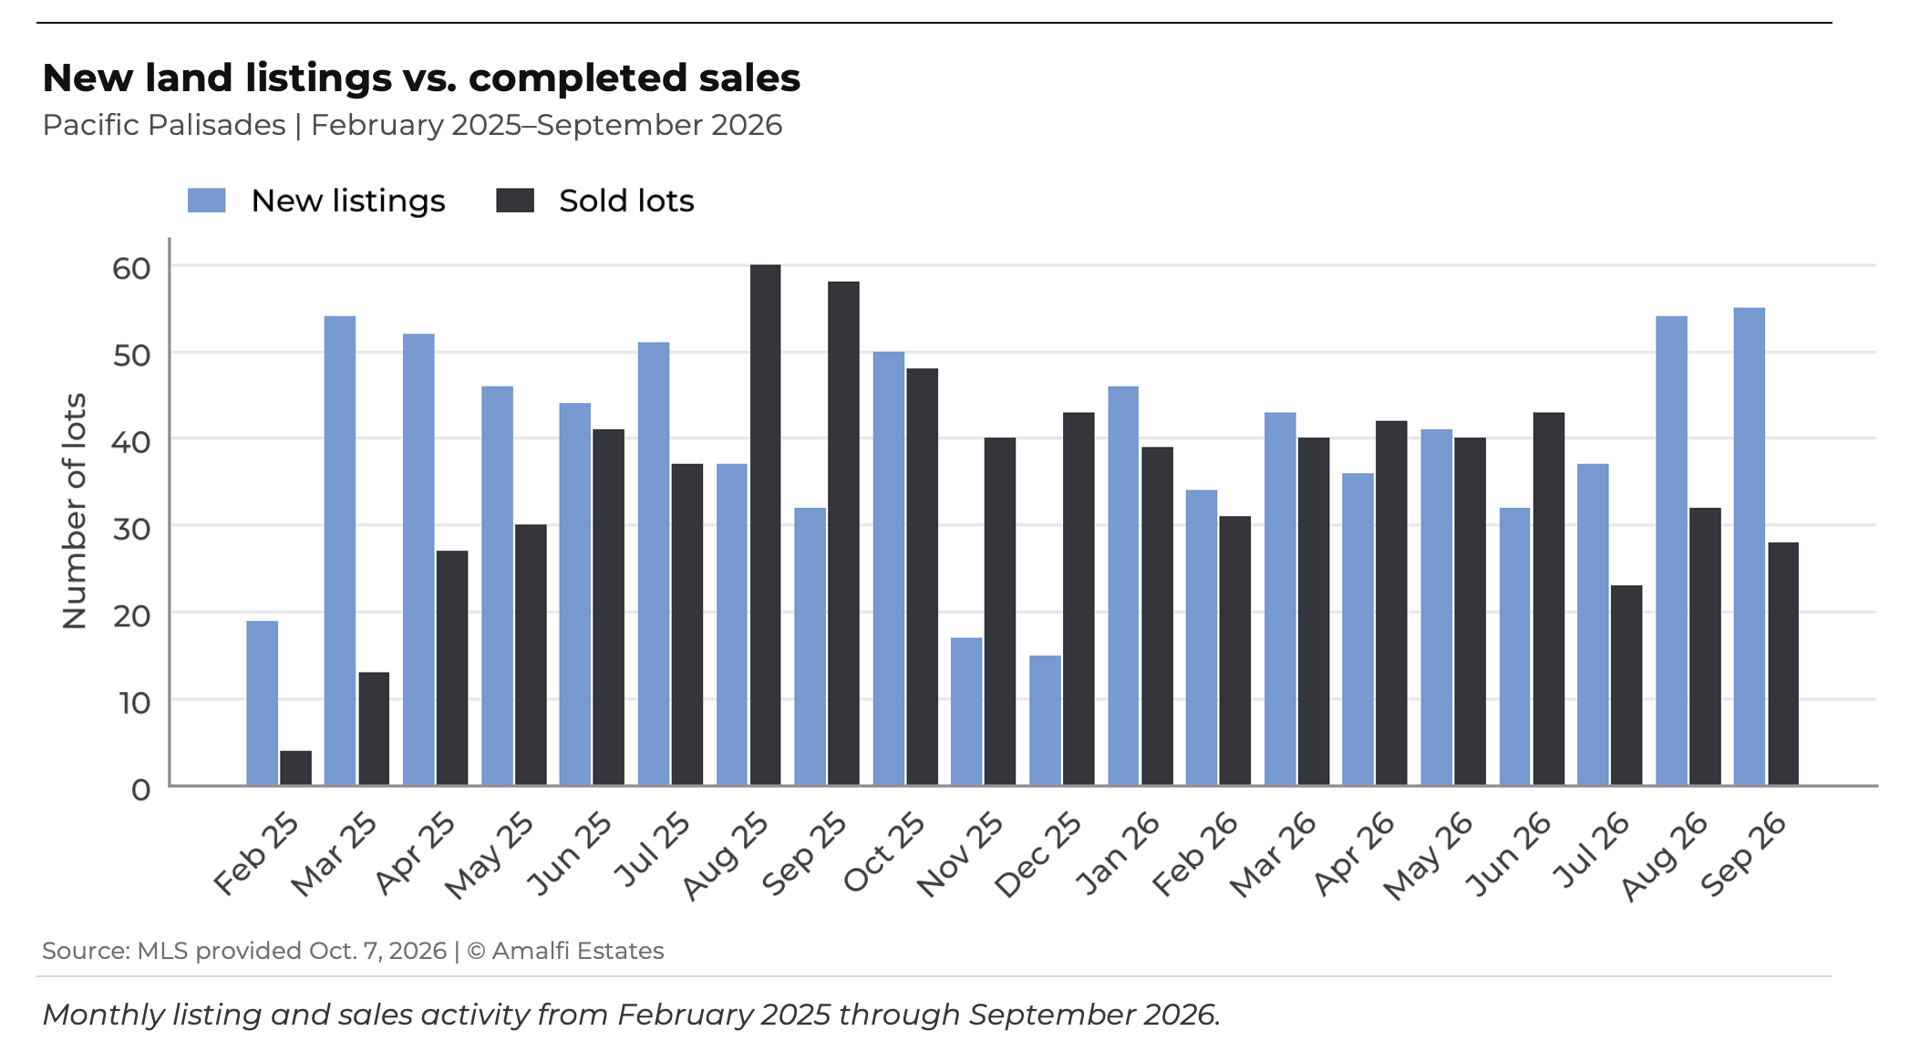
Monthly completed lot sales averaged 41.2 from March through June, then 27.7 from July through September. Meanwhile, monthly new listings increased from 38.0 to 48.7. In the third quarter, 146 new lots came to market while 83 closed.
My take
I’ve been saying for some time that we’re in a buyer’s market for land, and these numbers reinforce that view. Buyers have more choices and more negotiating power. Sellers need to be realistic about pricing, particularly when competing lots offer better views, easier construction or more attractive terms.
What this means for homeowners
If you’re considering selling, compare your property with lots that actually closed, not just the highest asking prices. If you’re buying, remember that topography, soils, utilities, design restrictions and building costs can turn an inexpensive lot into a costly project.
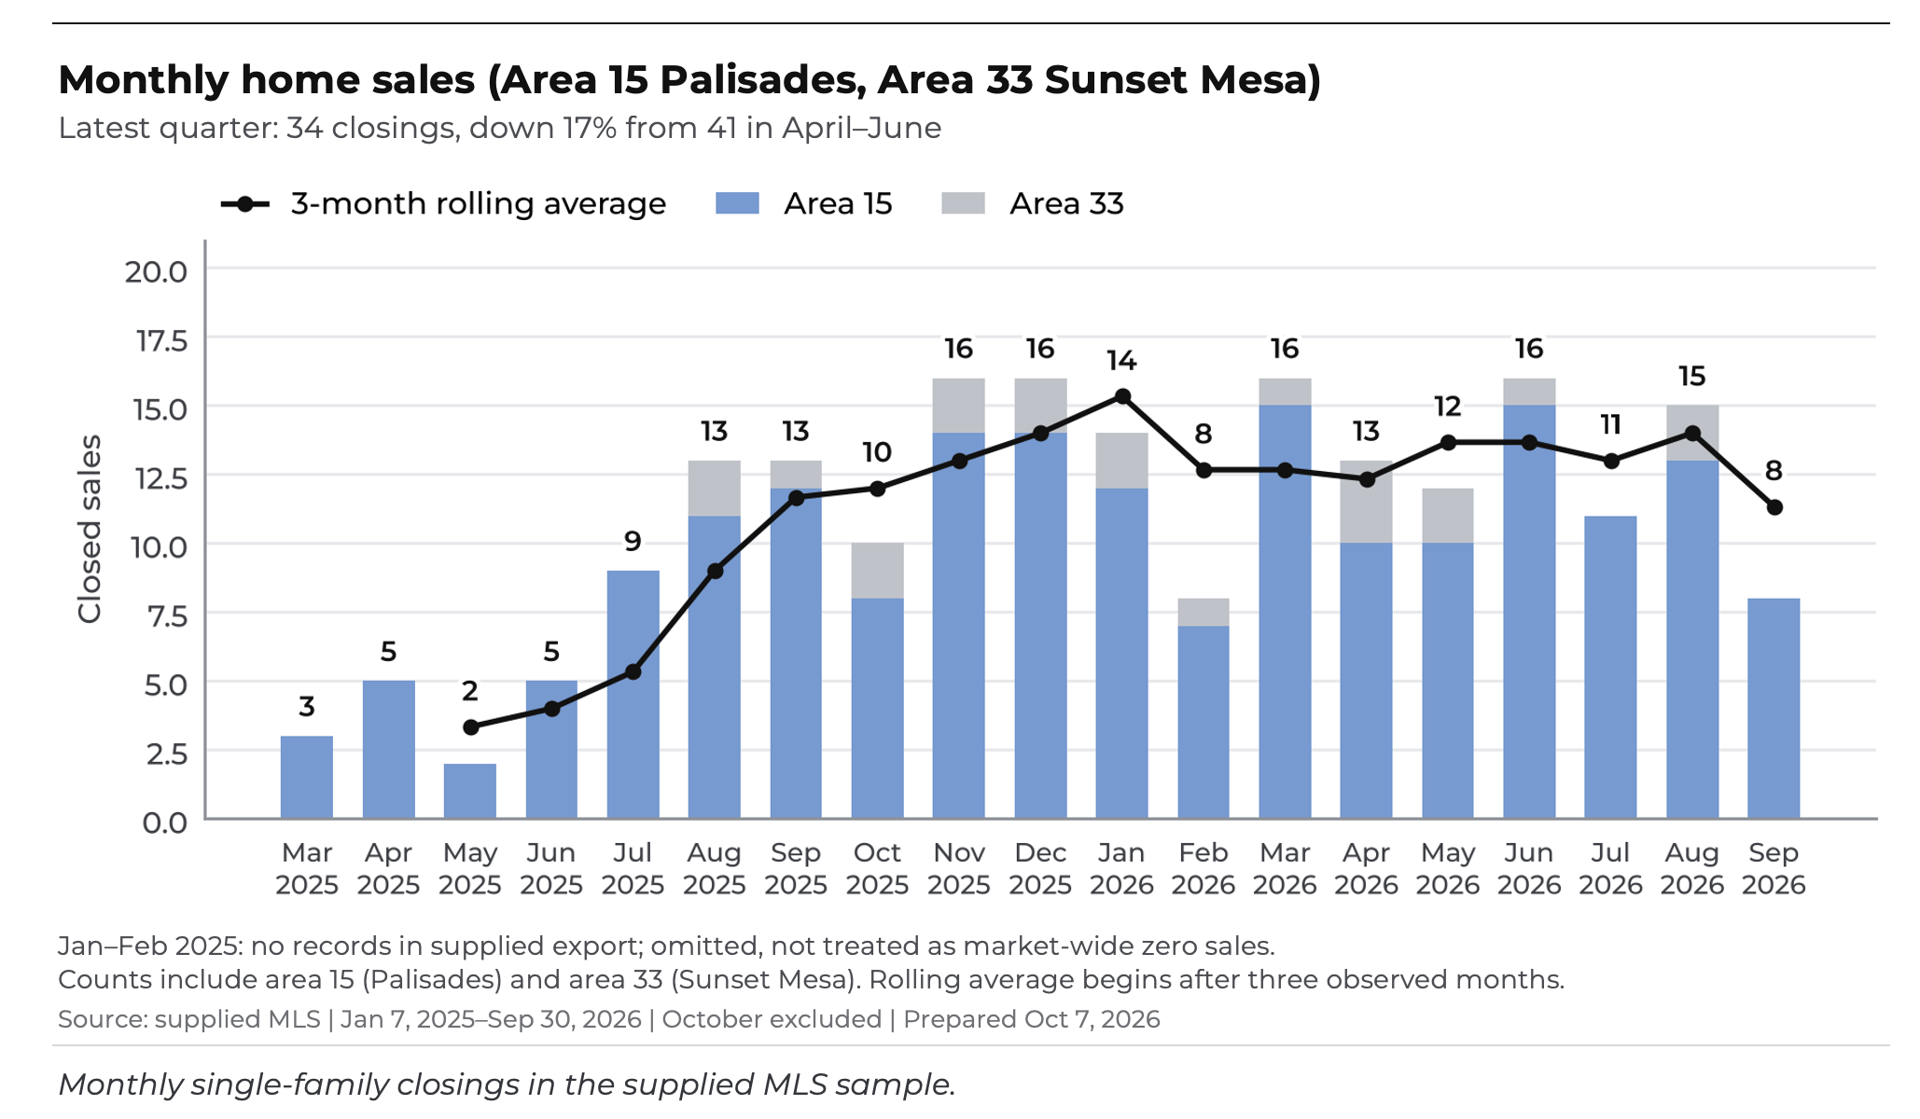
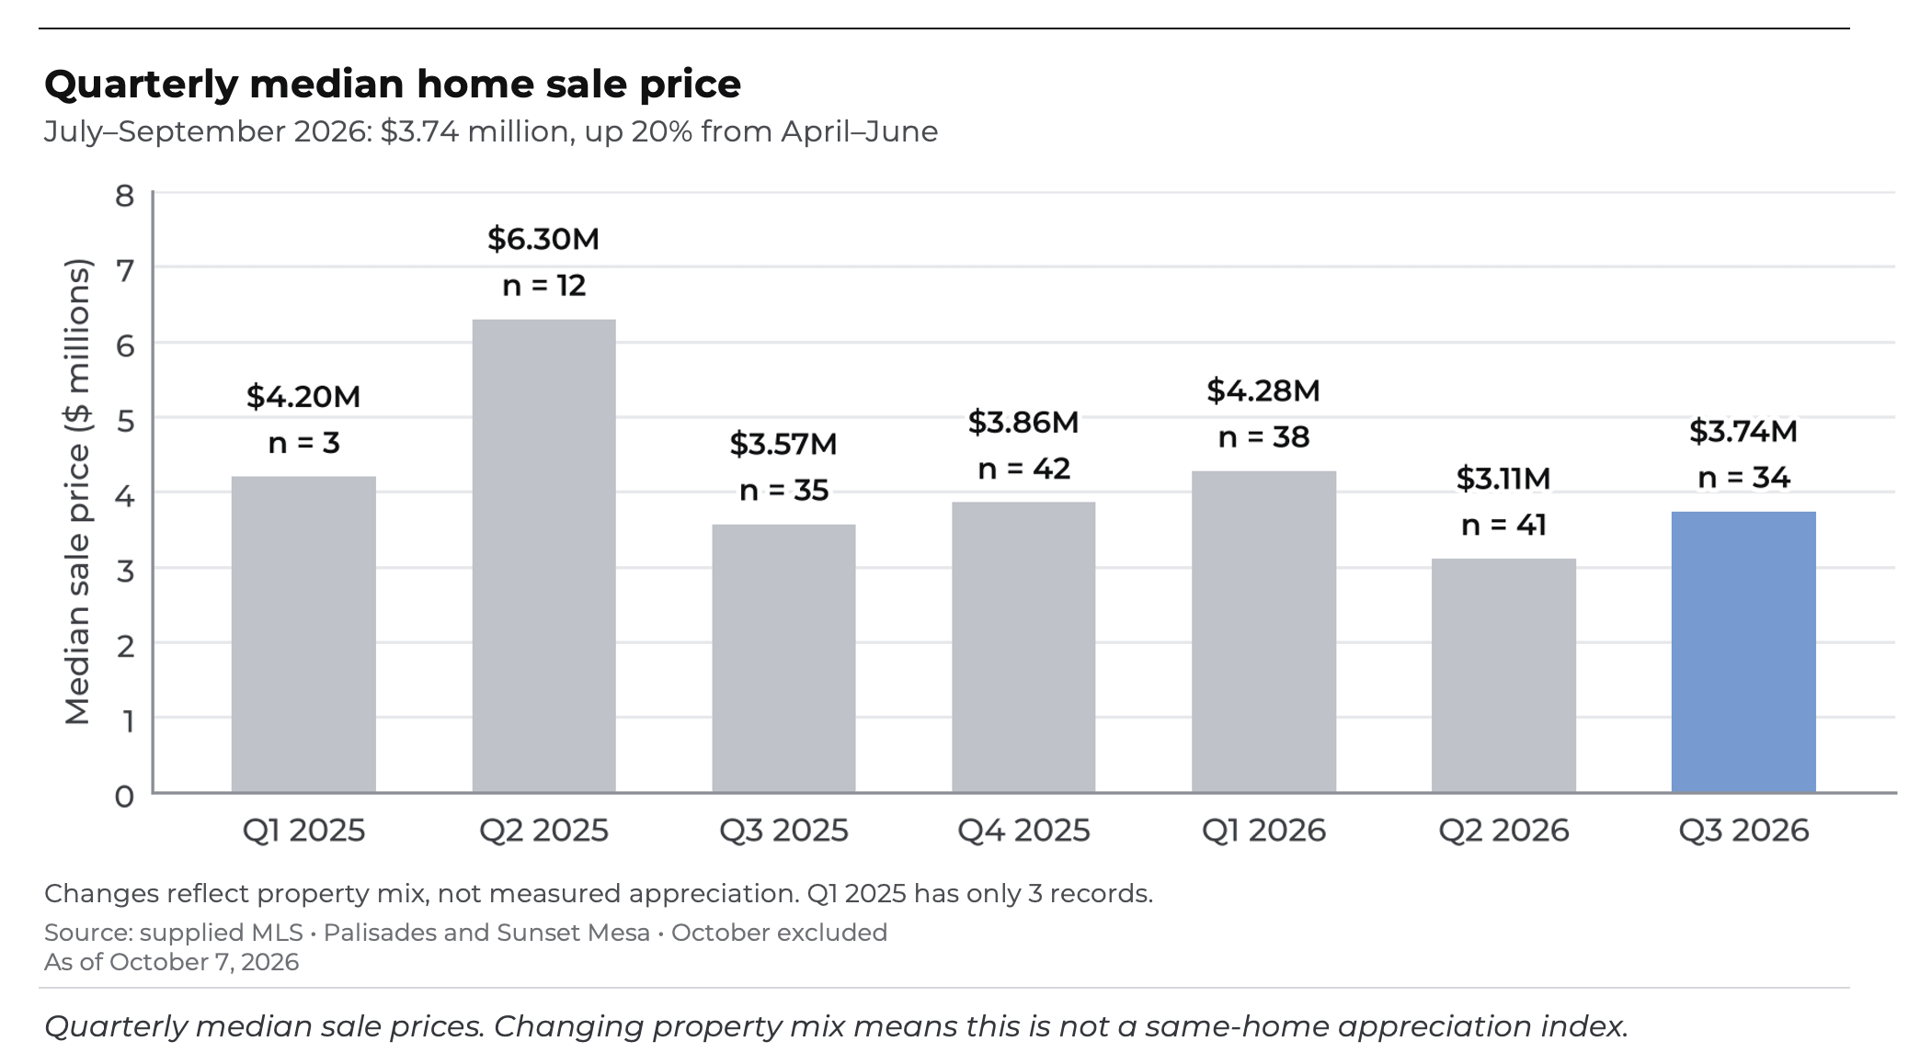
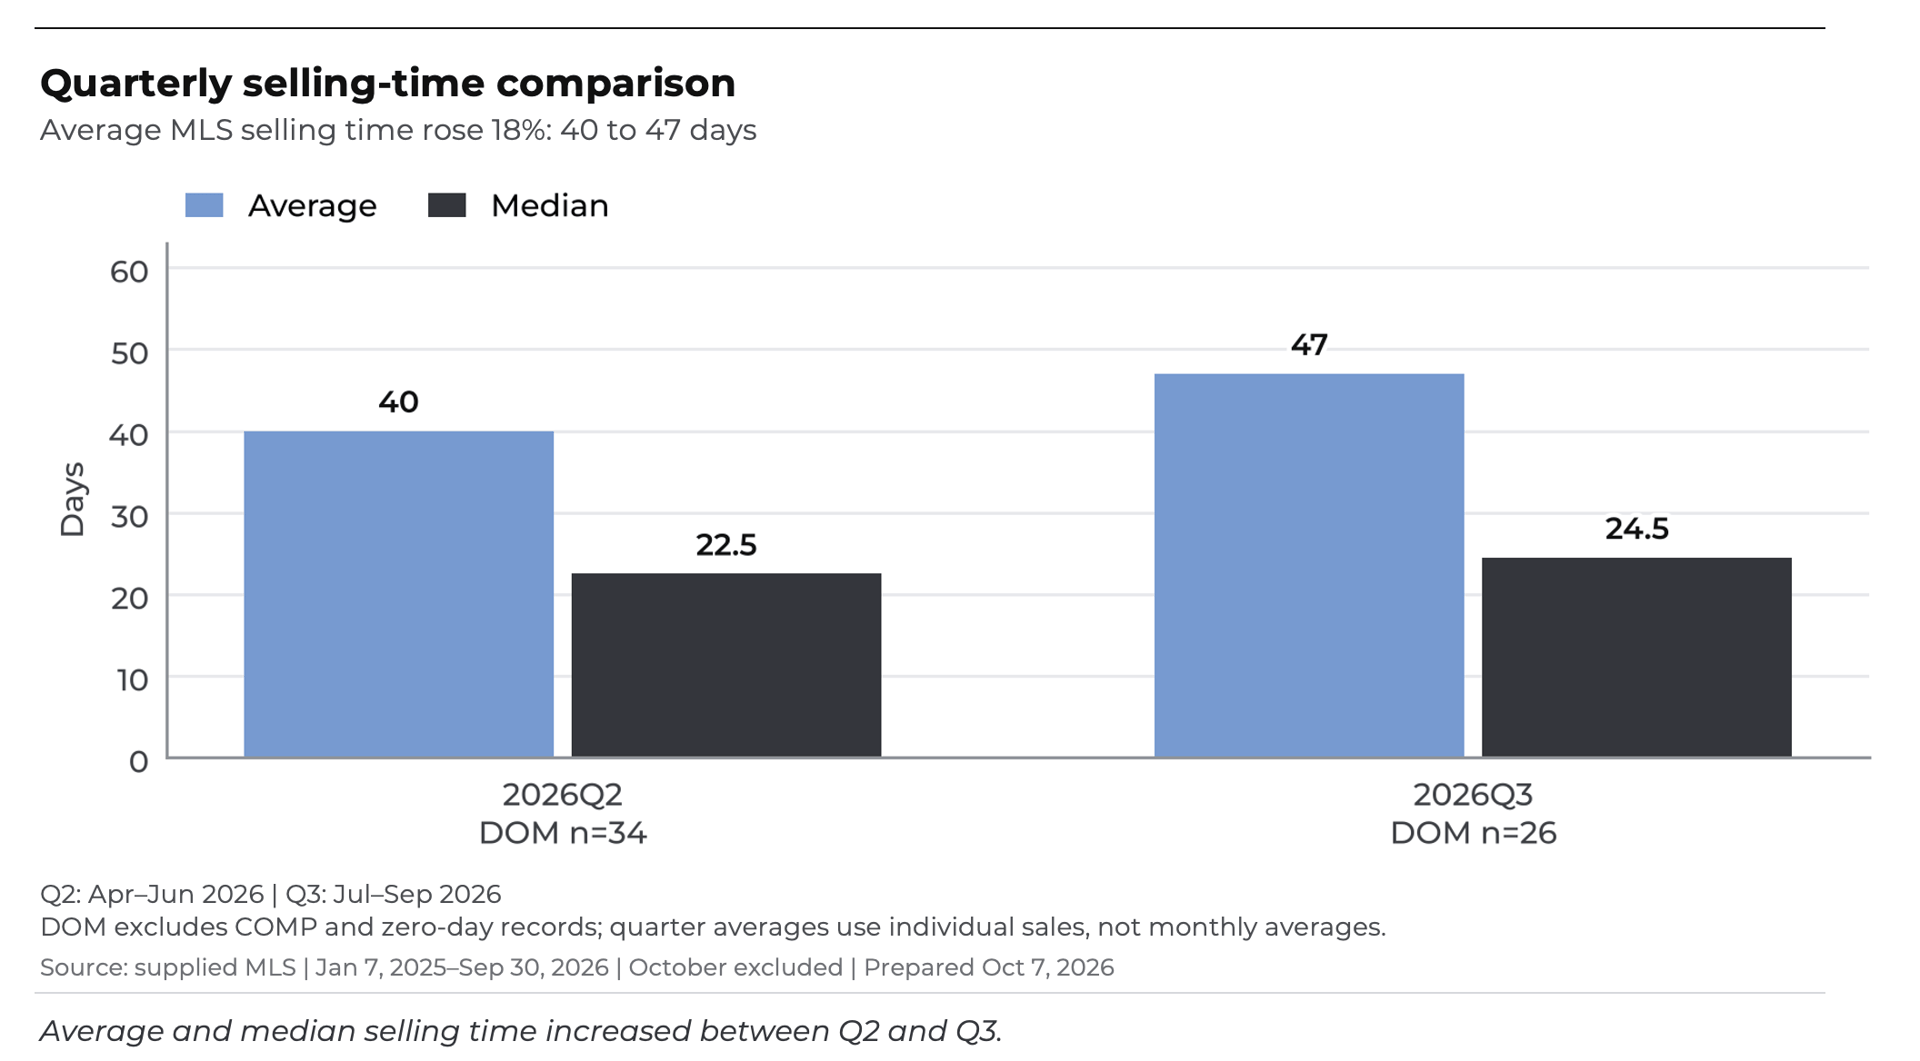
Single-family closings declined from 41 in April–June to 34 in July–September, about 17%. The third-quarter median sale price reached approximately $3.74 million, around 20% above the prior quarter, while average marketing time increased from 40 to 47 days.
My take
I would not interpret a higher quarterly median as proof that every home has appreciated. We’re working with relatively few sales, and the mix of homes sold can change the median substantially. Buyers are willing to pay for the right property, but they’re more selective.
What this means for homeowners
If you’re selling, look closely at the competing homes on the market today. Condition, remediation, location, price changes and marketing history matter. Getting the price right at the beginning is usually better than chasing the market later.
What the data shows
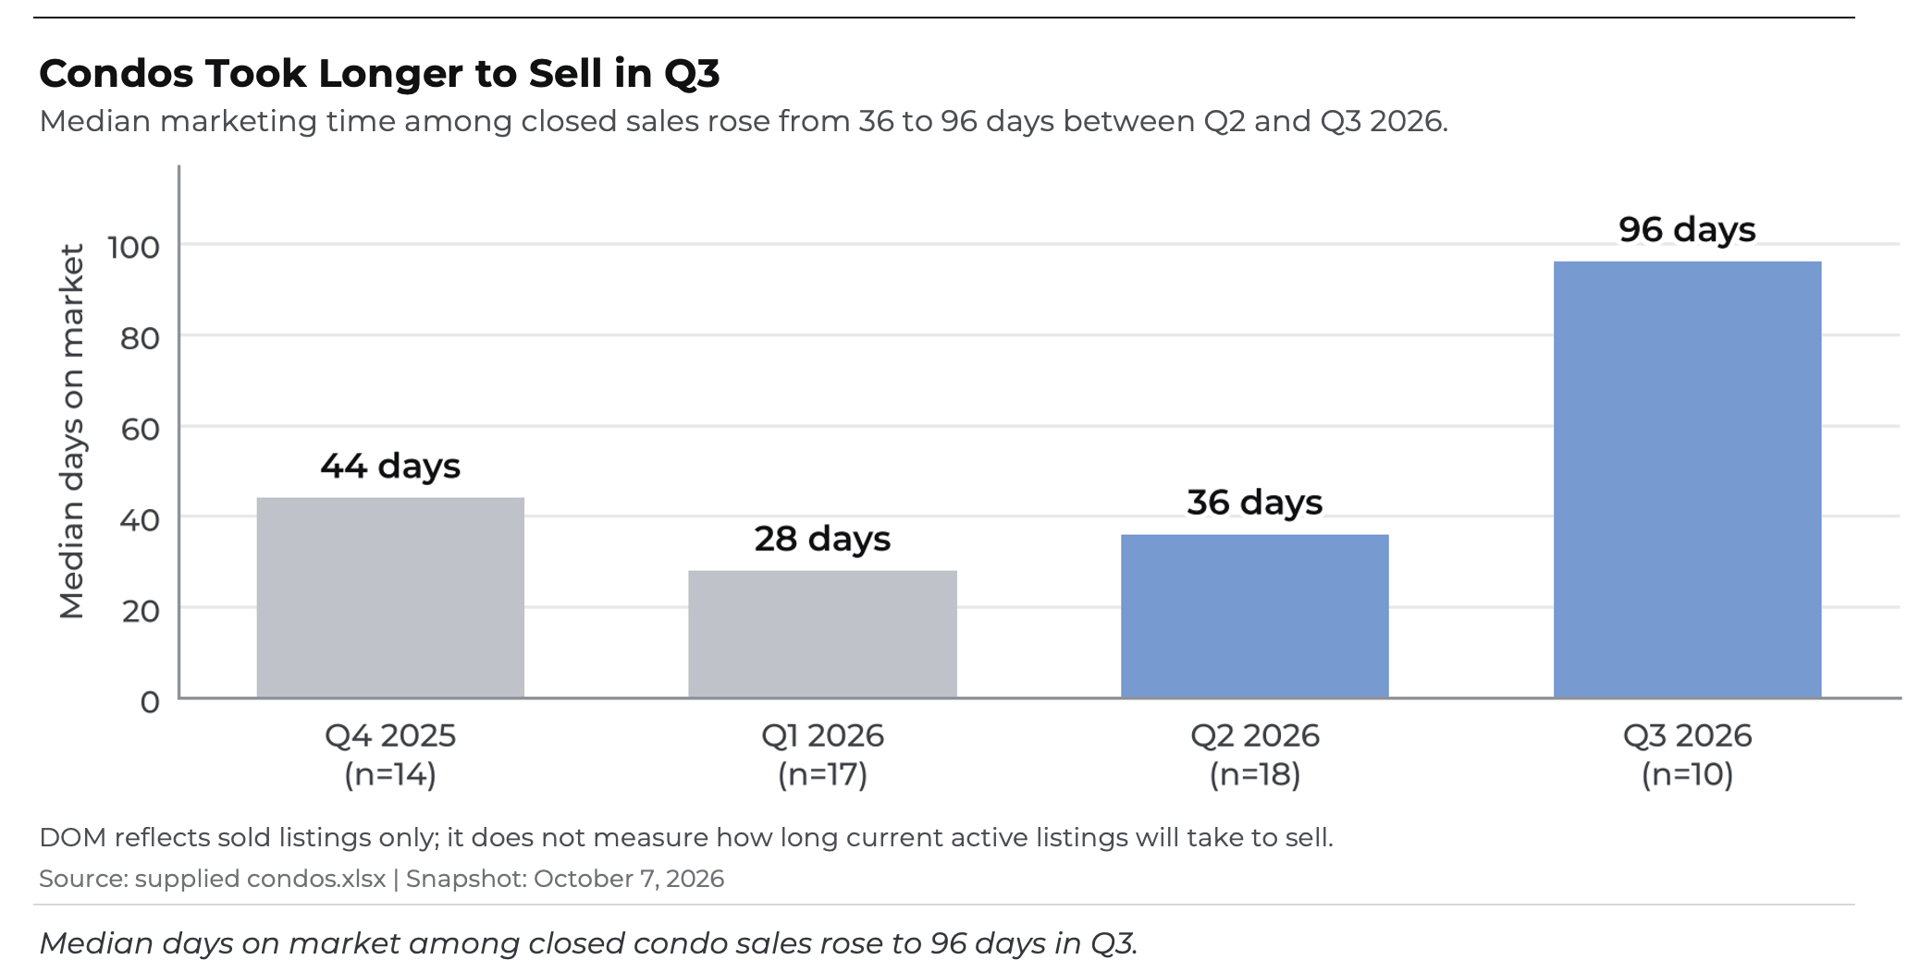
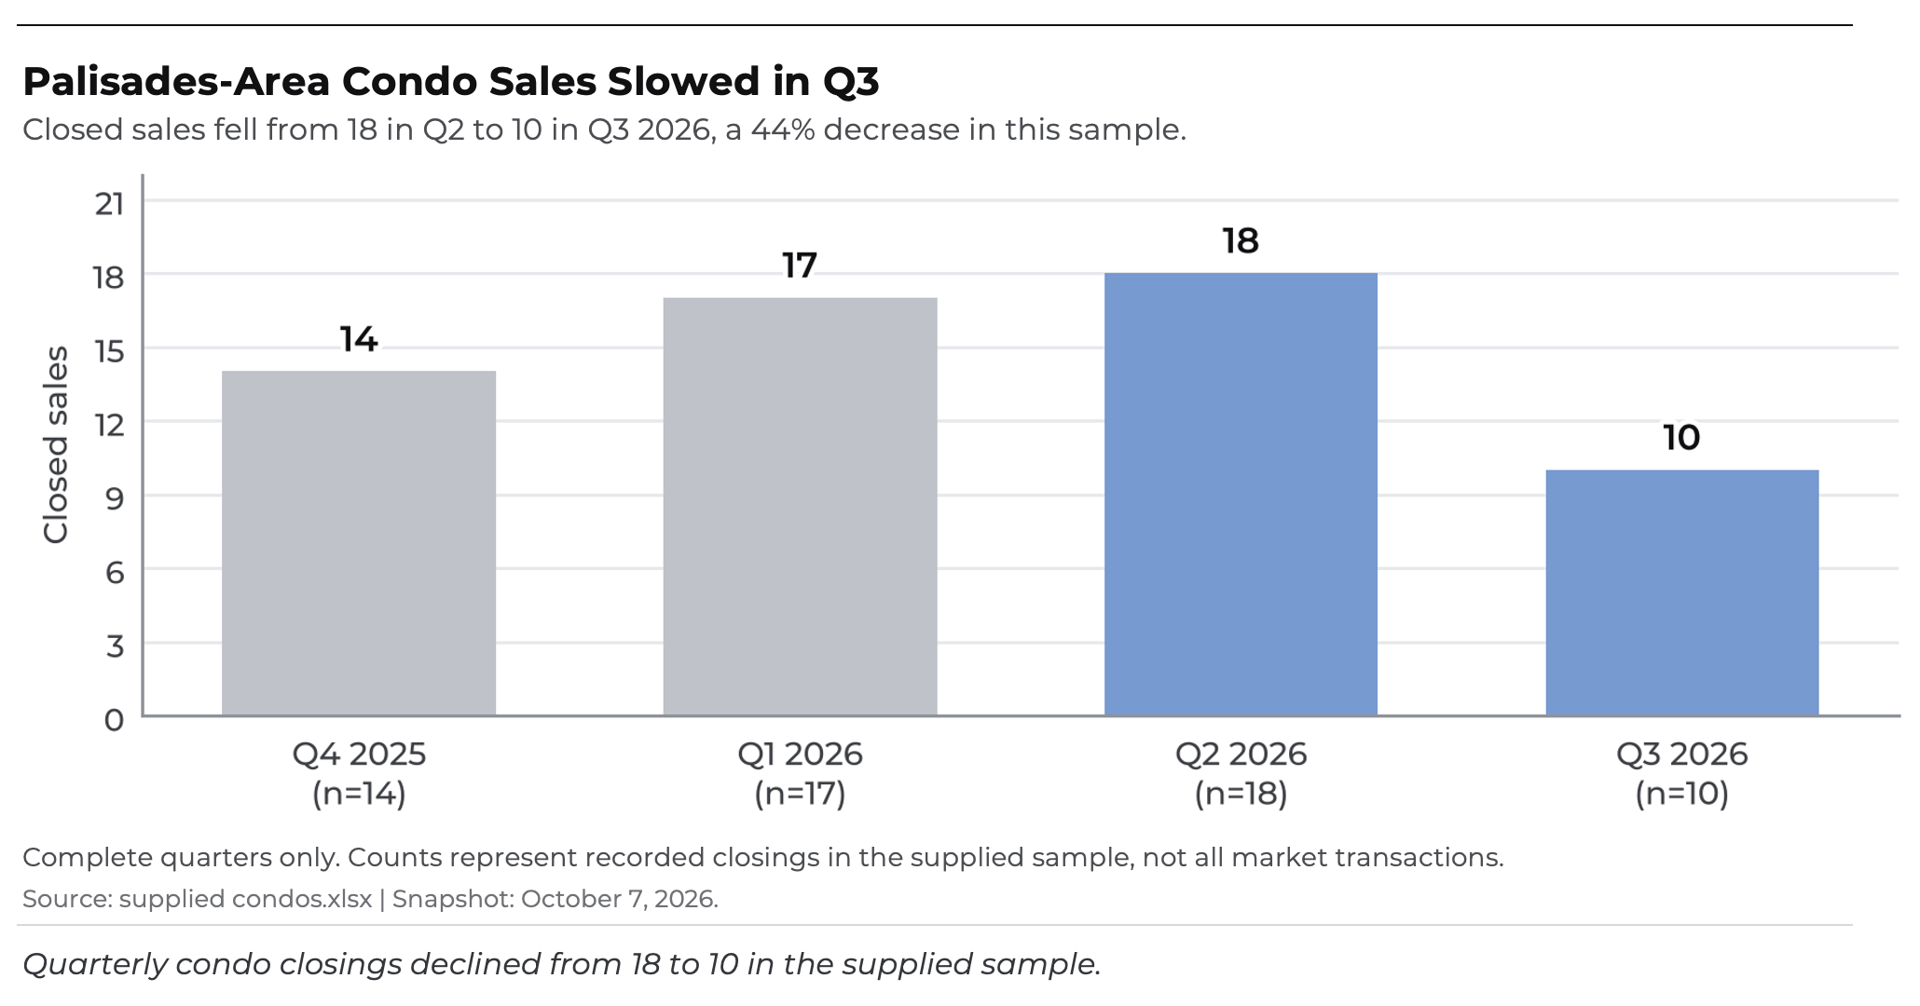
The supplied condo sample recorded 18 closings in the second quarter and 10 in the third, a decline of about 44%. Median marketing time increased from 36 to 96 days.
My take
Condos can offer a more affordable entry point, but that doesn’t mean buyers will overlook price or condition. With only ten third-quarter sales in the sample, a few unusual transactions can shift the statistics.
What this means for homeowners
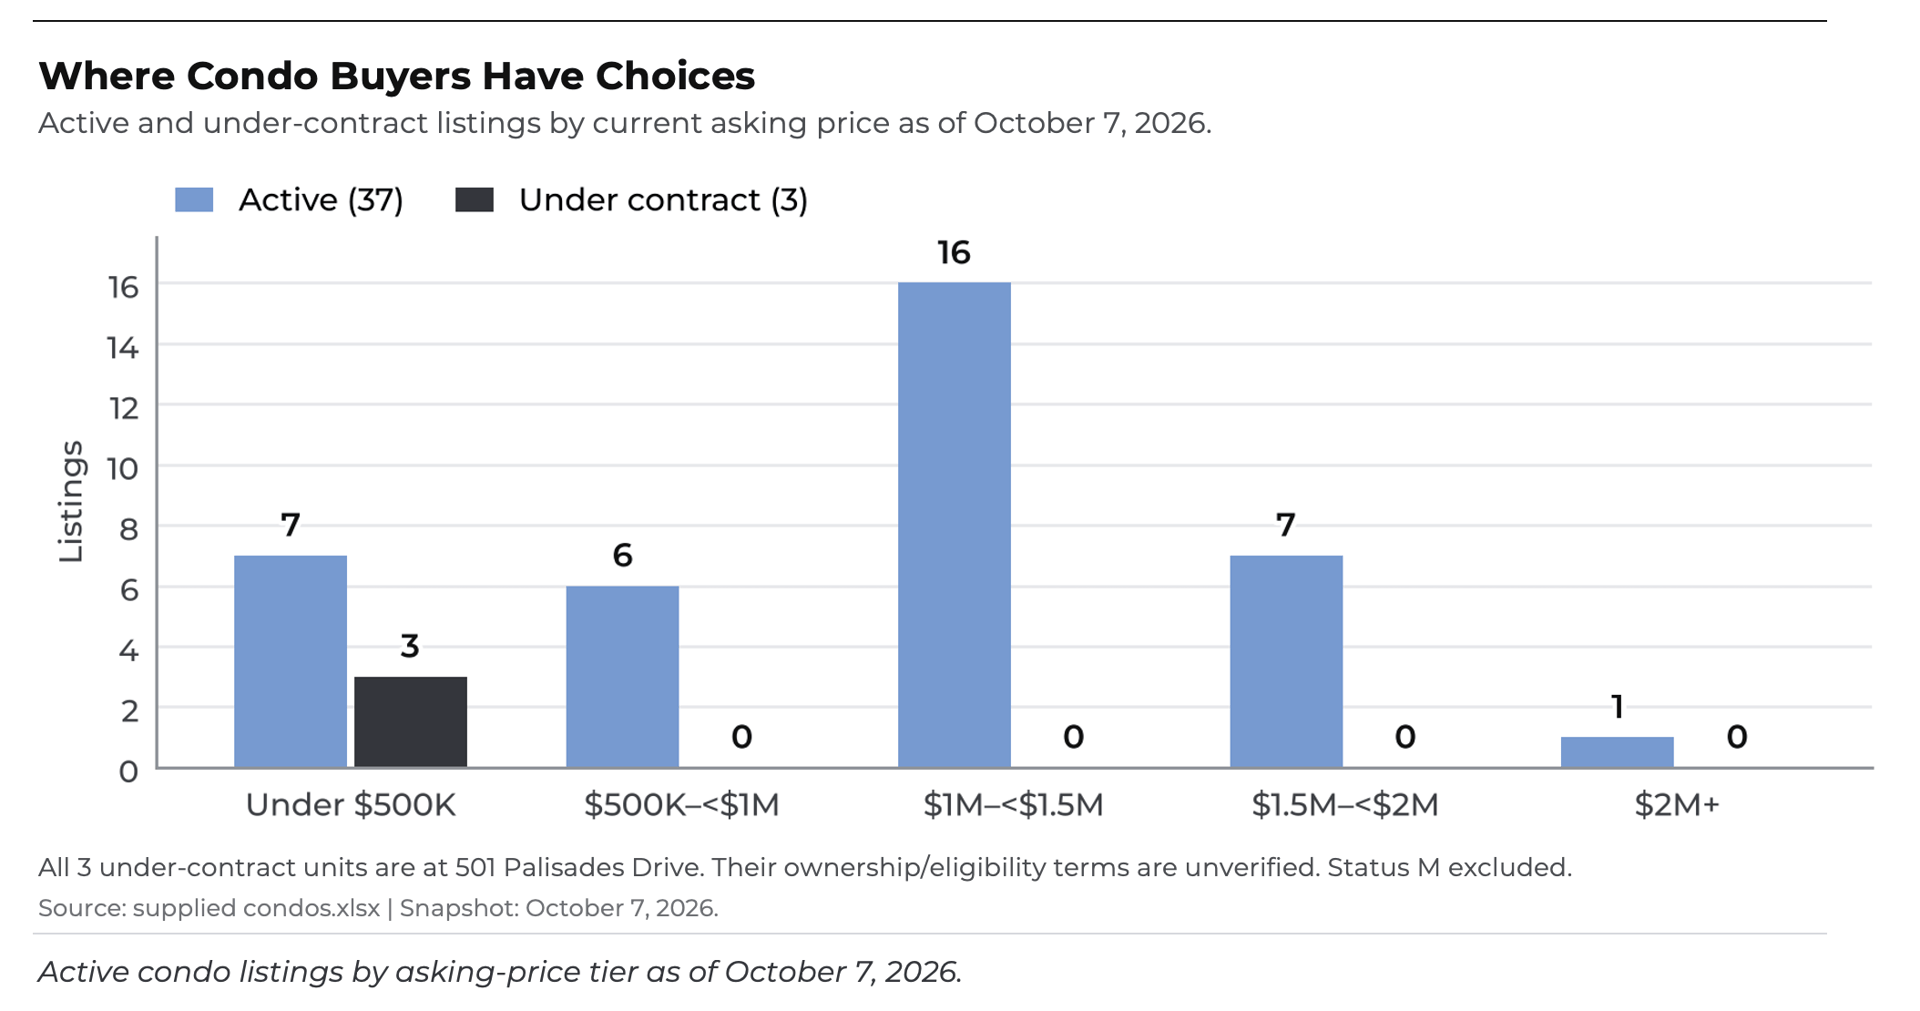
Compare your condo with the most relevant active and recently sold units. HOA costs, condition, location and the supply of competing units are all important.
The Headline
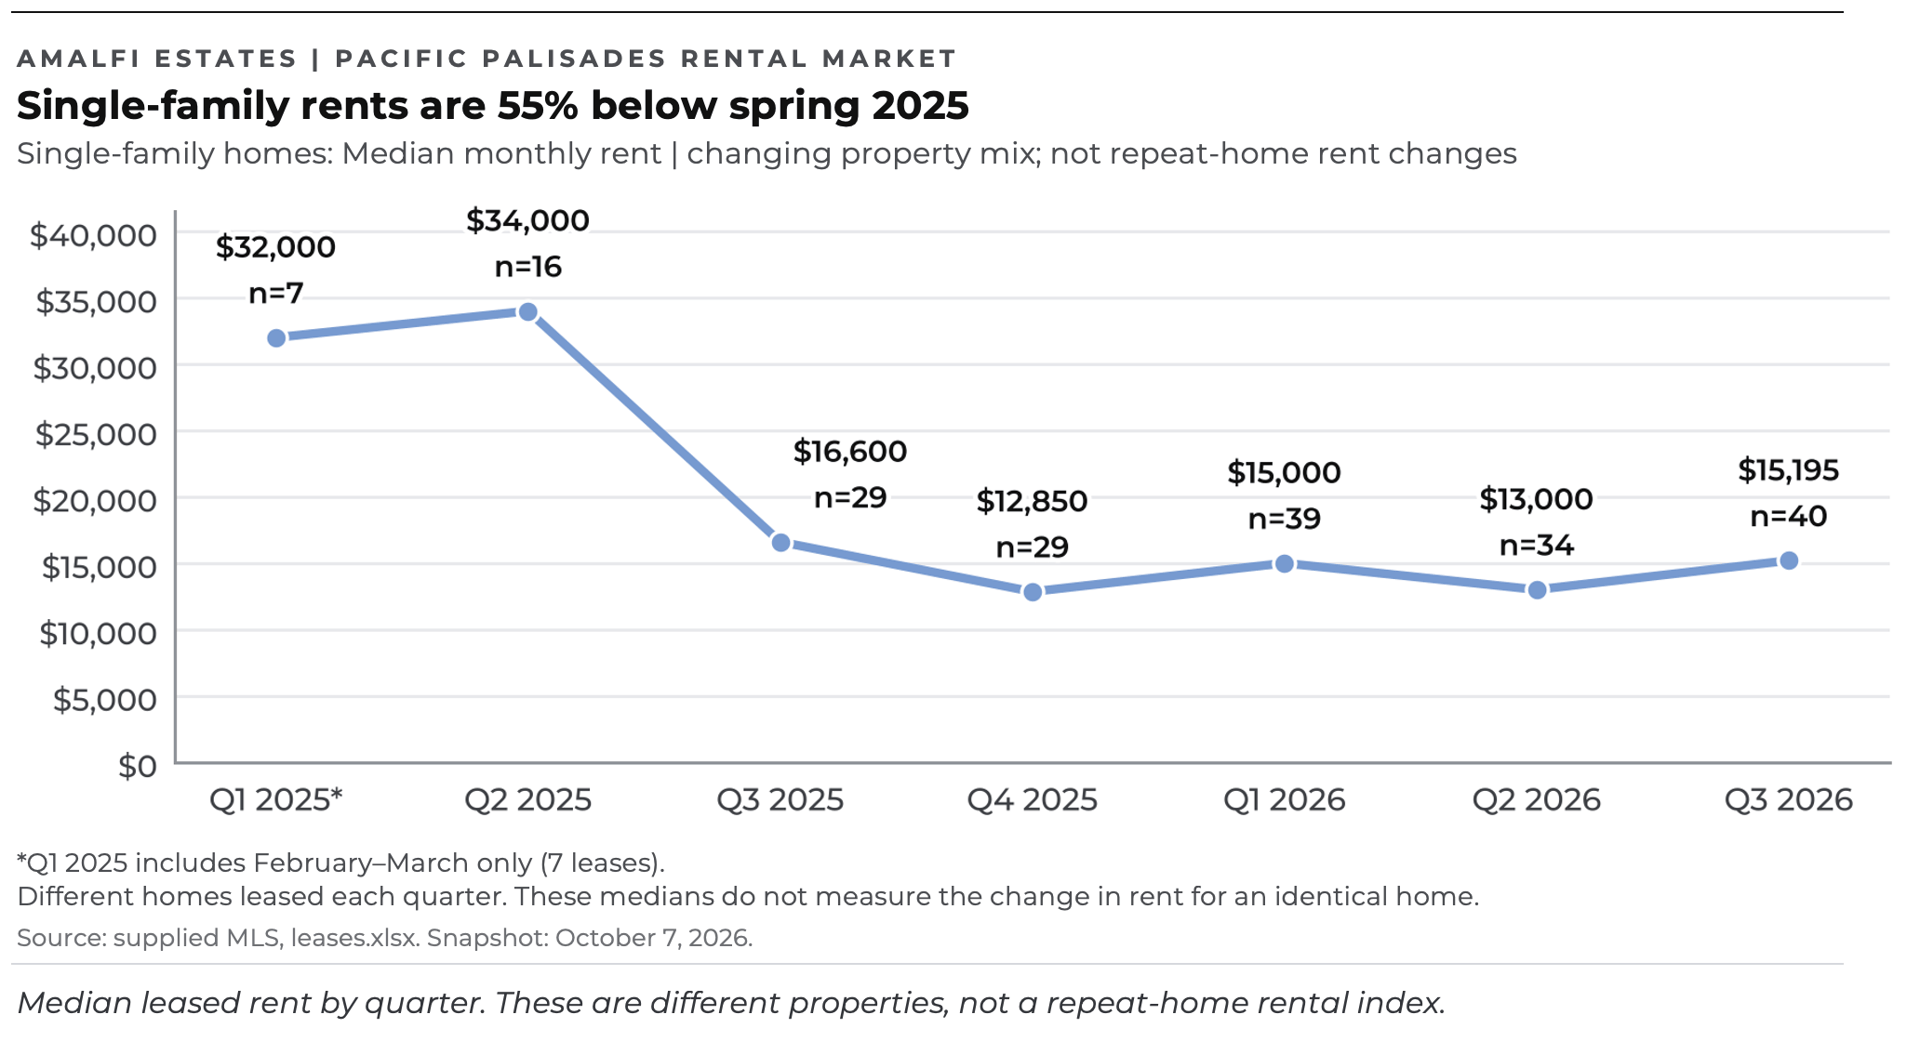
The median rent of leased single-family homes was about $34,000 in the second quarter of 2025 and $15,195 in the third quarter of 2026. The figures represent different homes, not a repeat-property rental index.
My take
The extraordinary demand immediately after the fire was never going to last forever. Landlords who are still pricing based on those emergency conditions may find themselves sitting on the market.
What this means for homeowners
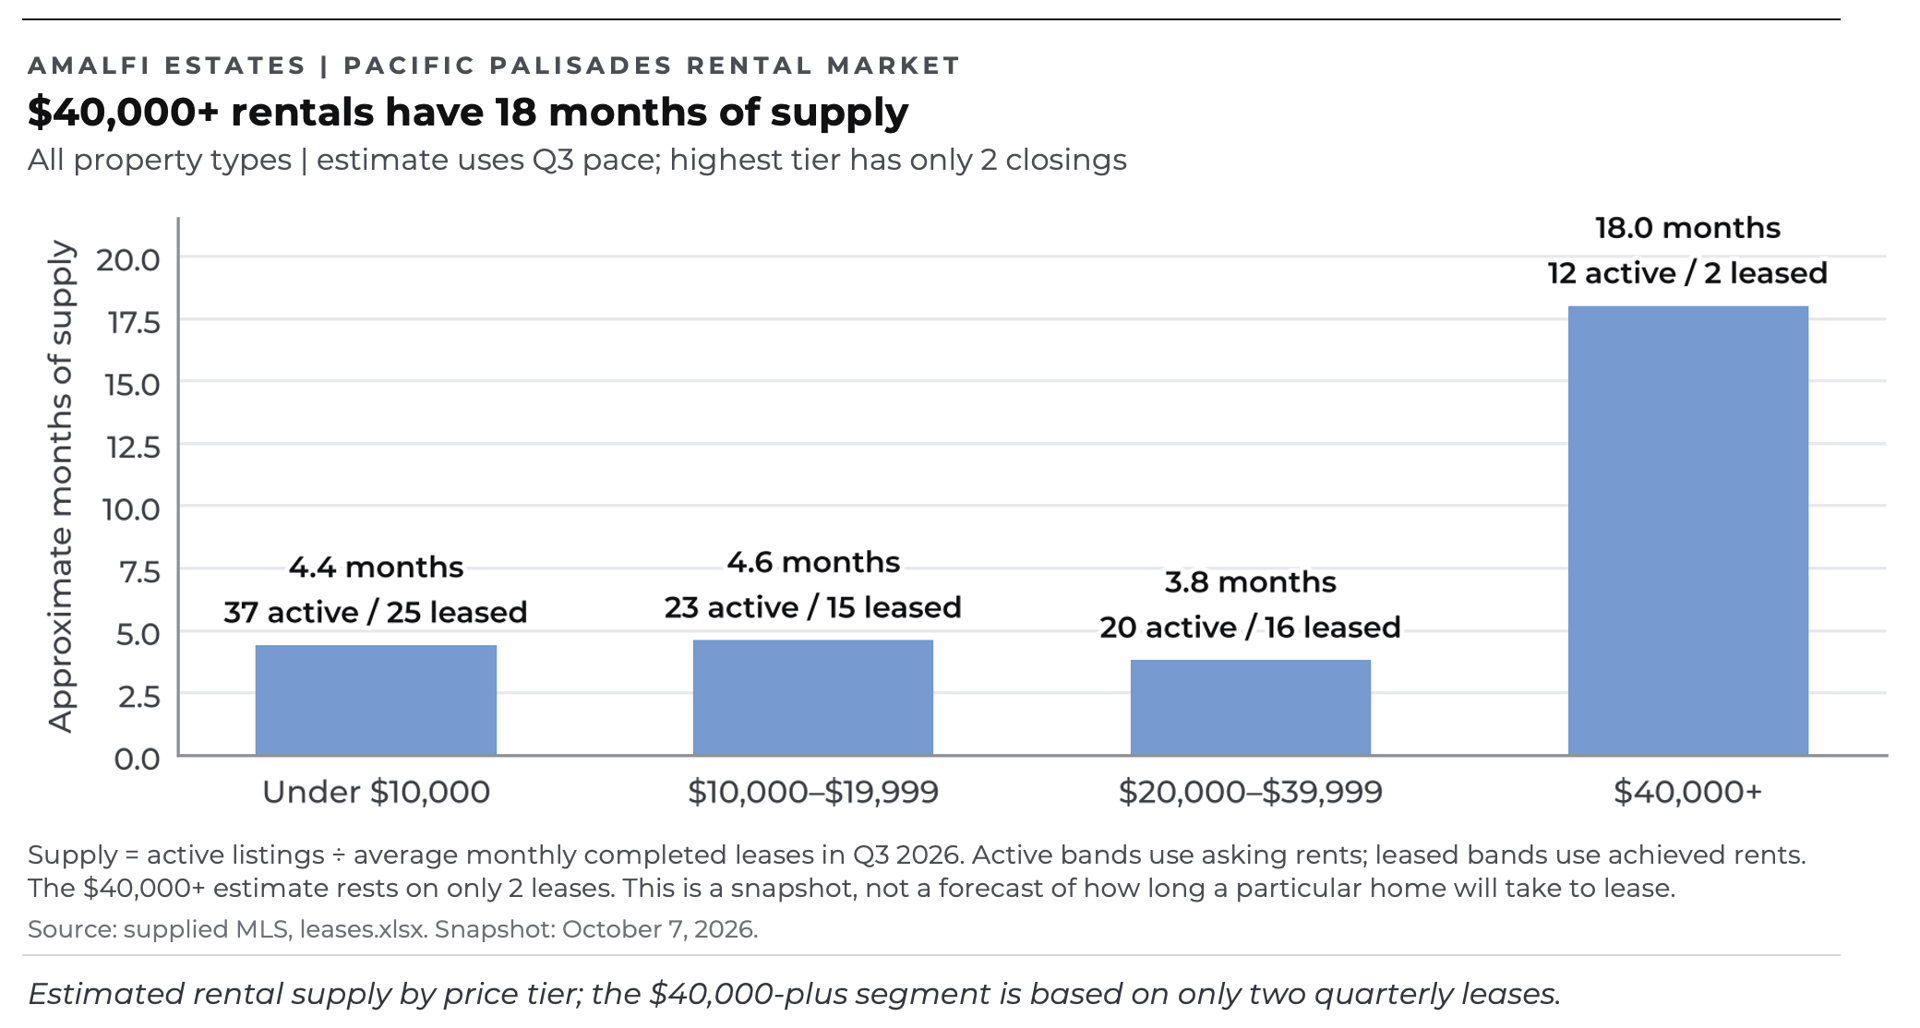
Focus on the alternatives tenants have today. The $40,000-plus segment has an estimated 18 months of supply, but that estimate is based on just two leases, so it should be interpreted cautiously.
43.2 months of estimated supply
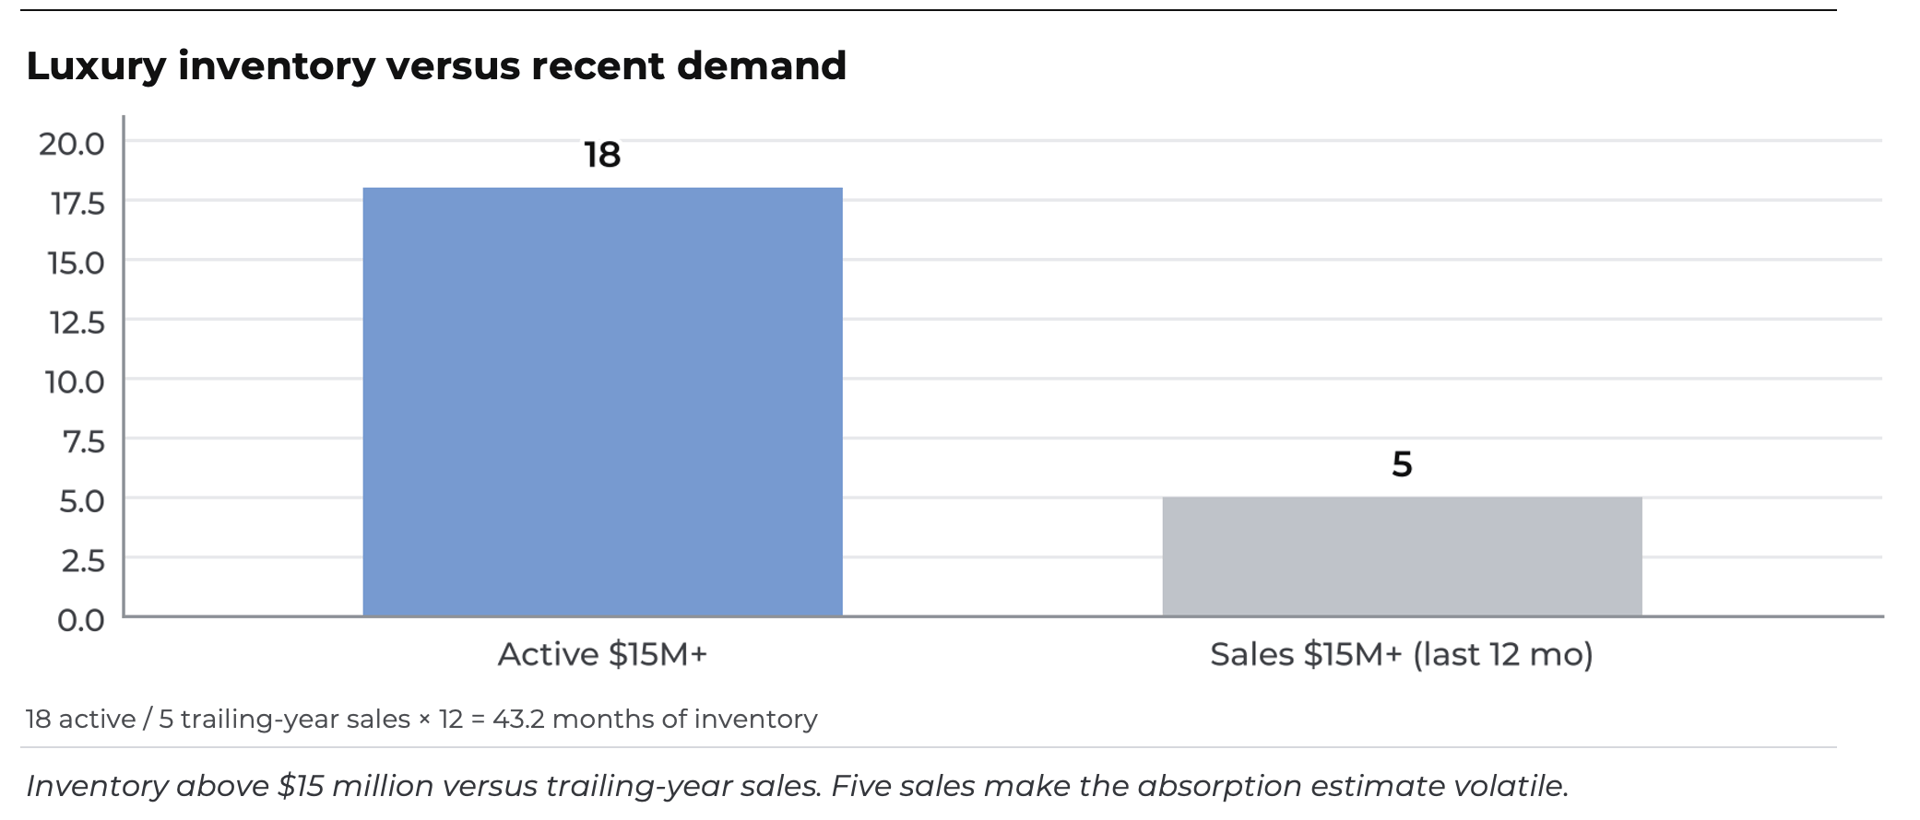
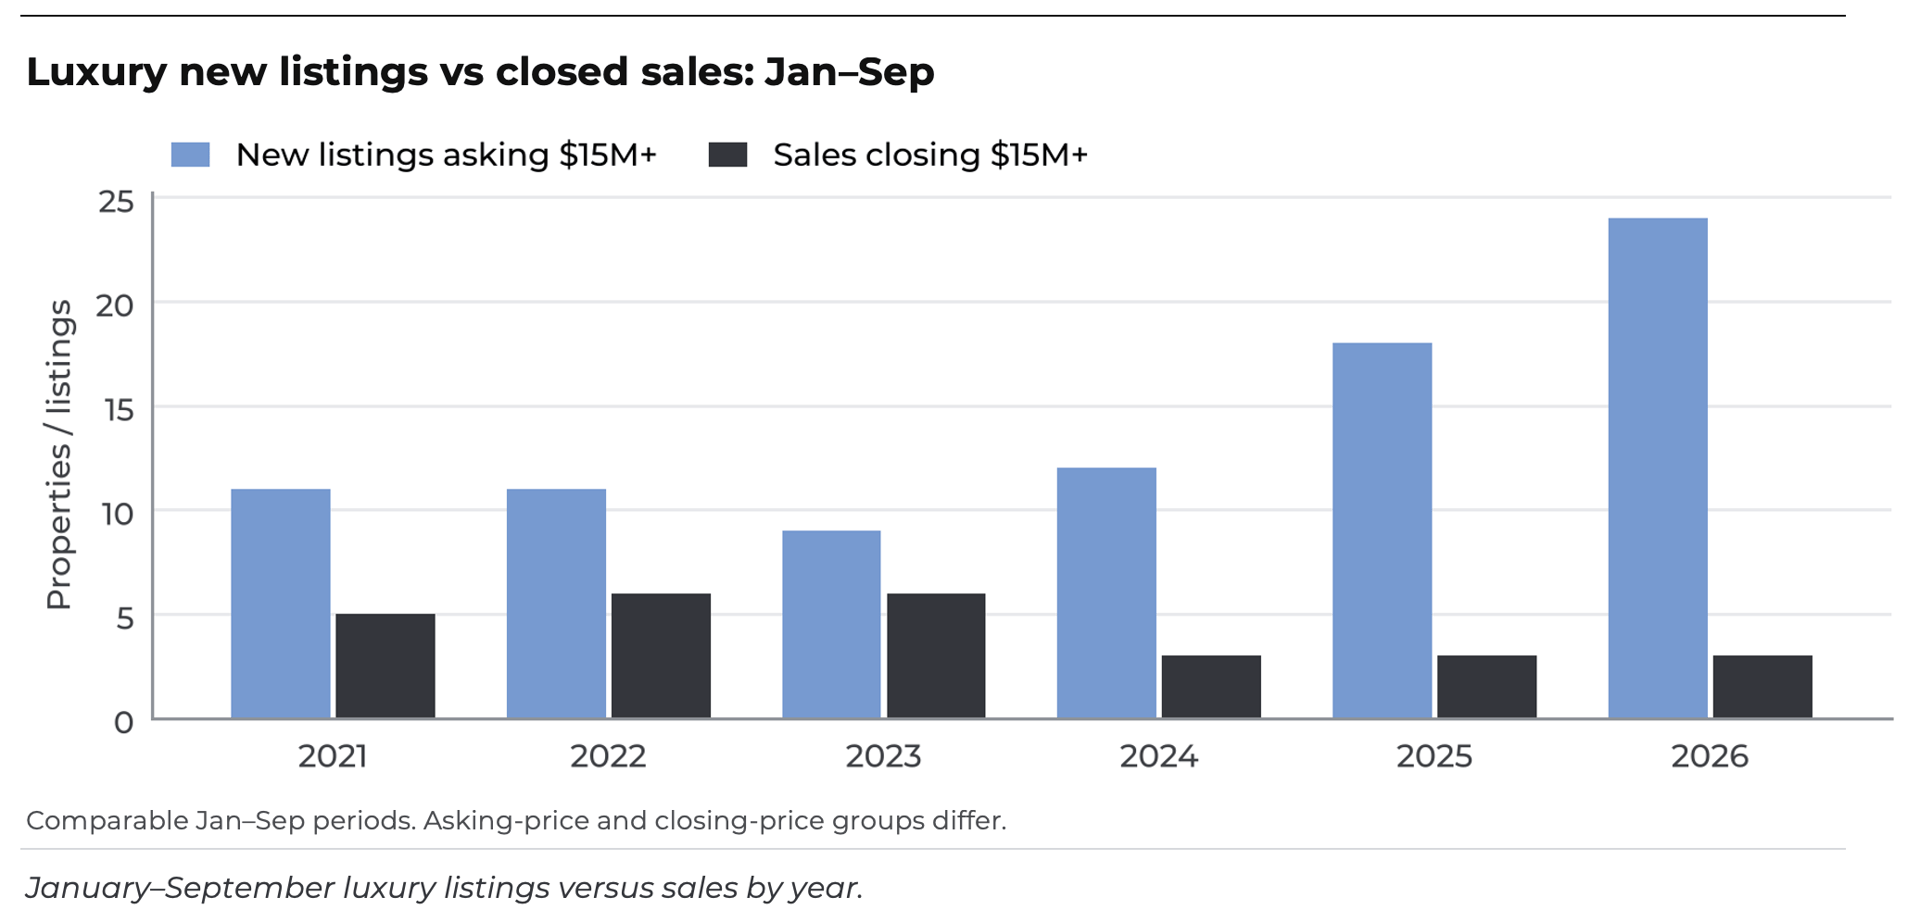
At the October snapshot, 18 homes were listed above $15 million, while five sold in the preceding 12 months. At that pace, the estimated supply is 43.2 months. The small number of sales makes this estimate volatile.
My take
Buyers at this level have options, and new construction adds competition. Exceptional homes can still attract buyers, but pricing and presentation are critical.
The rebuilding story
Next week, I'll take a closer look at permits, completed homes, foreclosure activity and what those developments mean for homeowners. As someone rebuilding my own home, I'll also share my perspective on the challenges and opportunities ahead.
Let's talk about your property
If you're considering selling, rebuilding, or simply trying to understand what your home or lot is worth in today's market, I'm always happy to share my perspective.
Stay up to date on the latest real estate trends.
Beautiful homes and an active community in a central Dallas neighborhood

November 2026
21 Months After the Fire: What’s Really Happening in Pacific Palisades Real Estate?
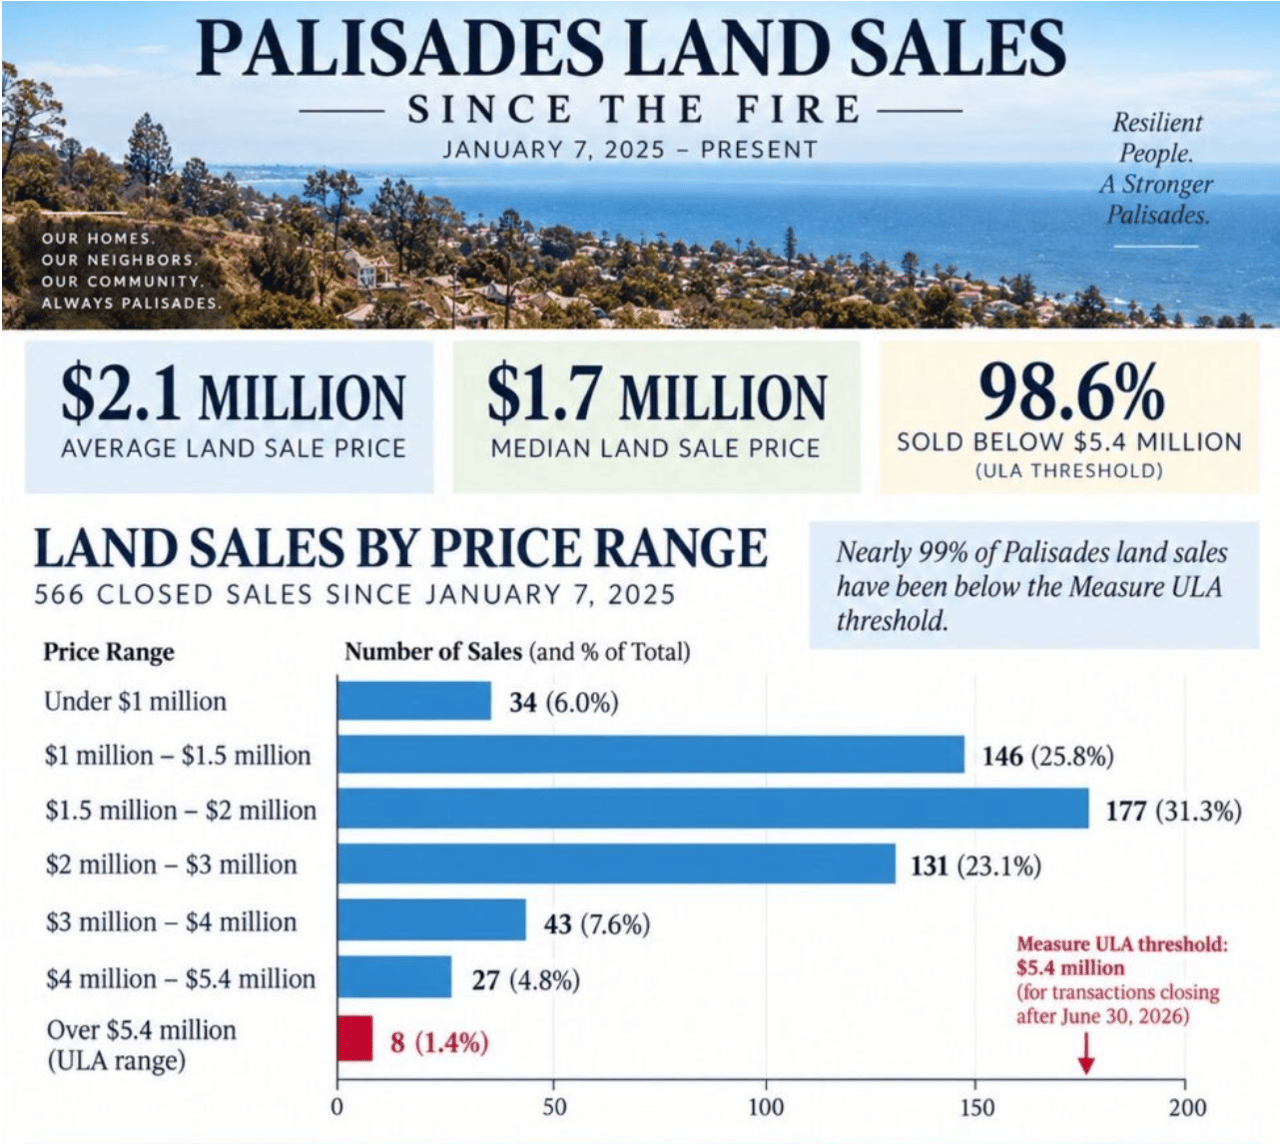
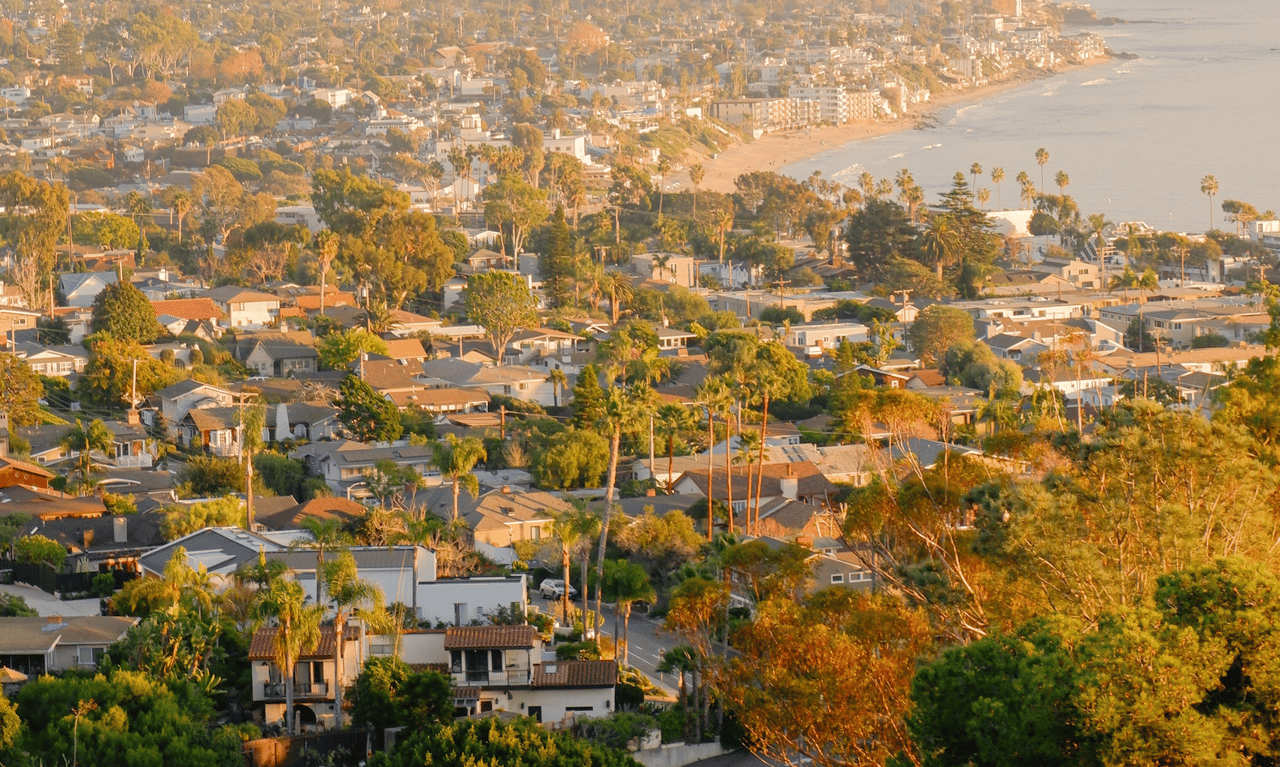
Foreclosure activity has risen since 2025, but the latest numbers remain a small fraction of the Palisades housing market.
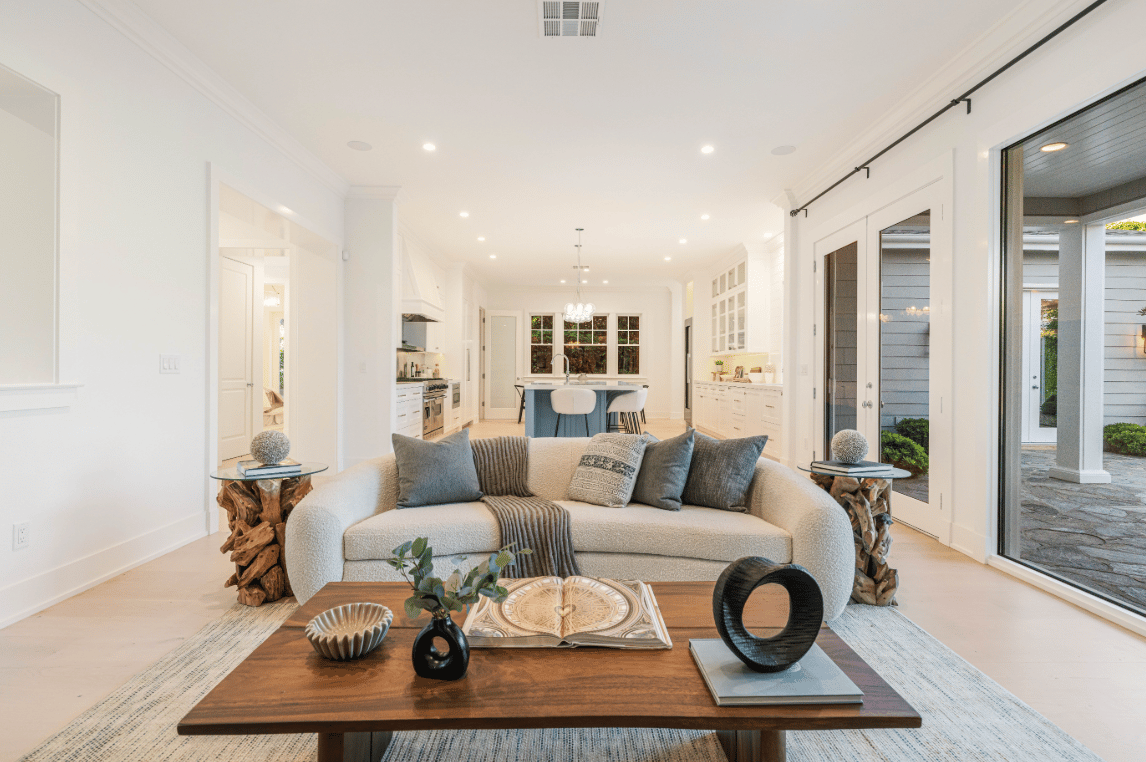
October 2026


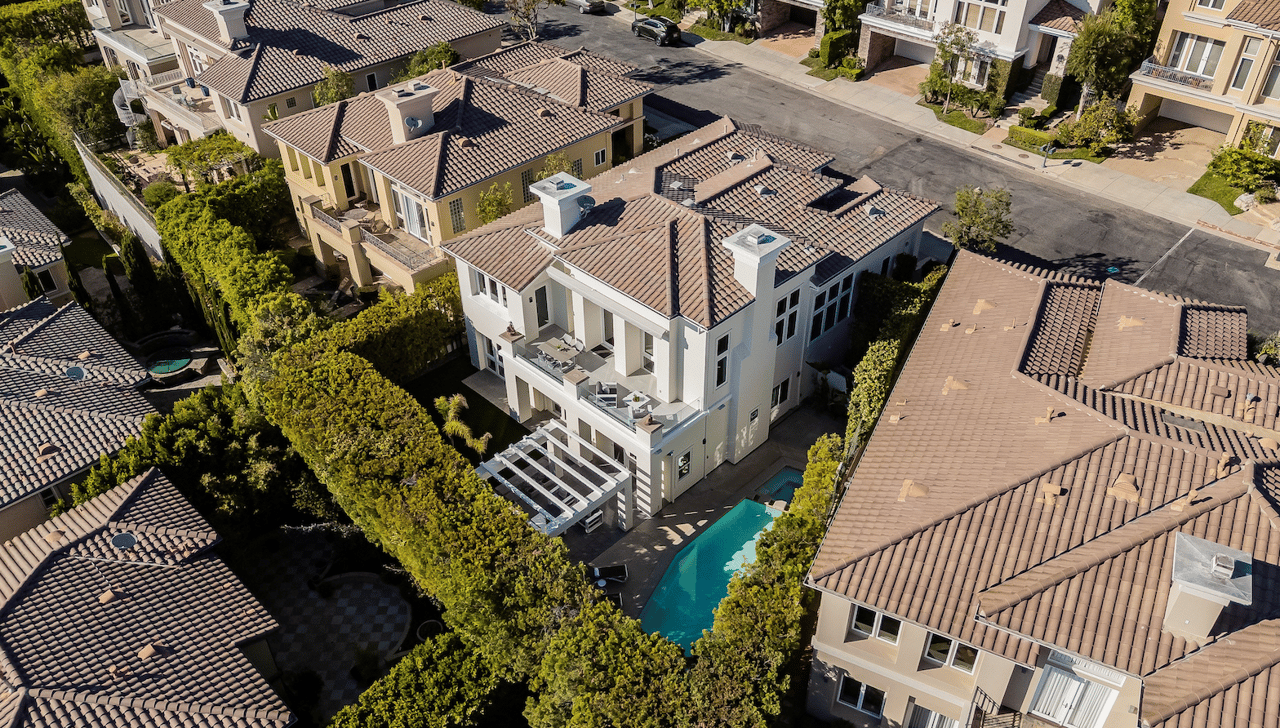
September 2026
You’ve got questions and we can’t wait to answer them.