Market Update Los Angeles

Note: You can find the charts & graphs for the Big Story at the end of the following section.
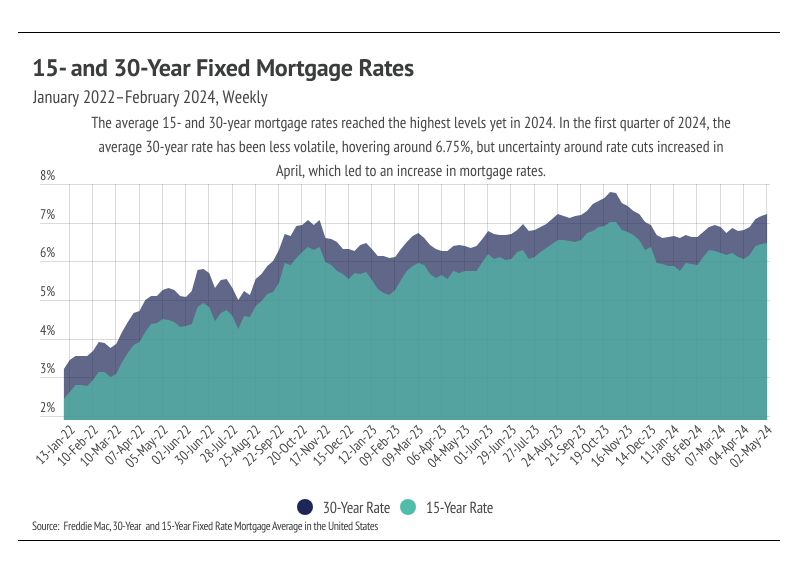
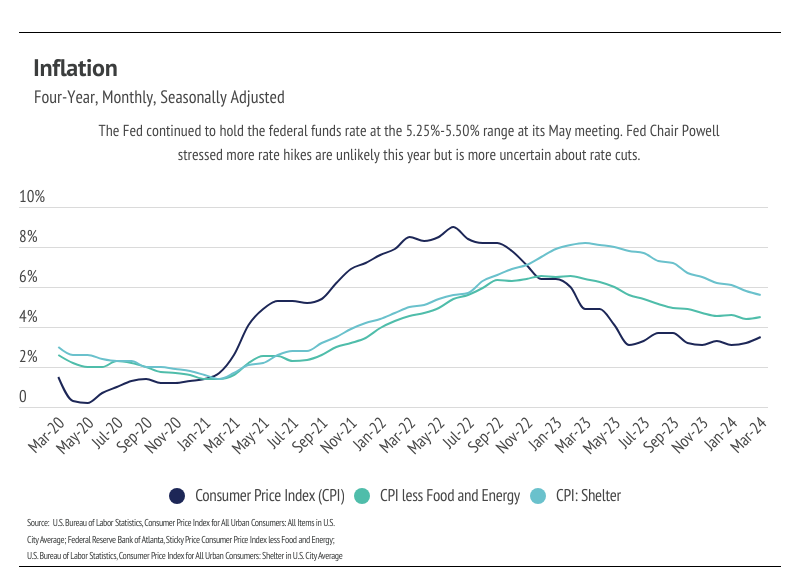
The average 30-year mortgage rate began the year at 6.62%, marking the start of the third year mortgage rates have been elevated. However, the rate expectations for 2024 in January were far different from those today. In January, inflation was still trending lower and economists were predicting rate cuts as early as March. Unfortunately, the inflation rate stopped falling around 3%, never quite reaching the 2% target, which has caused the Fed to delay cutting the federal funds rate, which indirectly, but significantly, influences credit markets. The past two months, in fact, inflation has increased year over year, which isn’t ever going to move the timetable for rate cuts earlier.
During its May meeting, the Federal Reserve unanimously voted to hold policy rates steady for the sixth consecutive time, leaving the federal funds target rate unchanged at 5.25% to 5.50%. Importantly, Fed Chair Jerome Powell emphasized that it’s unlikely that the next policy rate move will be a hike; it’s more likely that rates remain steady and with less clarity of cuts. The Fed’s dual mandate aims for stable prices (inflation ~2%) and low unemployment. The jobs market is still strong, so really, it’s all about inflation.
The Fed’s change of tune has led to much higher mortgage rates. Mortgage rates have risen 0.6% since the start of the year, and two thirds of that increase happened in April. Rising rates, especially quickly rising rates, only slow the housing market. As we entered May, the average 30-year mortgage rate hit 7.22% — the highest level in 2024 and not too far off from the 23-year high of 7.79% hit last year. During April, prices and rates increased, thereby decreasing affordability. For buyers planning to finance a home, the 0.38 percentage point increase that occurred in April affects the monthly cost of a home dramatically. When we couple the median price increase with the mortgage rate increase in just the month of April, the monthly cost increased 7%. If we compare the month cost in January to April, the monthly cost rose 13%.
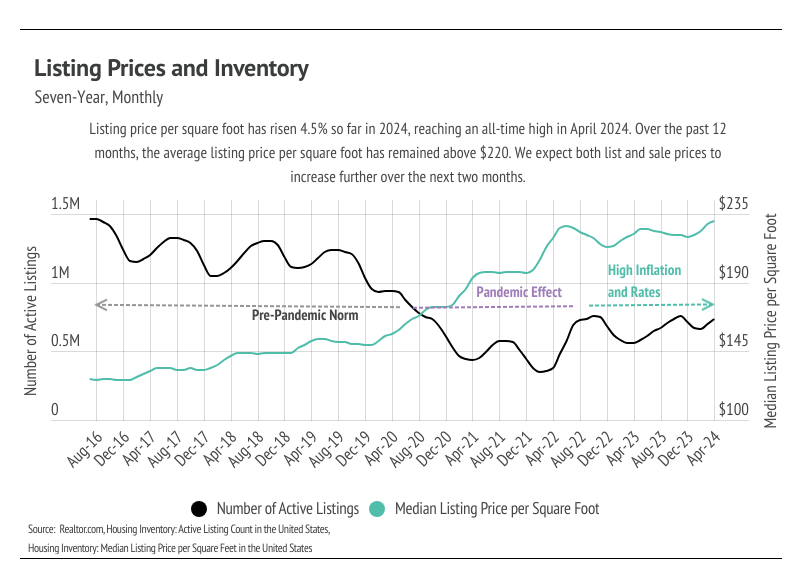
Rates seem to be able to inflate prices and increase sales when they’re low, but when they’re high, they only slow sales — or, at least, that’s been the experience over the past four years. Inventory is, of course, driving the disconnect. Demand is still high relative to supply, even though inventory is growing. However, as prices increase, the buyers who haven’t been priced out of the market become pickier, and fewer but pickier buyers creates an overall slowdown. The market was showing signs of a more normal spring with sales and inventory rising, but the recent rate increases dropped sales last month, which is almost never seen in the spring. Even though mortgage rates have been elevated for long enough that it feels more normal, mortgage rates above 7% will naturally give potential buyers and sellers pause before entering the housing market.
Different regions and individual houses vary from the broad national trends, so we’ve included a Local Lowdown below to provide you with in-depth coverage for your area. As always, we will continue to monitor the housing and economic markets to best guide you in buying or selling your home.
Note: You can find the charts/graphs for the Local Lowdown at the end of this section.
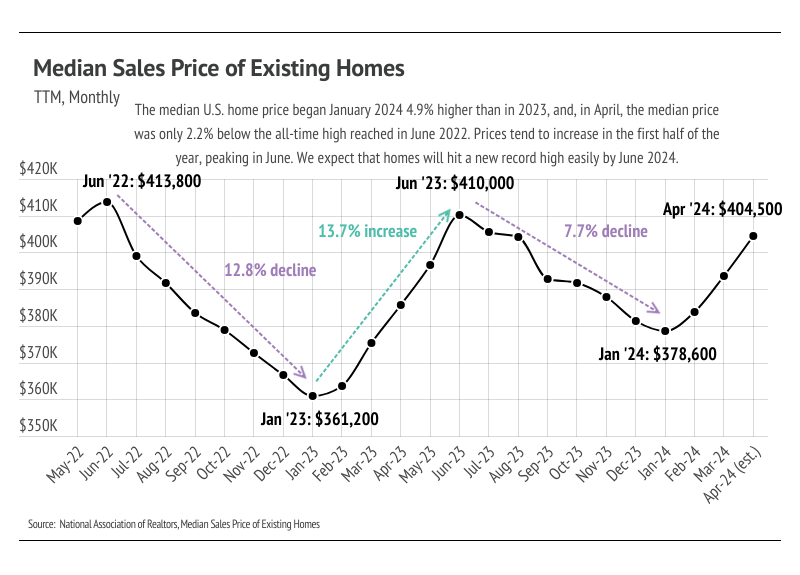
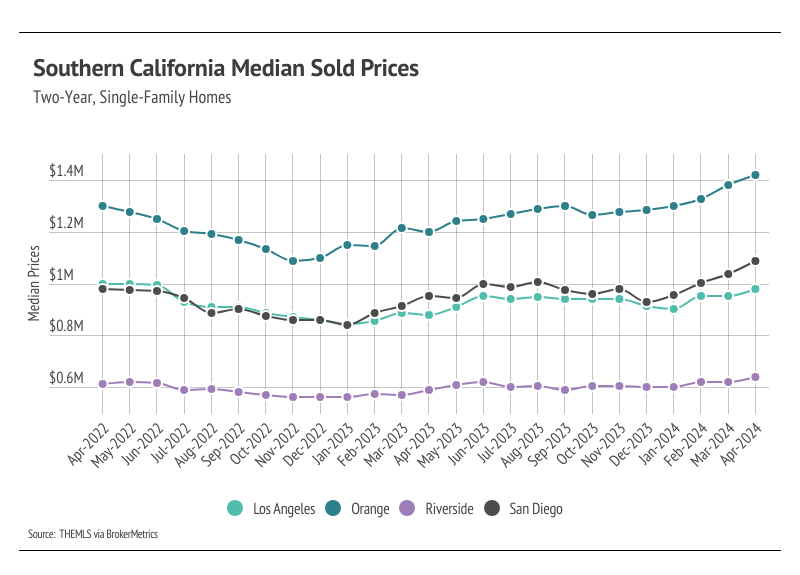
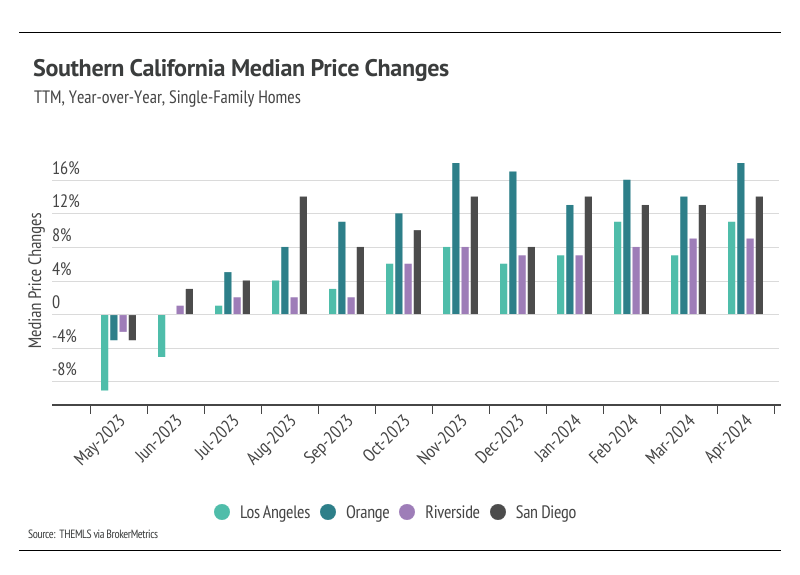
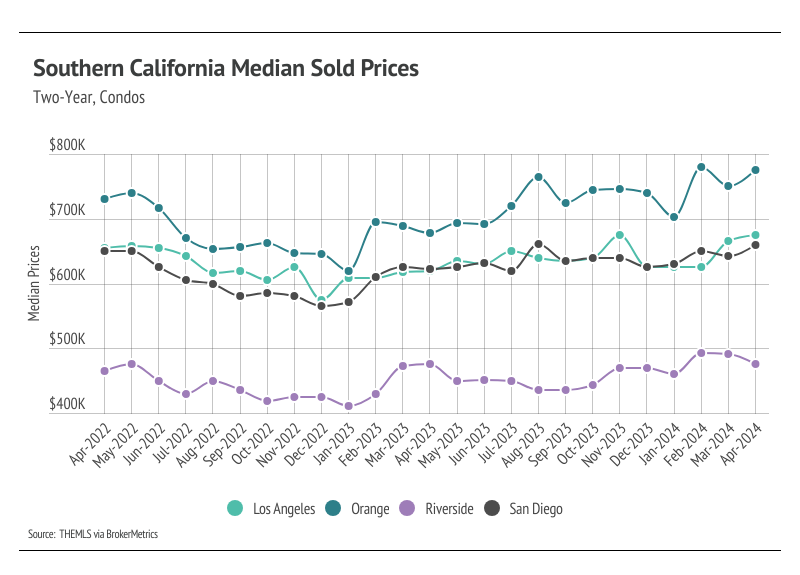
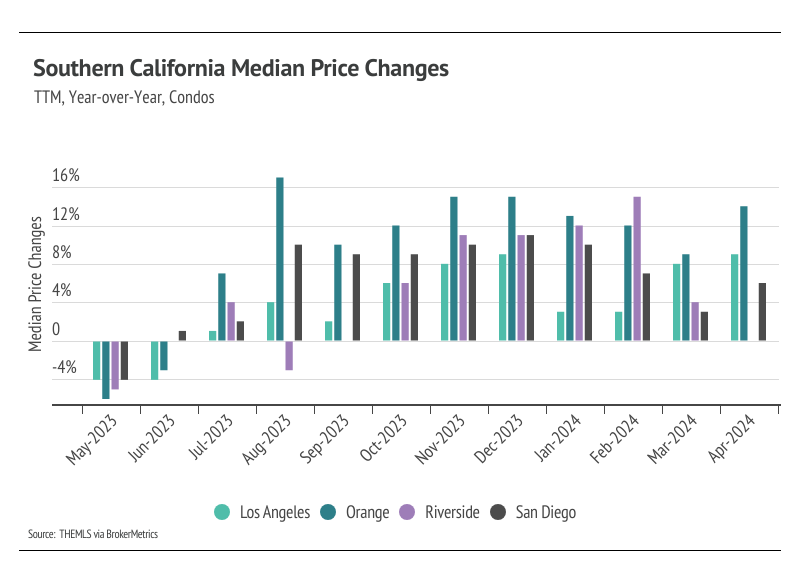
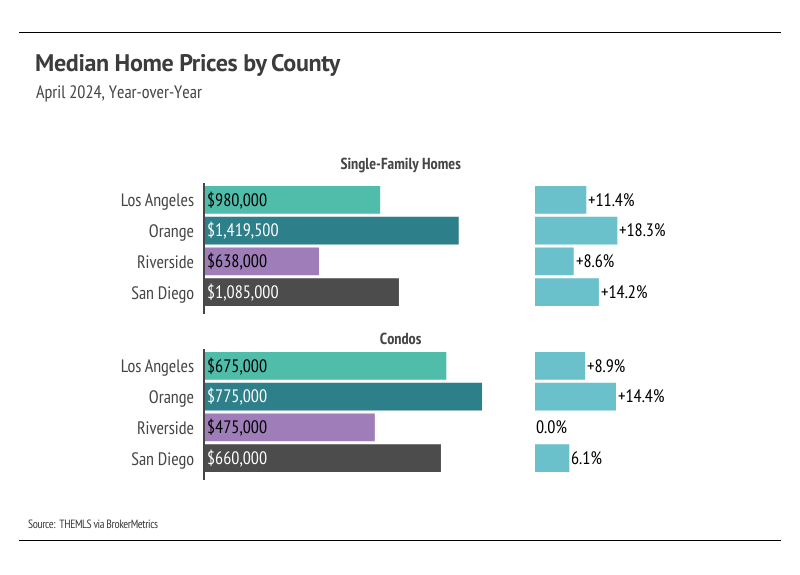
In Southern California, low inventory and high demand have more than offset the downward price pressure from higher mortgage rates, and prices generally haven’t experienced larger drops due to higher mortgage rates. In fact, in April, new record highs were reached in many Southern California counties. The median single-family home prices in Orange, Riverside, and San Diego counties hit record highs. Condo prices rose across most of Southern California, reaching an all-time high in Los Angeles. Prices typically peak in the summer months, indicating single-family home prices will likely rise to a new high in almost every month during the first half of the year in most of Southern California. Condo prices, too, are at or near record highs and will likely peak at new highs in June or July. Additionally, inventory is so low that rising supply will only increase prices as buyers are better able to find the best match.
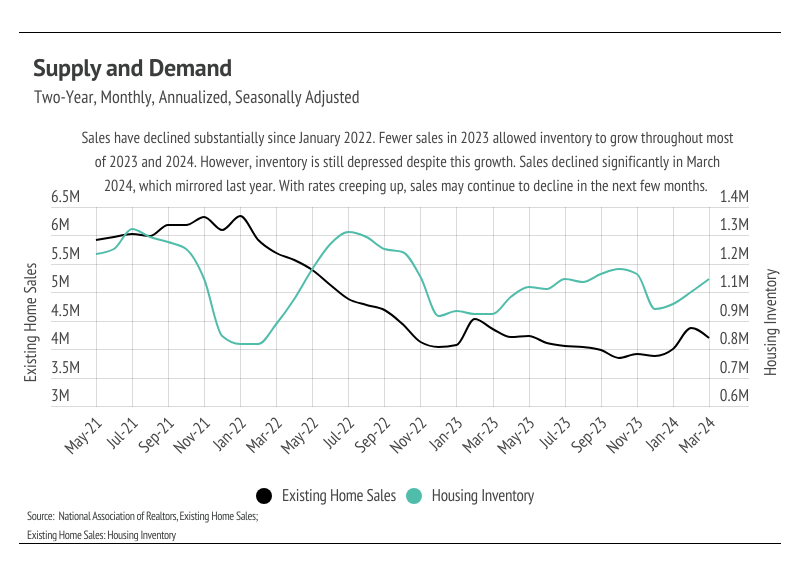
High mortgage rates soften both supply and demand, but homebuyers seemed to tolerate rates above 6%. Now that rates are above 7%, sales may slow slightly in the next couple months, which isn’t great for the market but isn’t terrible as it may allow inventory to build in a massively undersupplied market.
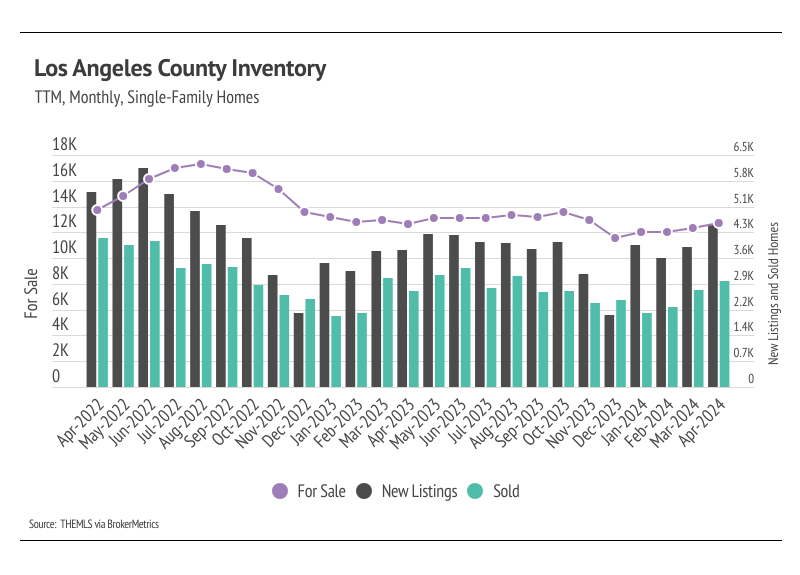
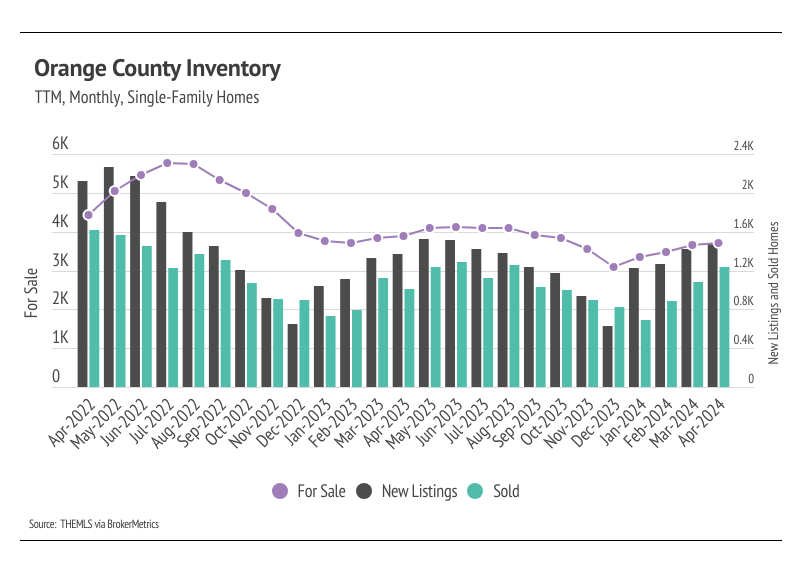
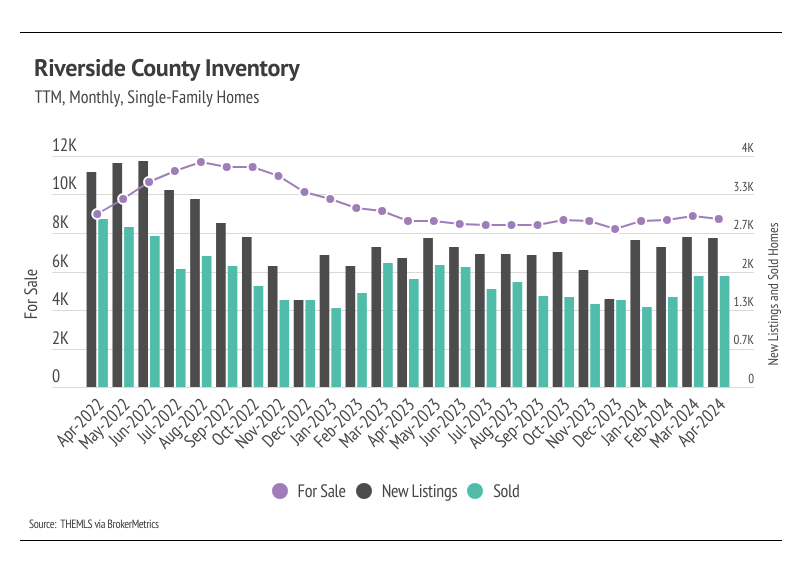
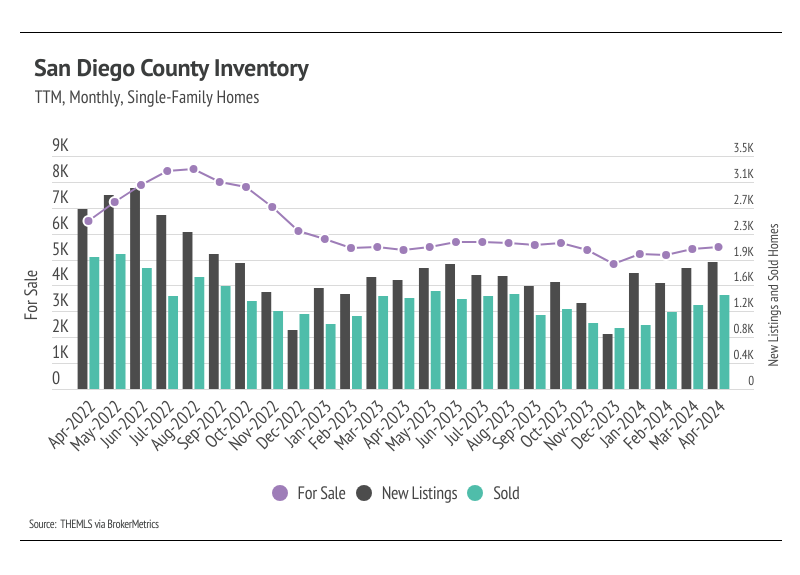
Total active listings, sales, and new listings rose month over month in March and April 2024. Single-family home inventory, sales, and new listings in Southern California rose in all markets except for Riverside County, which saw declines in all three metrics. Overall, inventory has trended lower from August 2022 to the present, as far fewer listings have come to the market. Low inventory and new listings, coupled with high mortgage rates, led to a substantial drop in sales and a generally slower housing market. Typically, inventory begins to increase in January or February, peaking in July or August before declining once again from the summer months to the winter. In 2023, inventory patterns didn’t resemble the typical seasonal inventory wave. We were hopeful that inventory and new listings would increase after new listings rose 92% month over month in January 2024. However, new listings have yet to grow at the pace needed to bring a significant increase in inventory. The number of new listings coming to market is a significant predictor of sales. In April, new listings rose 9% month over month, and sales rose 8%. The demand in Southern California is there, but supply — especially new supply — hasn’t yet come to the market. More supply will mean a healthier market. Year over year, inventory is up 4%, and sales are up 9%.
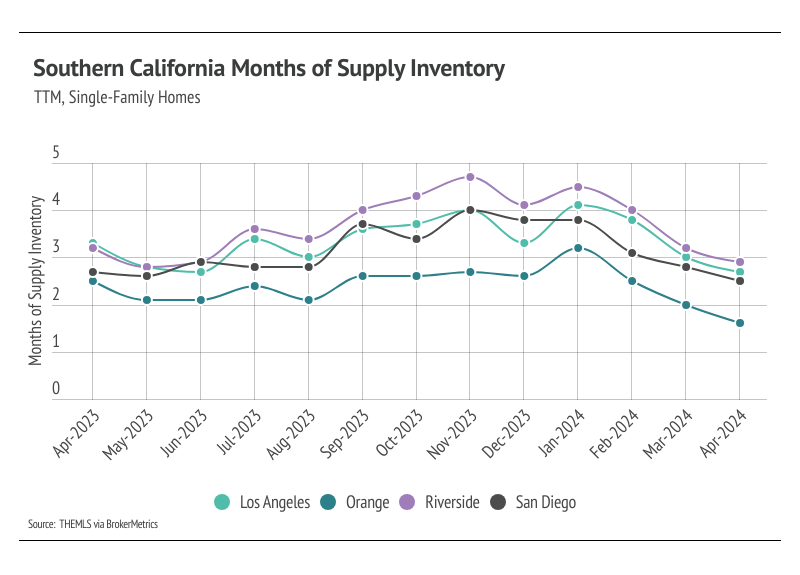
Months of Supply Inventory (MSI) quantifies the supply/demand relationship by measuring how many months it would take for all current homes listed on the market to sell at the current rate of sales. The long-term average MSI is around three months in California, which indicates a balanced market. An MSI lower than three indicates that there are more buyers than sellers on the market (meaning it’s a sellers’ market), while a higher MSI indicates there are more sellers than buyers (meaning it’s a buyers’ market). MSI trended higher in the second half of 2023, rising above three months of supply in most of Southern California; however, MSI declined sharply over the past three months, falling below three months across counties, indicating sellers’ markets.
Stay up to date on the latest real estate trends.
May 2026

April 2026
March 2026

February 2026
January 2026

Trusted Experts in the Palisades, Santa Monica, and Brentwood Real Estate Markets

How Sellers In Pacific Palisades, Santa Monica And Brentwood Get It Right

December 2025

November 2025
You’ve got questions and we can’t wait to answer them.