Market Update Los Angeles
Note: You can find the charts & graphs for the Big Story at the end of the following section.
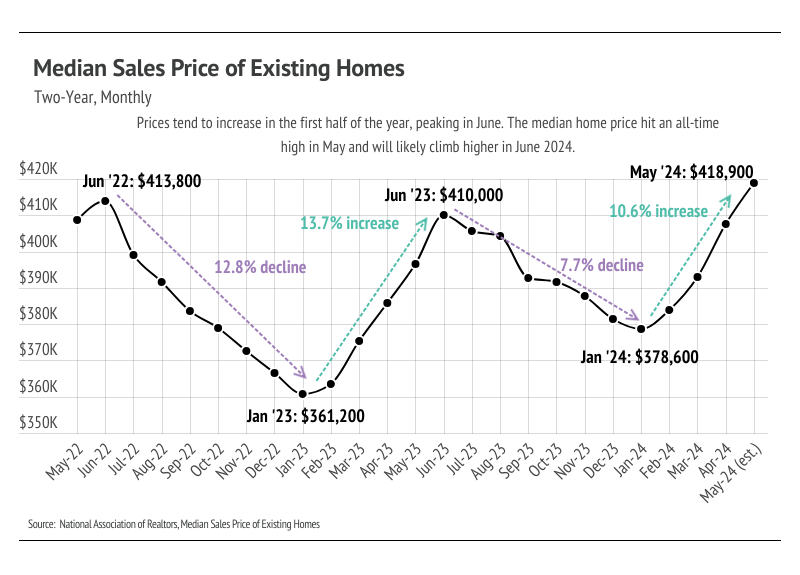
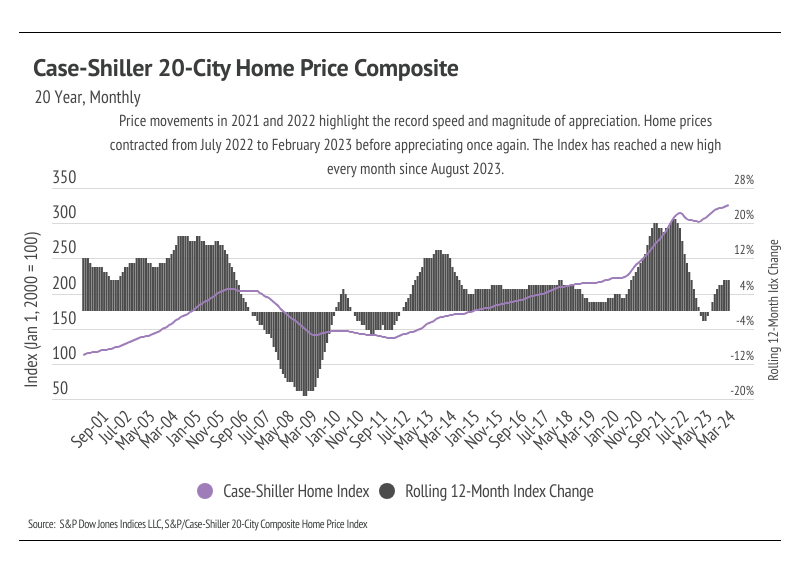
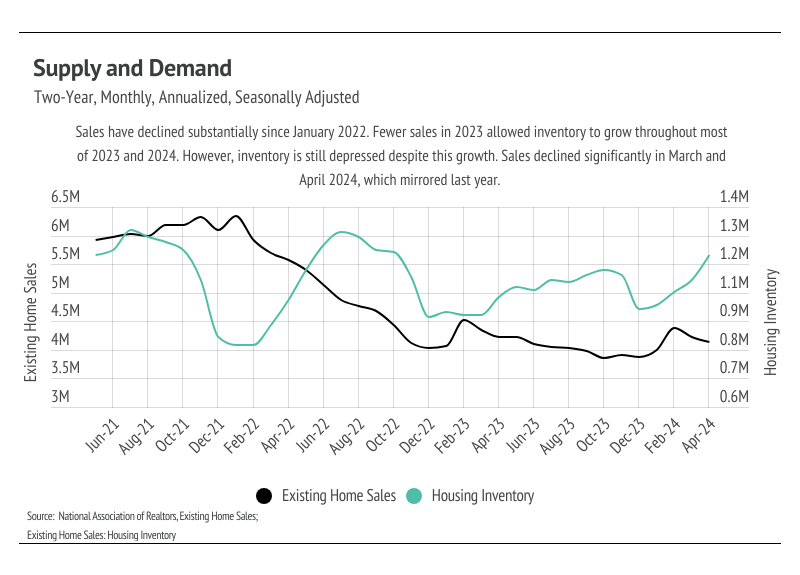
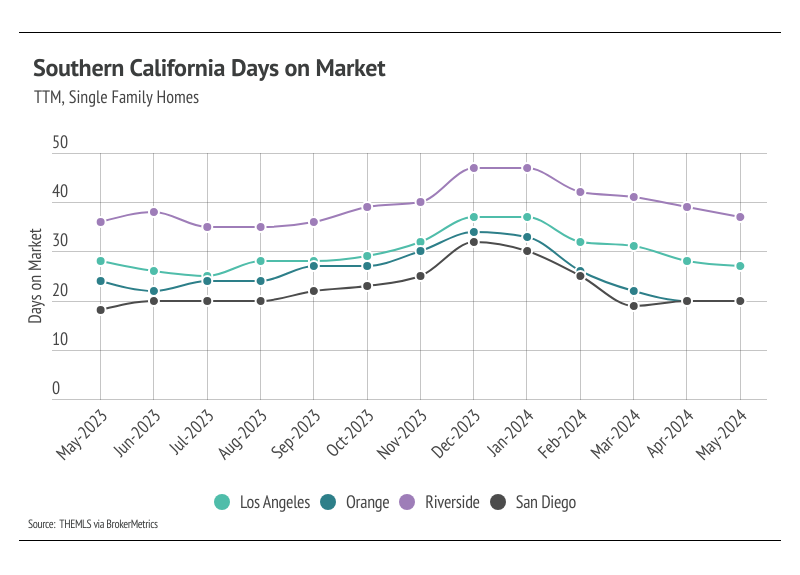
According to the National Association of Realtors® (NAR), the median sales price for existing homes grew 5.6% to $418,900 between May 2023 and the present — the eleventh consecutive month of year-over-year price growth, and the highest median price ever reached. Typically, the median price peaks in June each year, so we will likely see prices climb even higher when the data comes in for this month. In addition to NAR, the Case-Shiller 20-City Composite Home Price Index, which measures the aggregate price level of homes in the largest 20 metropolitan statistical areas, has reached a new high for the eighth month in a row. The combination of elevated mortgage rates and rising prices has brought affordability to an all-time low, which translates to fewer sales and growing inventory. However, at the same time, homes are spending less and less time on the market.
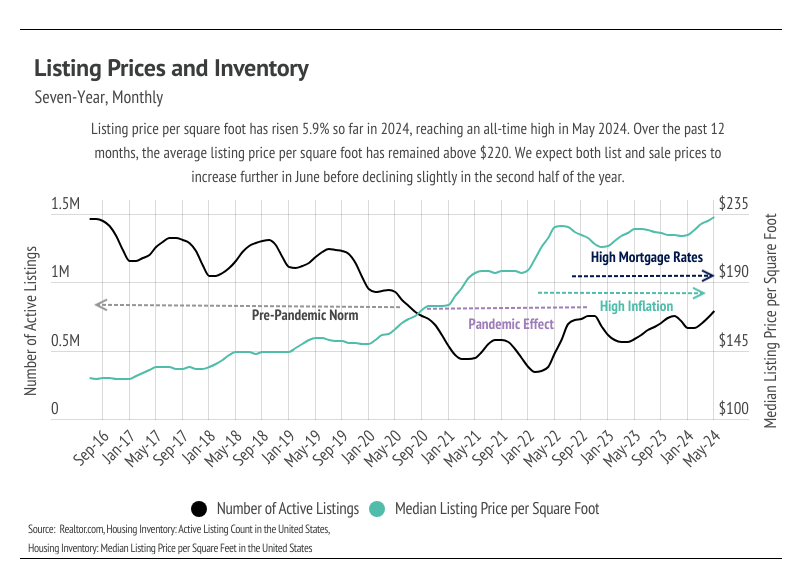
Demand is still high relative to supply, even though inventory is building. The buyers that haven’t been priced out of the market are moving quickly on homes that suit them. Despite the high demand and quick market, there are simply fewer buyers in the market. Higher mortgage rates can only lead to fewer market participants. On the bright side, inventory growth is great news for the wildly undersupplied U.S. housing market. According to data from realtor.com, inventory reached its highest level since August 2020. The market is still broadly undersupplied, but the increasing inventory level should cause rising home prices to slow. Decreasing home prices mid-year is also normal on a seasonal basis. In the pre-pandemic seasonal trends, sales, new listings, inventory, and price would roughly all rise in the first half of the year and decline slightly in the second half of the year. Sales and new listings have been far lower than usual since mortgage rates started climbing, which is to be expected.
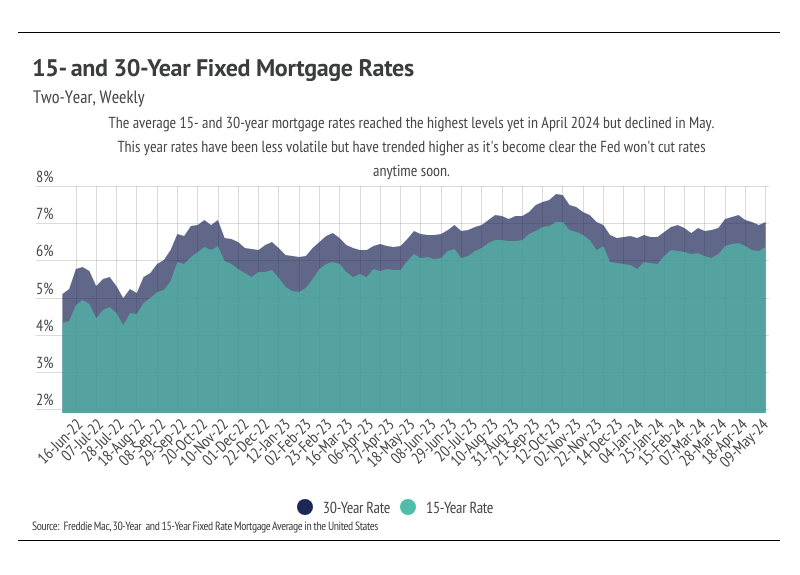
The average 30-year mortgage rate began the year at 6.62% and landed at 7.03% at the end of May, marking the third year mortgage rates have been elevated. At the start of the year, rate expectations were far different from those today. In January, inflation still appeared to be trending lower, and economists were predicting rate cuts as early as March. However, in hindsight, inflation stopped trending lower in June 2023 and has held fairly steady around 3.3% since then. The Fed targets an inflation rate of 2%, so we aren’t expecting rate cuts anytime soon. In fact, the safest bet may be to not expect any rate cuts in 2024. The Fed’s dual mandate aims for stable prices (inflation ~2%) and low unemployment, so it’s all about inflation, especially because the job market is still strong.
During the Fed’s May meeting, the Federal Reserve Board unanimously voted to hold policy rates steady for the sixth consecutive time, leaving the federal funds target rate unchanged at 5.25% to 5.50%. Although this letter was written before the June 11-12 Fed meeting, we are confident the Fed will hold rates steady. If there’s a silver lining, it’s that even though rate cuts are extremely unlikely, rate hikes are even less probable.
Different regions and individual houses vary from the broad national trends, so we’ve included a Local Lowdown below to provide you with in-depth coverage for your area. As always, we will continue to monitor the housing and economic markets to best guide you in buying or selling your home.
Note: You can find the charts/graphs for the Local Lowdown at the end of this section.
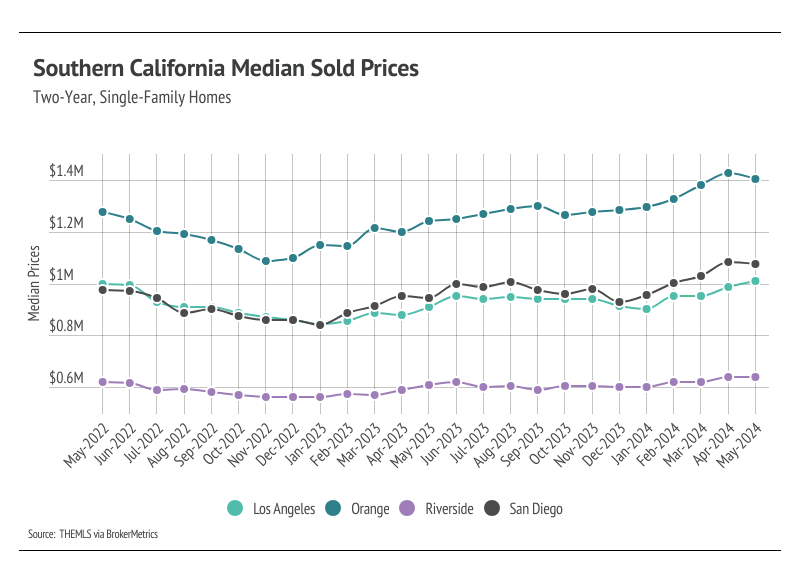
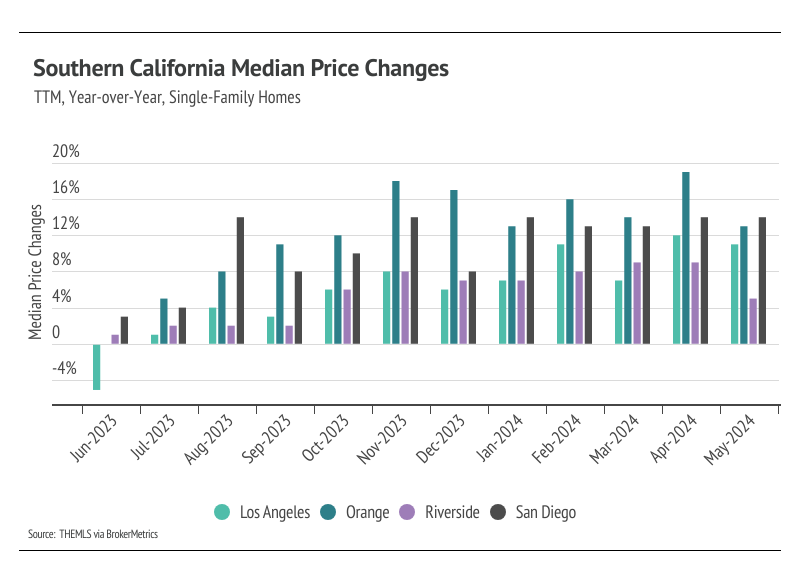
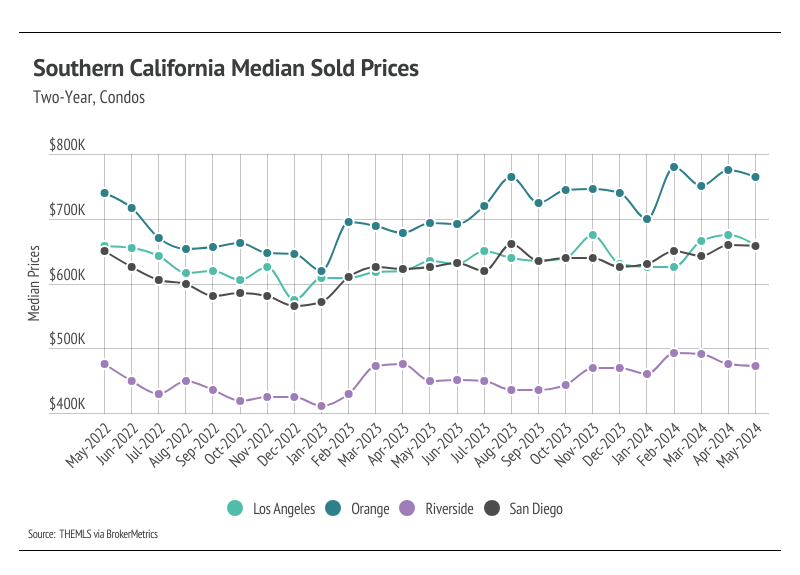
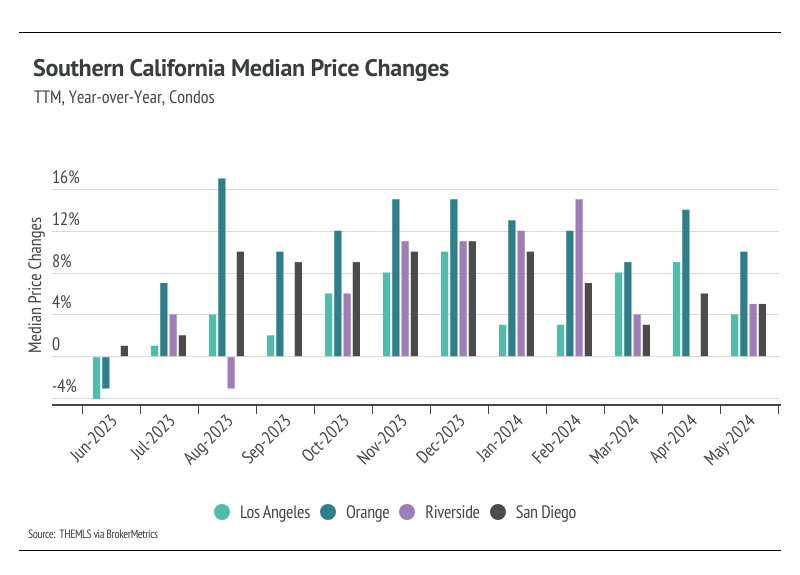
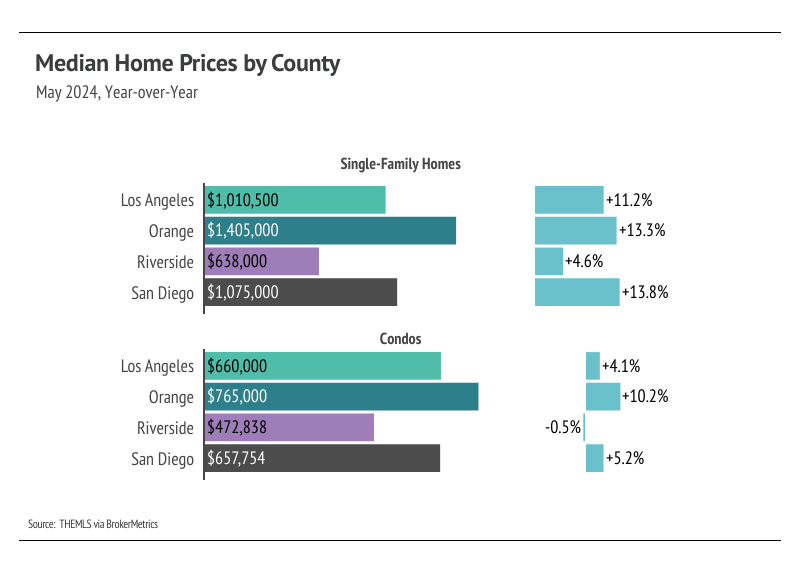
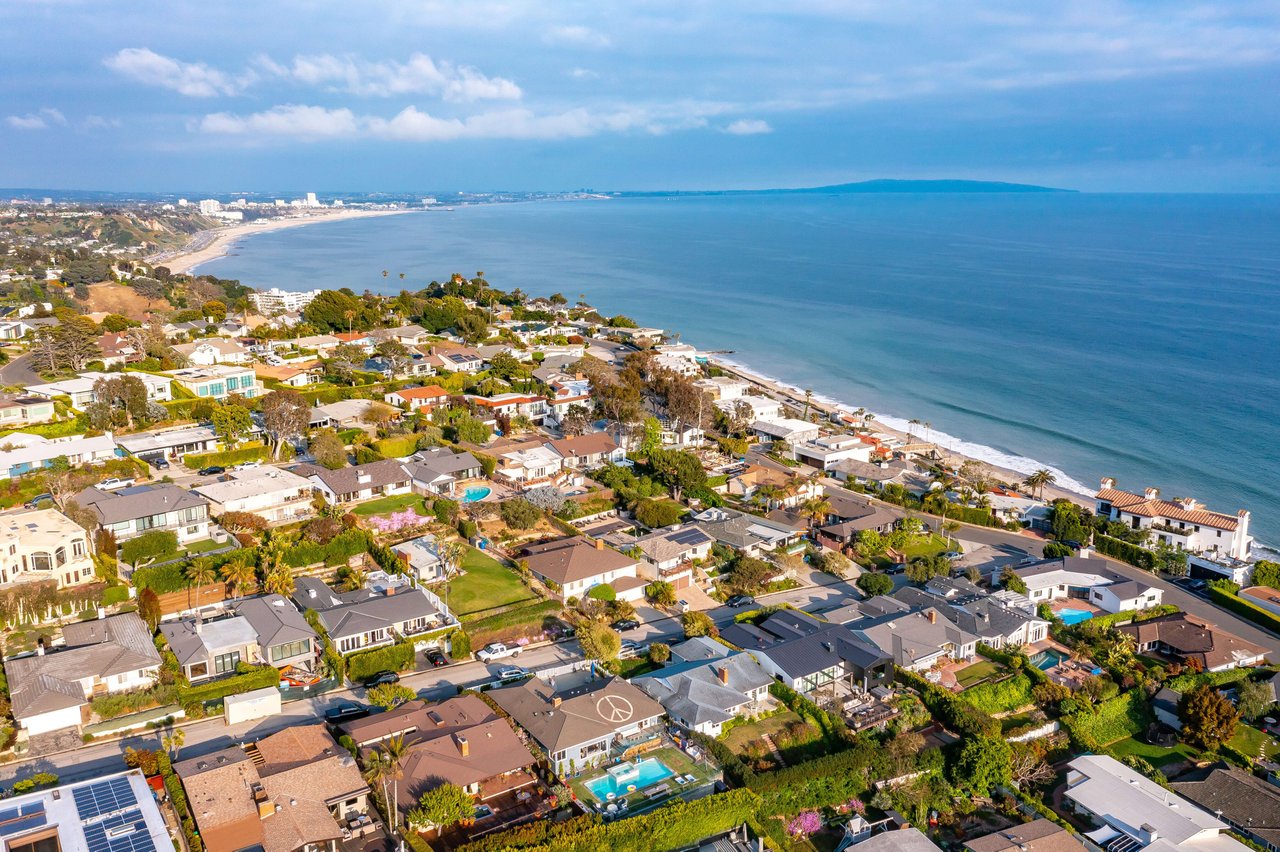
In Southern California, home prices are just below record highs for both single-family homes and condos with the exception of Los Angeles County. Persistently low inventory and high demand have more than offset the downward price pressure from higher mortgage rates. Prices in Southern California generally haven’t experienced larger drops due to higher mortgage rates. In fact, in May, the median single-family home price in Los Angeles County reached $1,010,500 — a new record high. Single-family home and condo prices in the rest of Southern California are only slightly below peak. Since prices typically peak in the summer months, prices could easily rise to new highs in June. Additionally, inventory is so low that rising supply will only increase prices as buyers are better able to find the best match.
High mortgage rates soften both supply and demand, but home buyers and sellers seemed to tolerate rates above 6%. Now that rates are above 7%, sales are slowing once again during the time of the year when sales tend to be at their highest. This phenomenon isn’t great for the market, but it isn’t terrible, either, as it may allow inventory to build in a massively undersupplied market.
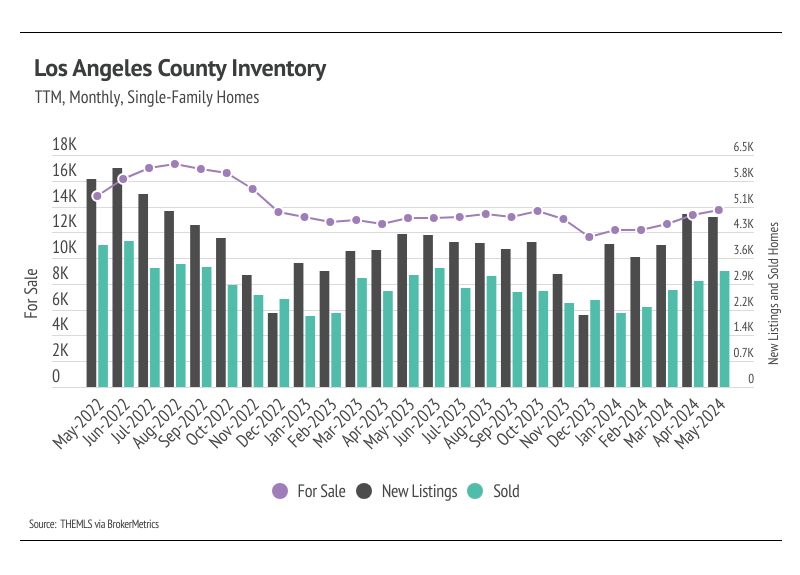
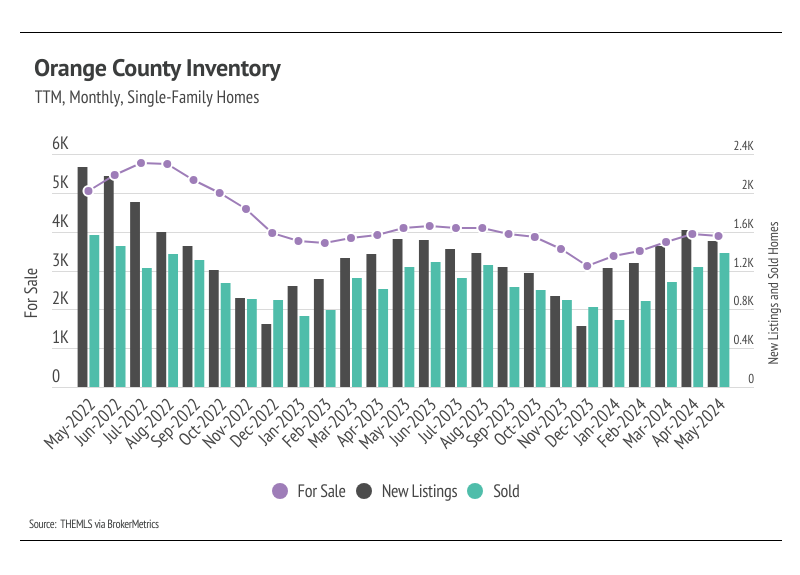
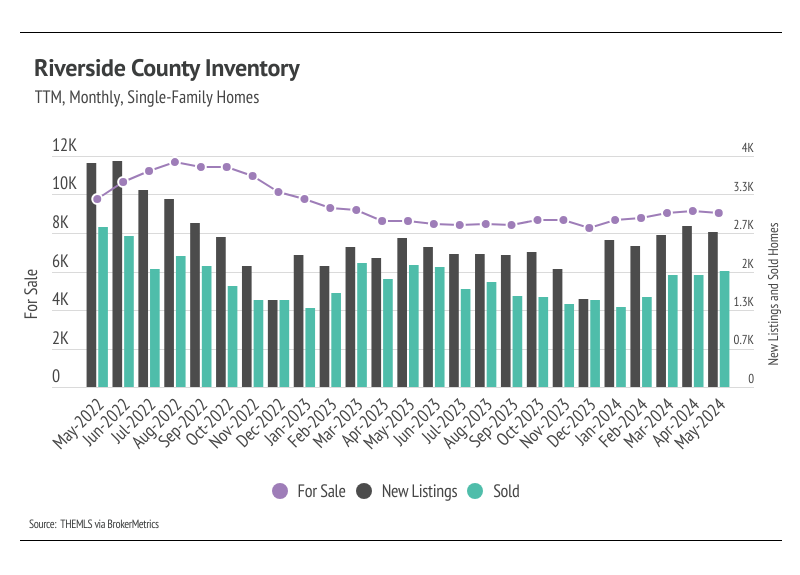
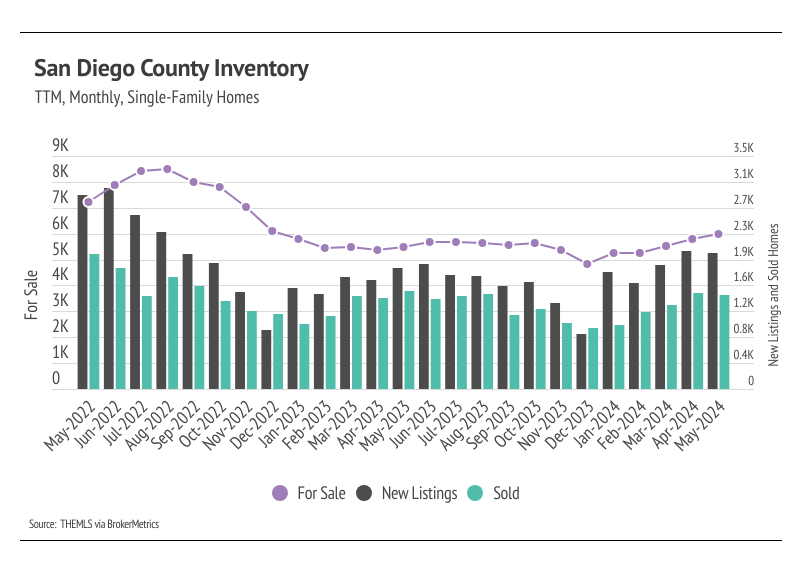
Single-family home and condo sales and inventory increased from April to May, even as new listings declined slightly. Sales increased in all markets except for San Diego, which saw fewer homes sell in May than in April. Total inventory has trended horizontally for nearly a year and a half at a depressed level. Low inventory and new listings, coupled with high mortgage rates, have led to a substantial drop in sales and a generally slower housing market. Typically, inventory begins to increase in January or February, peaking in July or August before declining once again from the summer months to the winter. In 2023 and now 2024, inventory patterns aren’t resembling the typical seasonal inventory peaks and valleys.
We were hopeful that inventory and new listings would increase after new listings rose 92% month over month in January 2024. However, new listings have yet to grow at the pace needed to bring a significant increase in inventory. The number of new listings coming to market is a significant predictor of sales, and the substantial increase in new listings in January led to a 16% increase in sales in February. In April, new listings rose 13% month over month, and sales rose 5% in May. New listings fell 1%, so we may see sales decline next month. The demand in Southern California is there, but supply — especially new supply — isn’t coming to the market. More supply will mean a healthier market.
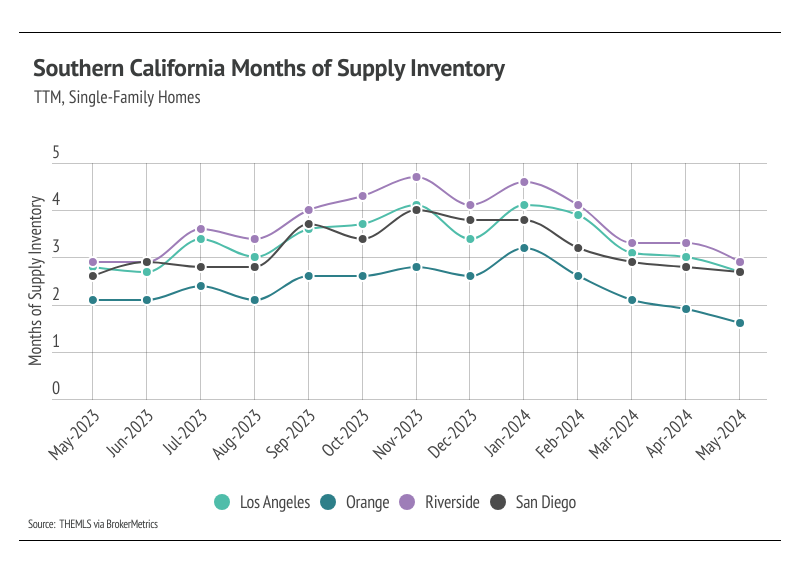
Months of Supply Inventory (MSI) quantifies the supply/demand relationship by measuring how many months it would take for all current homes listed on the market to sell at the current rate of sales. The long-term average MSI is around three months in California, which indicates a balanced market. An MSI lower than three indicates that there are more buyers than sellers on the market (meaning it’s a sellers’ market), while a higher MSI indicates there are more sellers than buyers (meaning it’s a buyers’ market). MSI trended higher in the second half of 2023, rising above three months of supply in most of Southern California; however, MSI declined sharply over the past four months, falling below three months across counties, indicating sellers’ markets.
Stay up to date on the latest real estate trends.

July 2026

A Closer Look at Dallas Rental Prices, Hidden Costs, and What Renters Need to Know Before Moving

June 2026

May 2026

April 2026
March 2026

February 2026
January 2026

Trusted Experts in the Palisades, Santa Monica, and Brentwood Real Estate Markets
You’ve got questions and we can’t wait to answer them.