Market Update Los Angeles

Note: You can find the charts & graphs for the Big Story at the end of the following section.
*National Association of REALTORS® data is released two months behind, so we estimate the most recent month’s data when possible and appropriate.
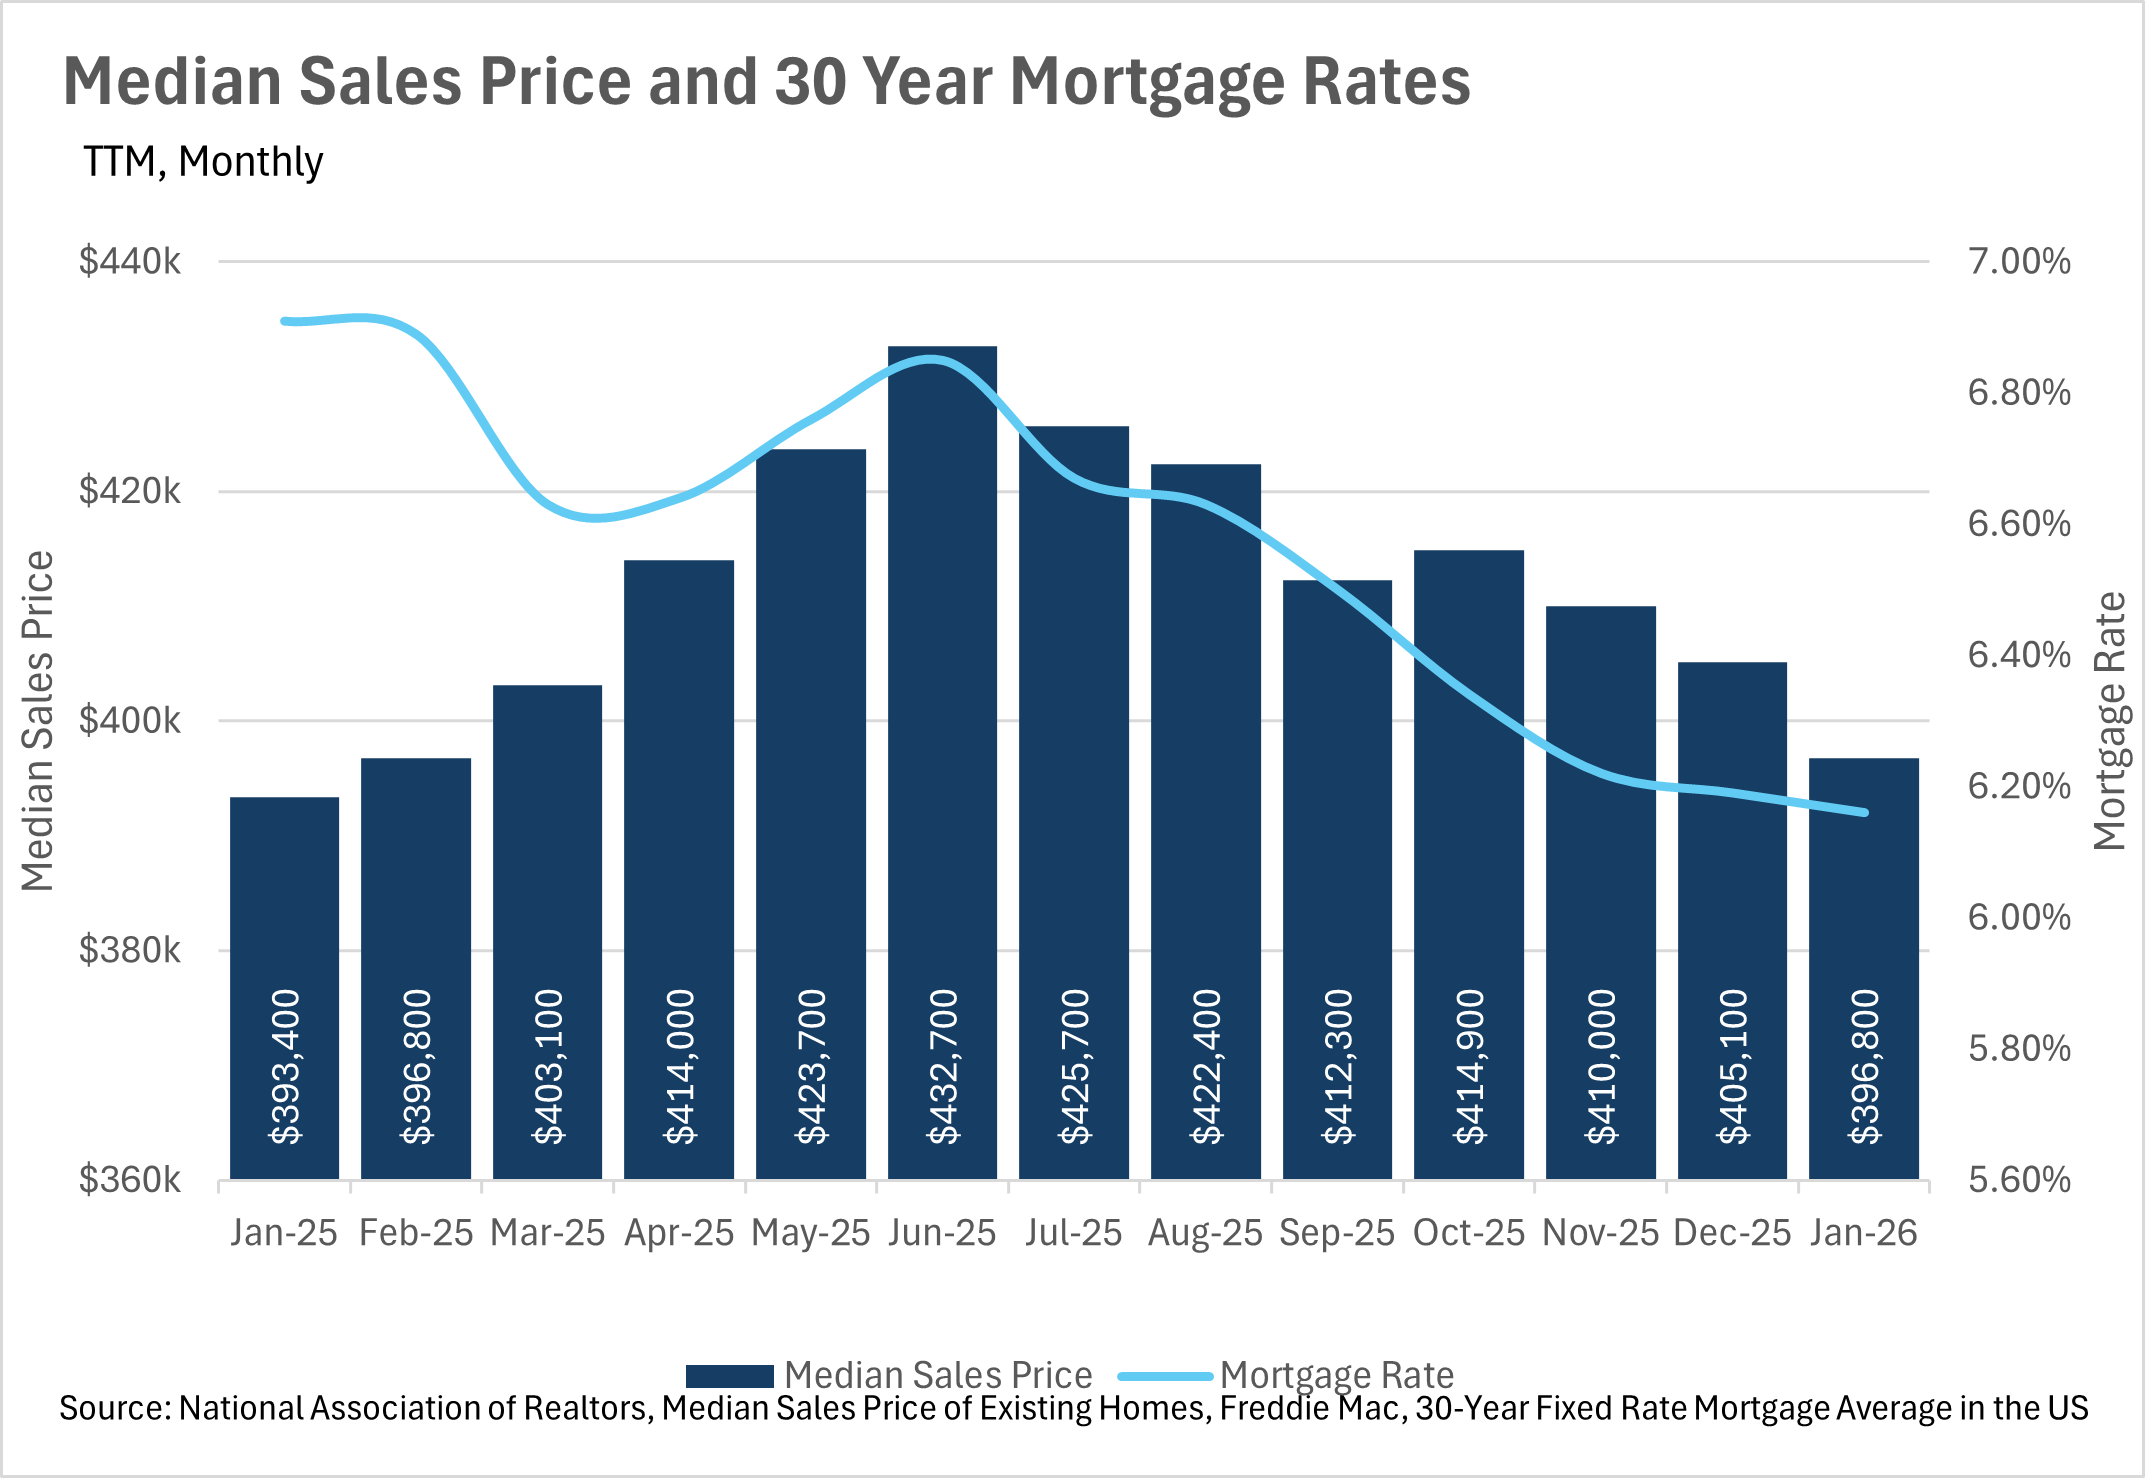
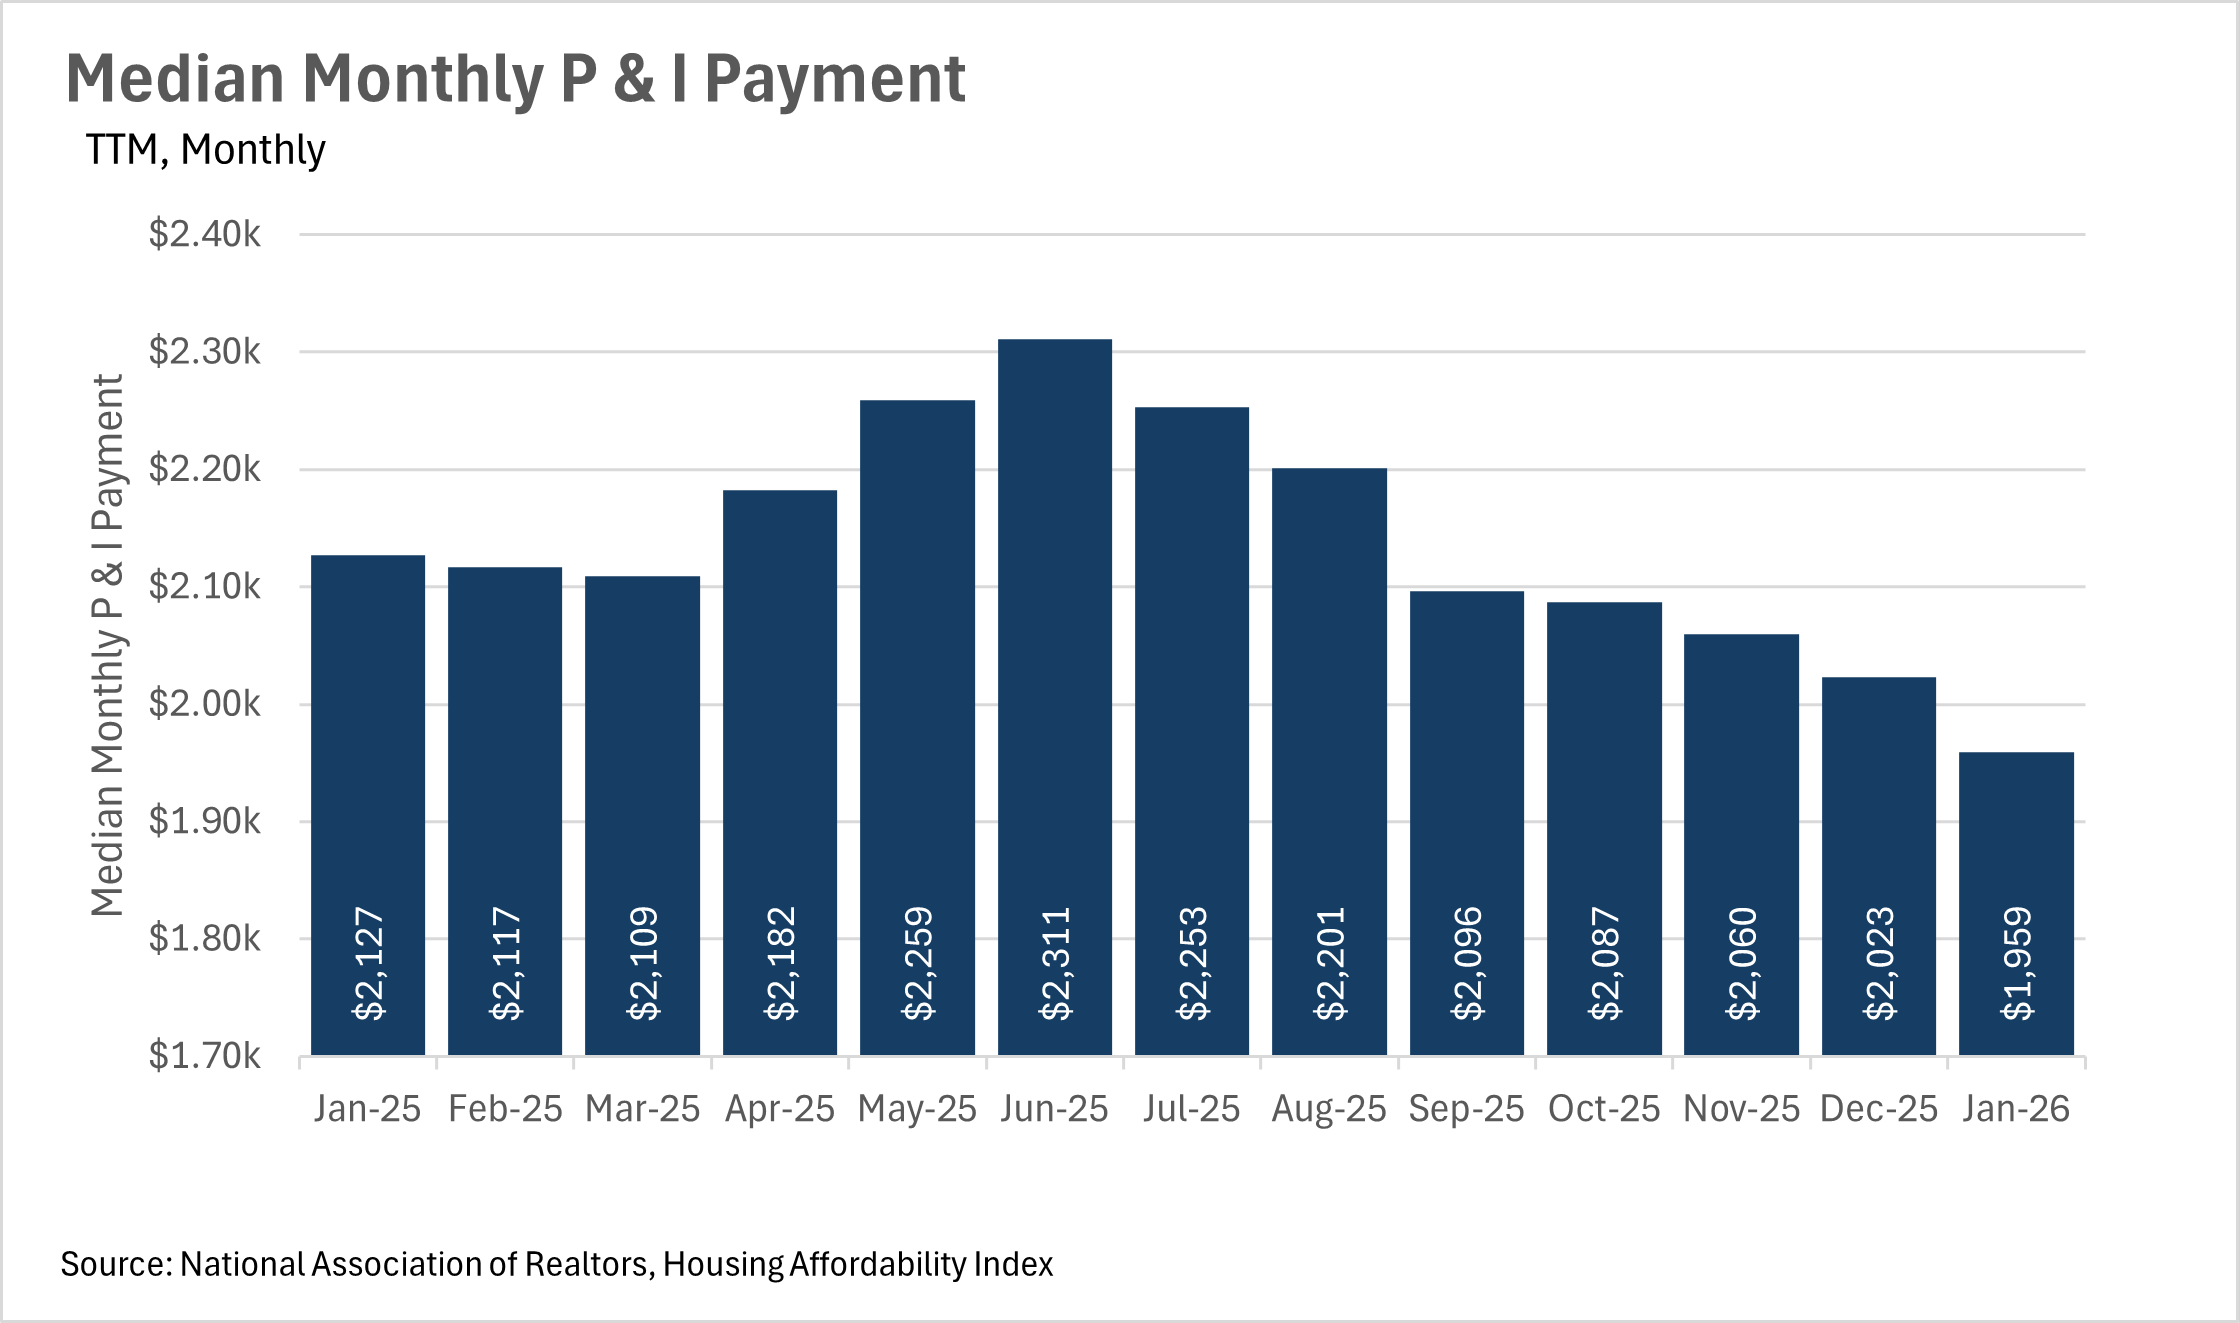
One of the biggest stories in the housing market right now is the continued decline in mortgage rates, and what that means for the average homebuyer's wallet. The average 30-year mortgage rate sat at 6.16% in January, representing a 10.85% year-over-year decline from the 6.91% we were seeing just a year ago. This decline in rates has had a direct impact on monthly payments, with the median monthly P&I payment coming in at $1,959 in January, down 7.90% from the $2,127 that the median homeowner was paying this time last year. That's roughly $168 per month in savings, which is great news for the average American.
However, despite the fact that rates have come down substantially, the median home sale price has remained remarkably stable, coming in at $396,800 in January. This represents just a 0.86% increase on a year-over-year basis, and a 2.05% decline from December. It seems like the market has found a bit of equilibrium, as lower rates are being offset by cautious buyers who aren't quite ready to jump back in just yet.
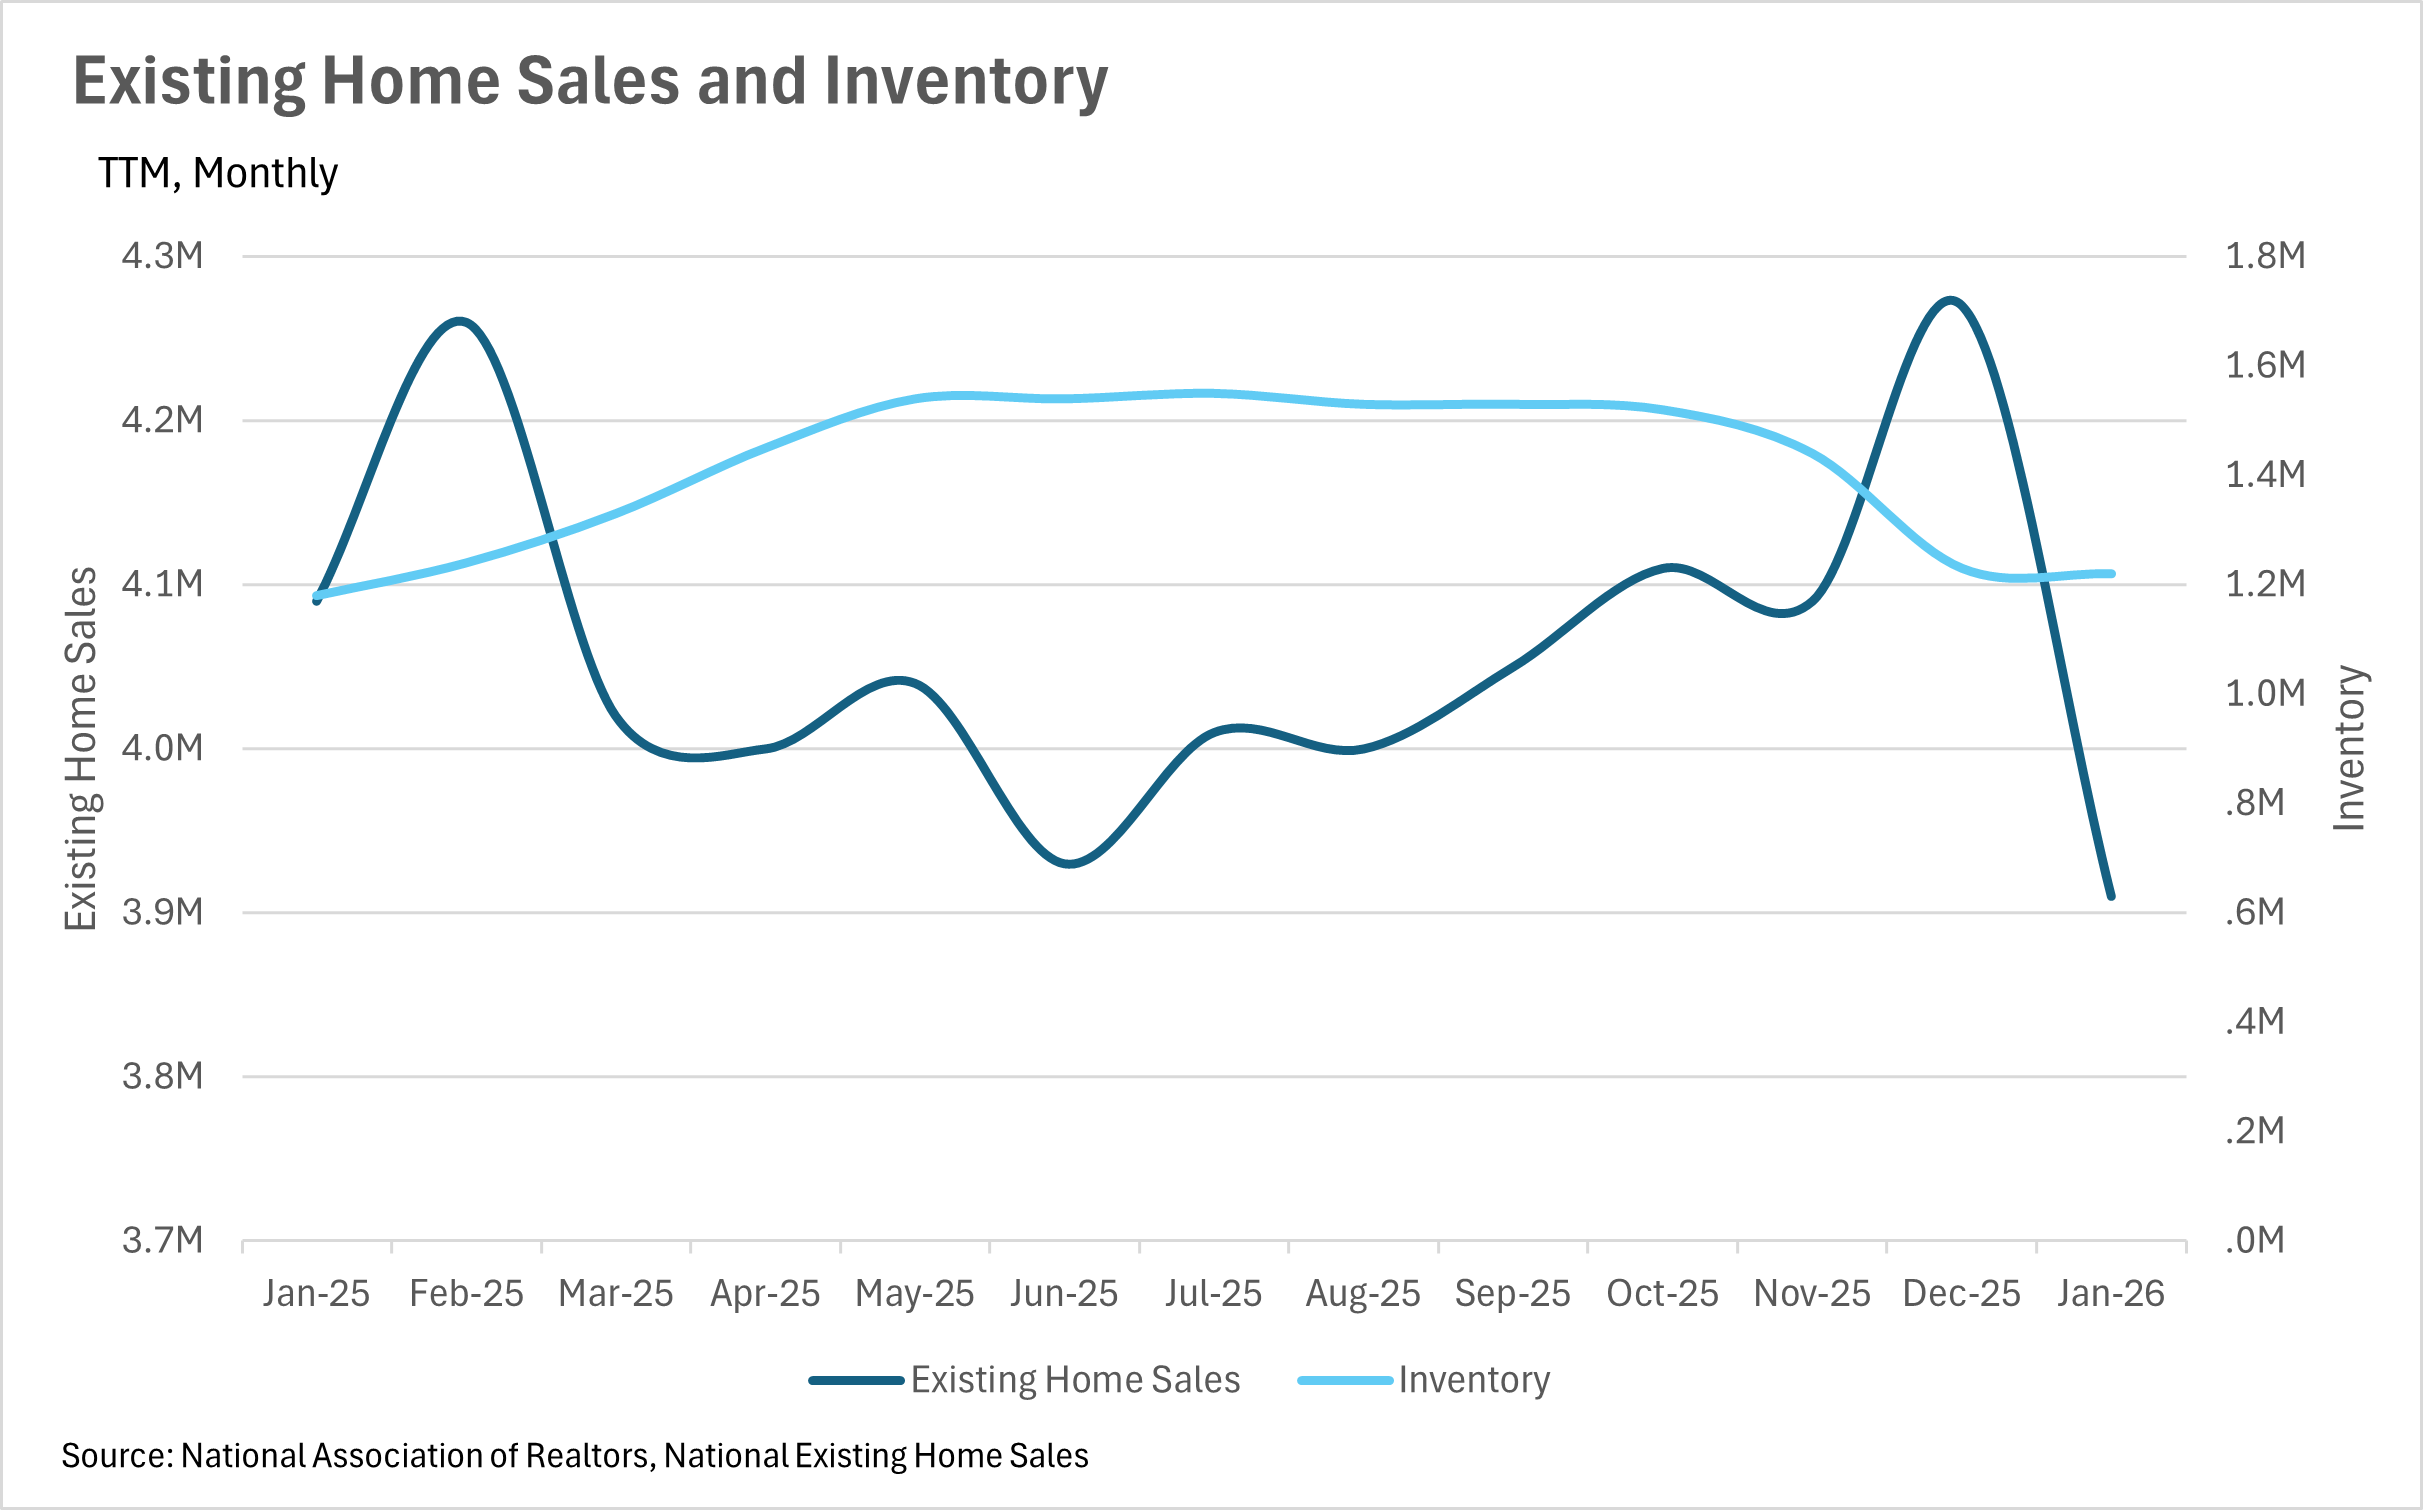
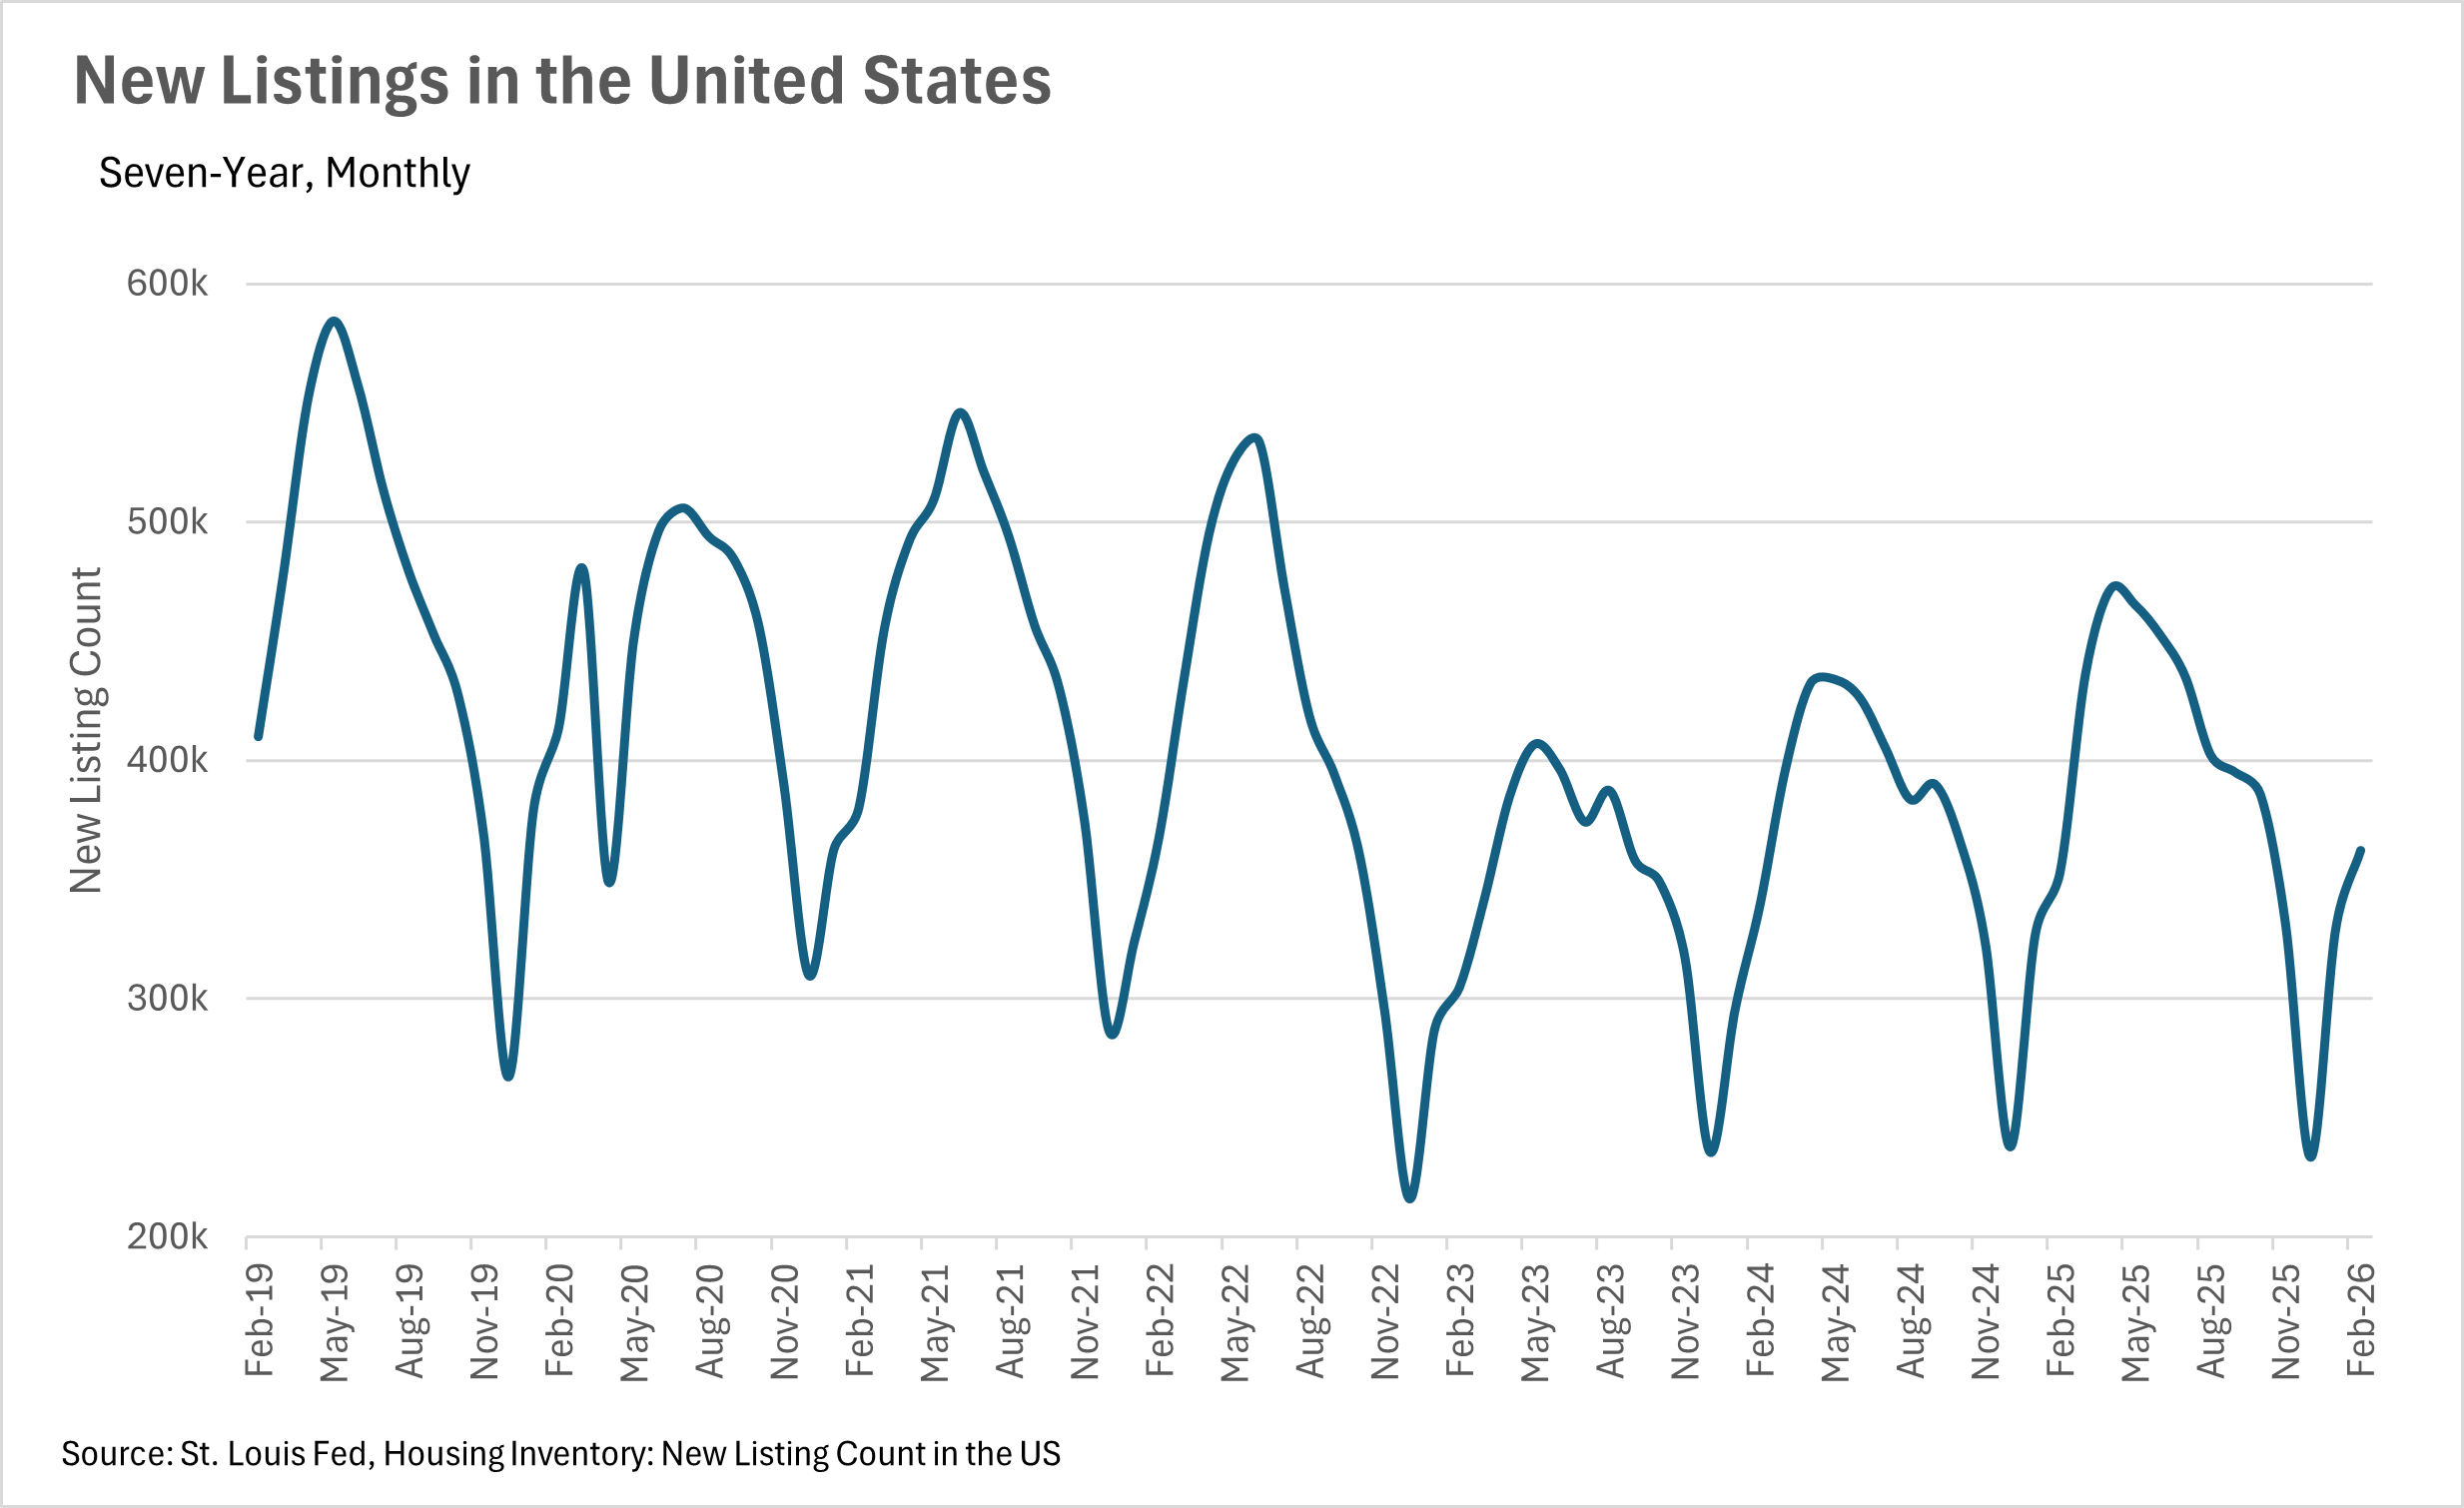
As we move out of the seasonally slow winter months, we're starting to see new listings pick up, which is a great sign for the market heading into the spring. In February, there were 362,180 new listings that hit the market, representing a 2.41% year-over-year increase and a 10.01% month-over-month increase. This uptick in new listings is encouraging, as it suggests that homeowners are starting to feel more comfortable putting their homes on the market. On the inventory side, there were 1,220,000 homes available for sale in January, which is up 3.39% on a year-over-year basis. While this is certainly a step in the right direction, it's worth noting that inventory levels are still well below the levels we need to see in order for the market to truly become balanced. That said, the combination of rising new listings and modestly higher inventory levels should give buyers a few more options to choose from as we head into the busier spring months.
Despite the fact that mortgage rates have come down by nearly 11% on a year-over-year basis, buyers are still being cautious. In January, existing home sales came in at 3,910,000, representing a 4.40% decline on a year-over-year basis and an 8.43% decline from December. This tells us that while the affordability picture has improved quite a bit, many buyers are still waiting for rates to come down even further before they make their move. It's also worth considering that the seasonal slowdown plays a role here, as January is historically one of the slower months for home sales. As we move into the spring and summer, it'll be worth keeping a close eye on this metric to see if the lower rates and increasing inventory levels are enough to bring buyers off the sidelines.
Right now, the national market is in an interesting position. Inventory levels are slightly higher than they were last year, but existing home sales have declined, which means that the supply of homes on the market is lasting a bit longer than it was at this time last year. With new listings beginning to pick up heading into the spring, and buyers still largely sitting on the sidelines, we could see inventory continue to build in the coming months. However, if mortgage rates continue to trend downward, that could be the catalyst that brings buyers back into the market in a big way. As always, real estate is a highly localized asset, which is why you should check out what's going on in your local market below in the Local Lowdown!
Note: You can find the charts/graphs for the Local Lowdown at the end of this section.
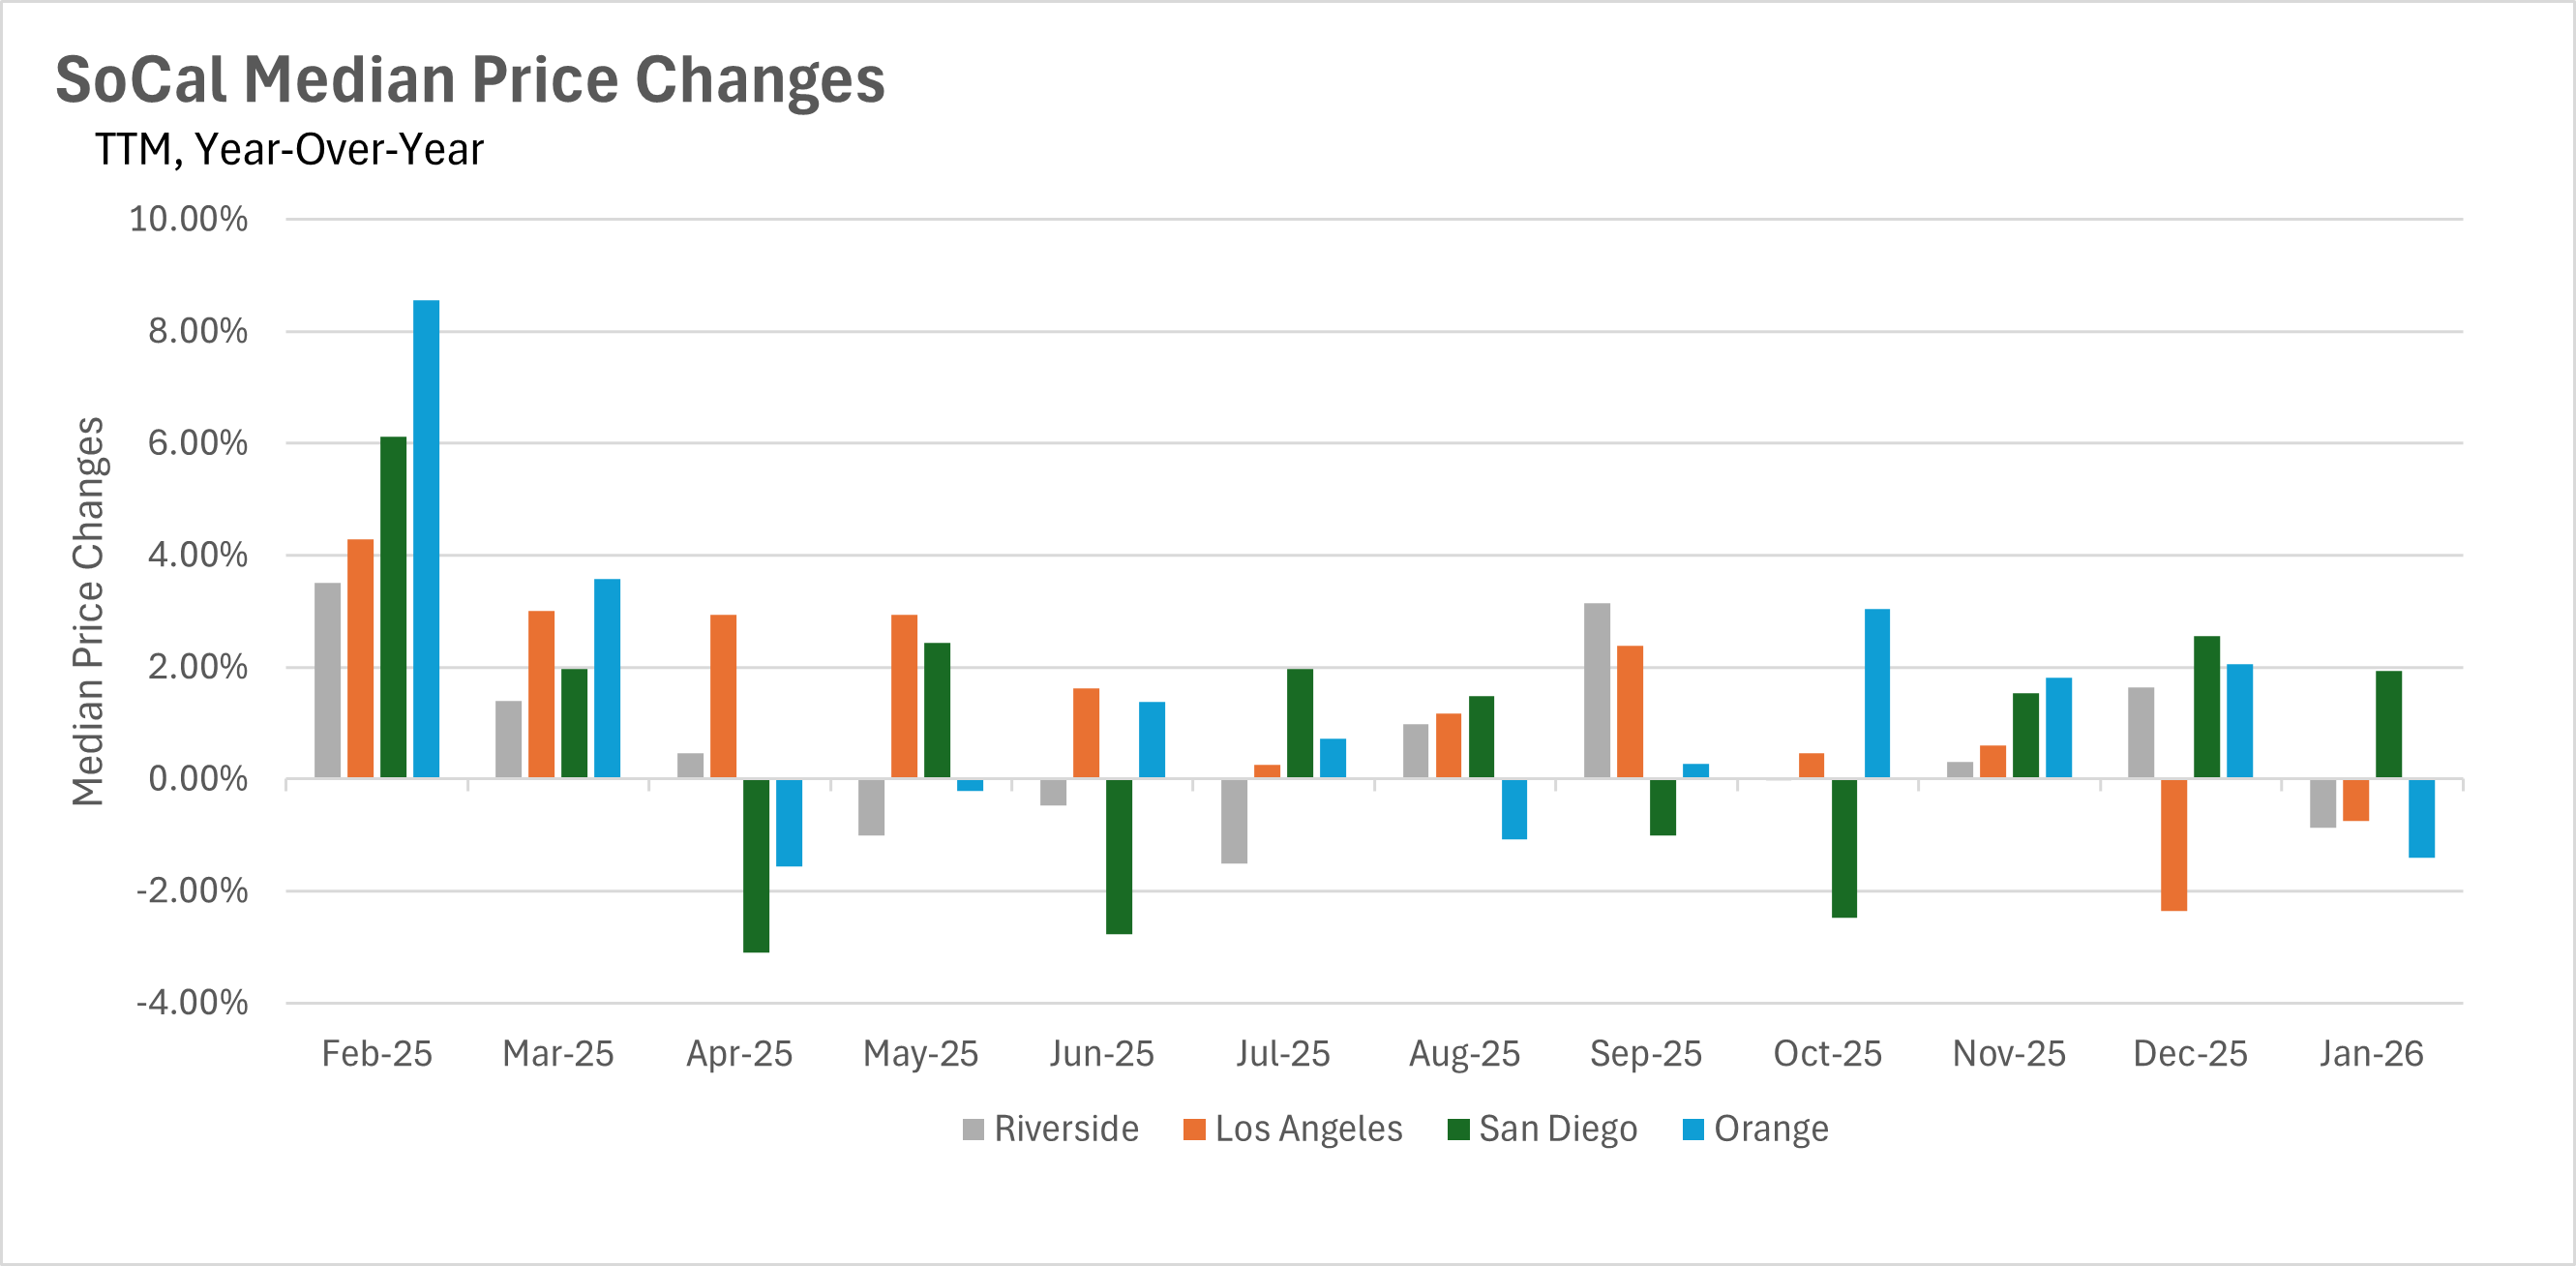
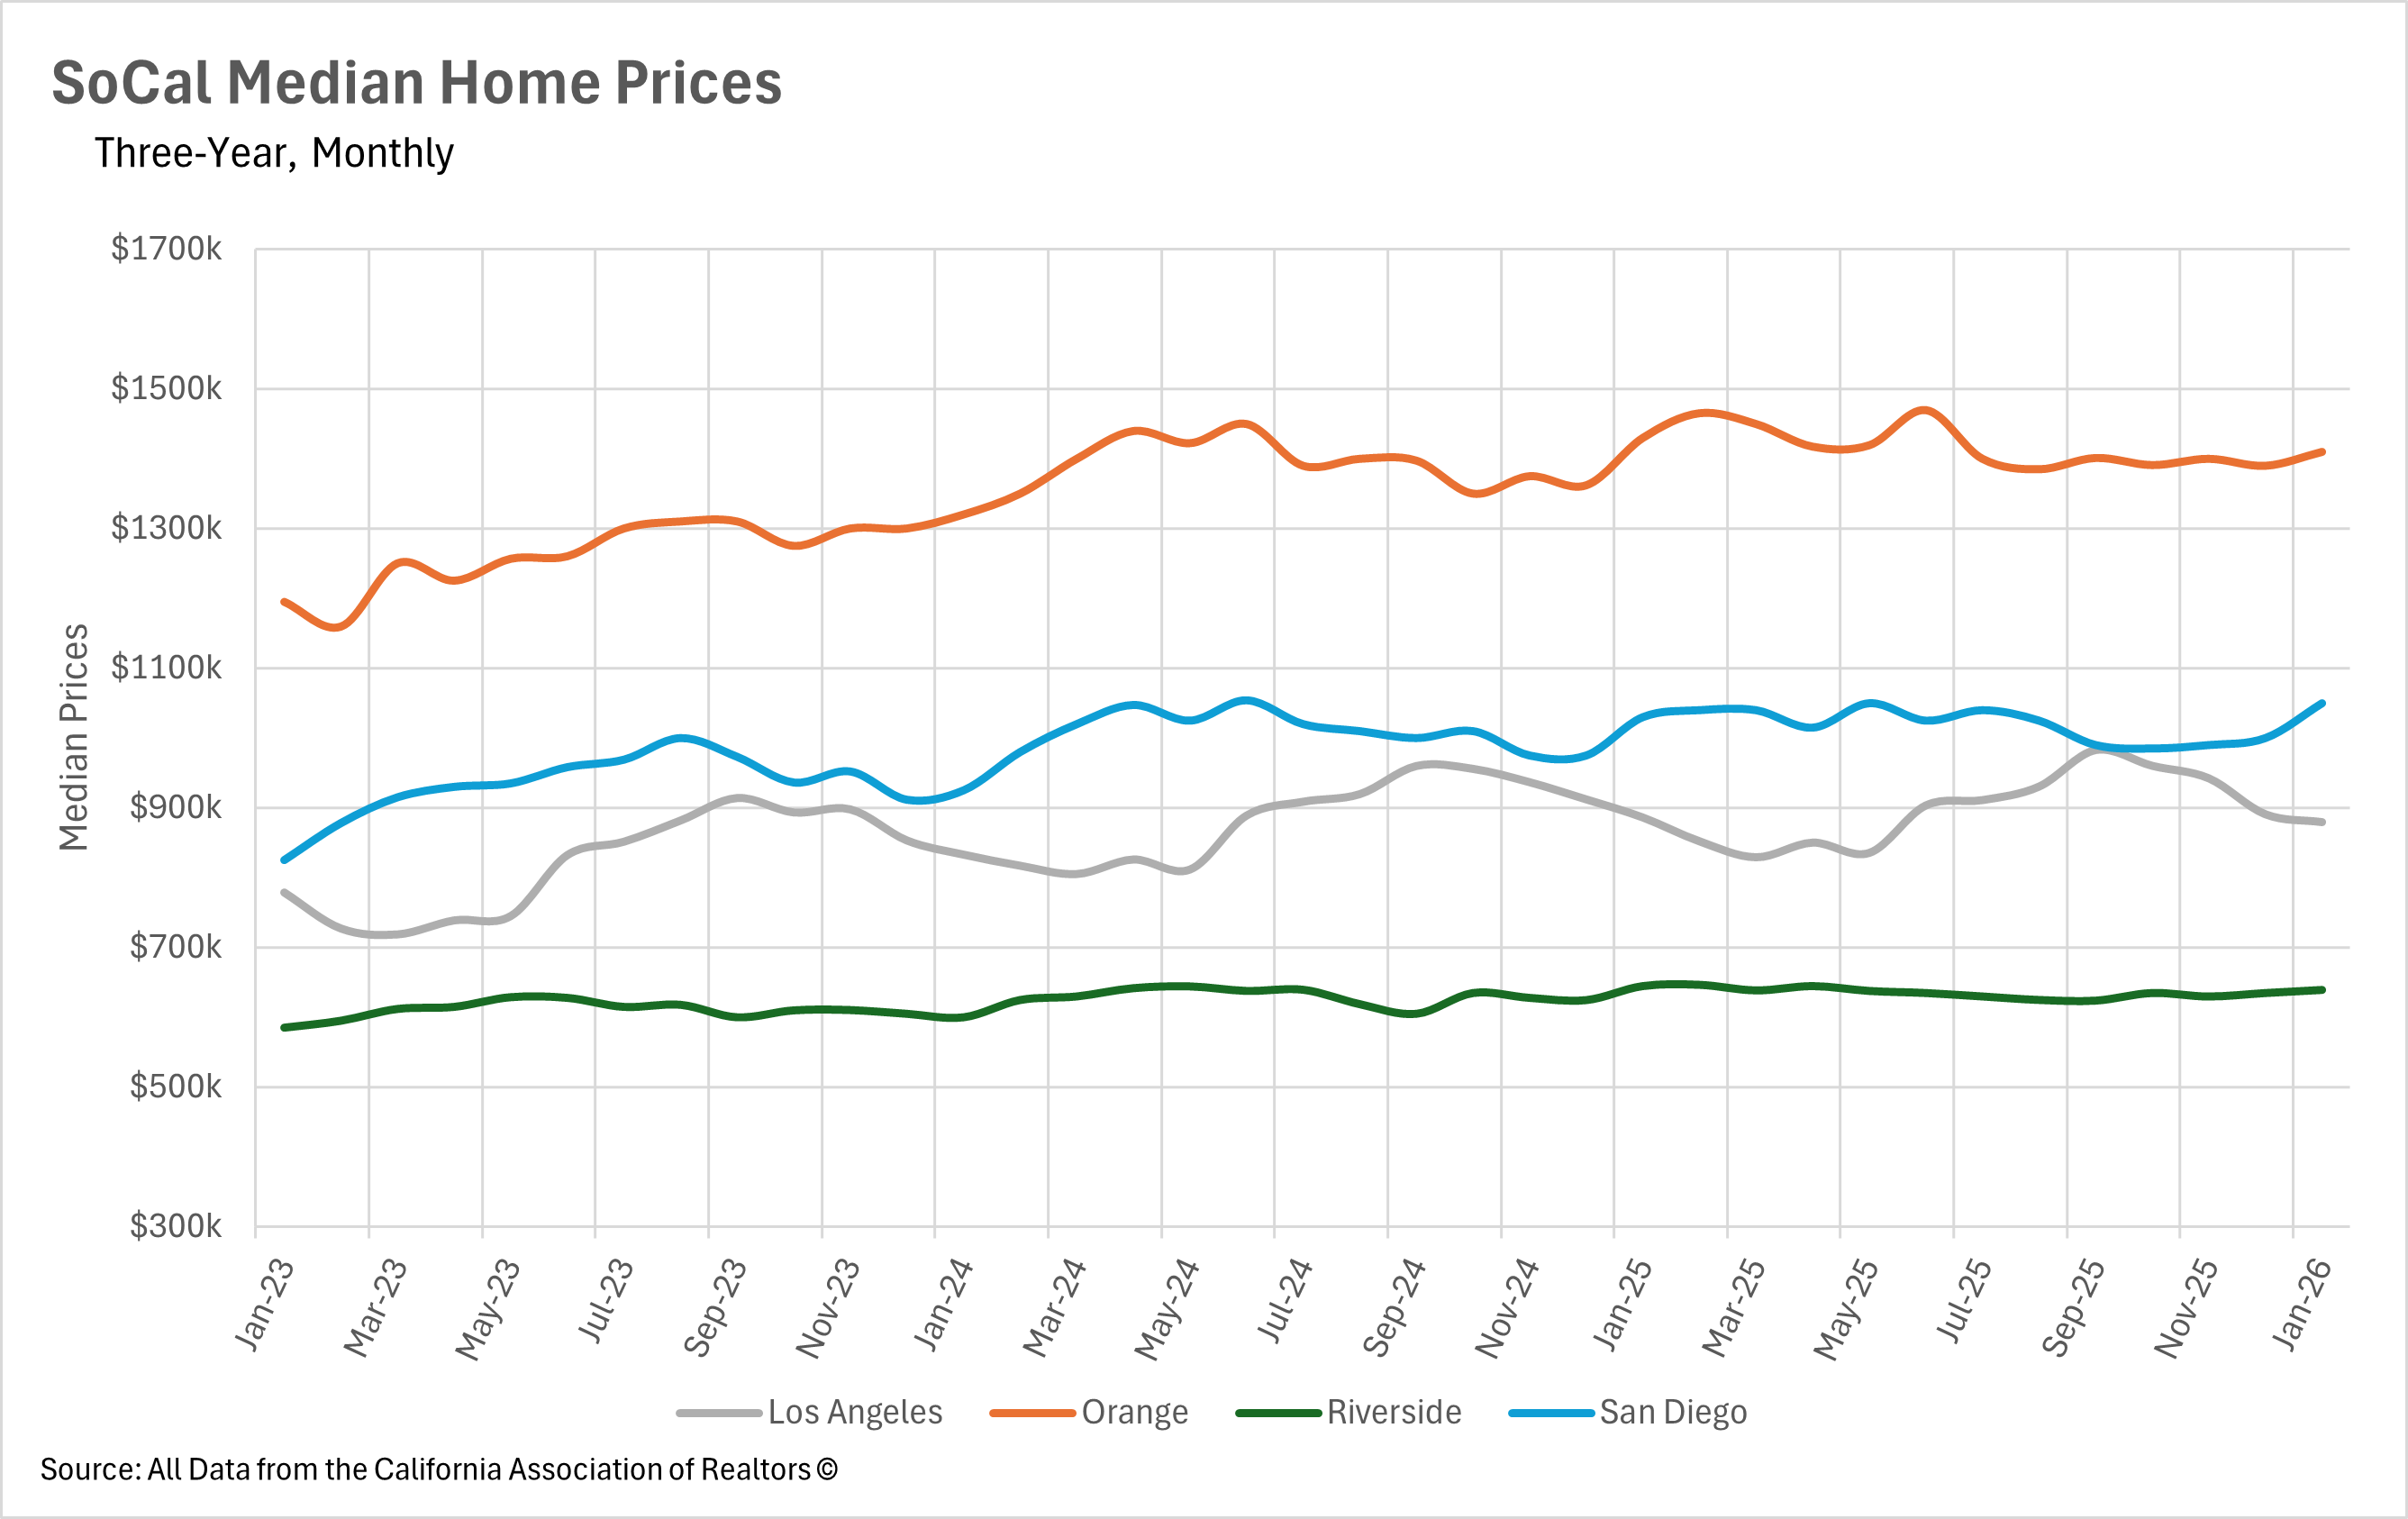
Southern California's housing markets are showing mixed results on the pricing front as we kick off 2026. San Diego continues to be the bright spot, with the median single-family home selling for $1,050,000 in January, representing a solid 1.94% year-over-year increase. This marks the third consecutive month of year-over-year gains for San Diego after a bumpy middle portion of 2025. However, the other three markets in the region are telling a different story. Los Angeles posted its second consecutive month of year-over-year declines, with the median sale price coming in at $879,720, down 0.75% from last year. Orange County also dipped into negative territory after four consecutive months of gains, with the median single-family home selling for $1,410,000, a 1.40% year-over-year decline. Riverside rounded out the mixed picture with a modest 0.86% year-over-year decline, bringing its median sale price to $639,440. It will be interesting to see whether San Diego's momentum spreads to the rest of the region as we move into the spring selling season.
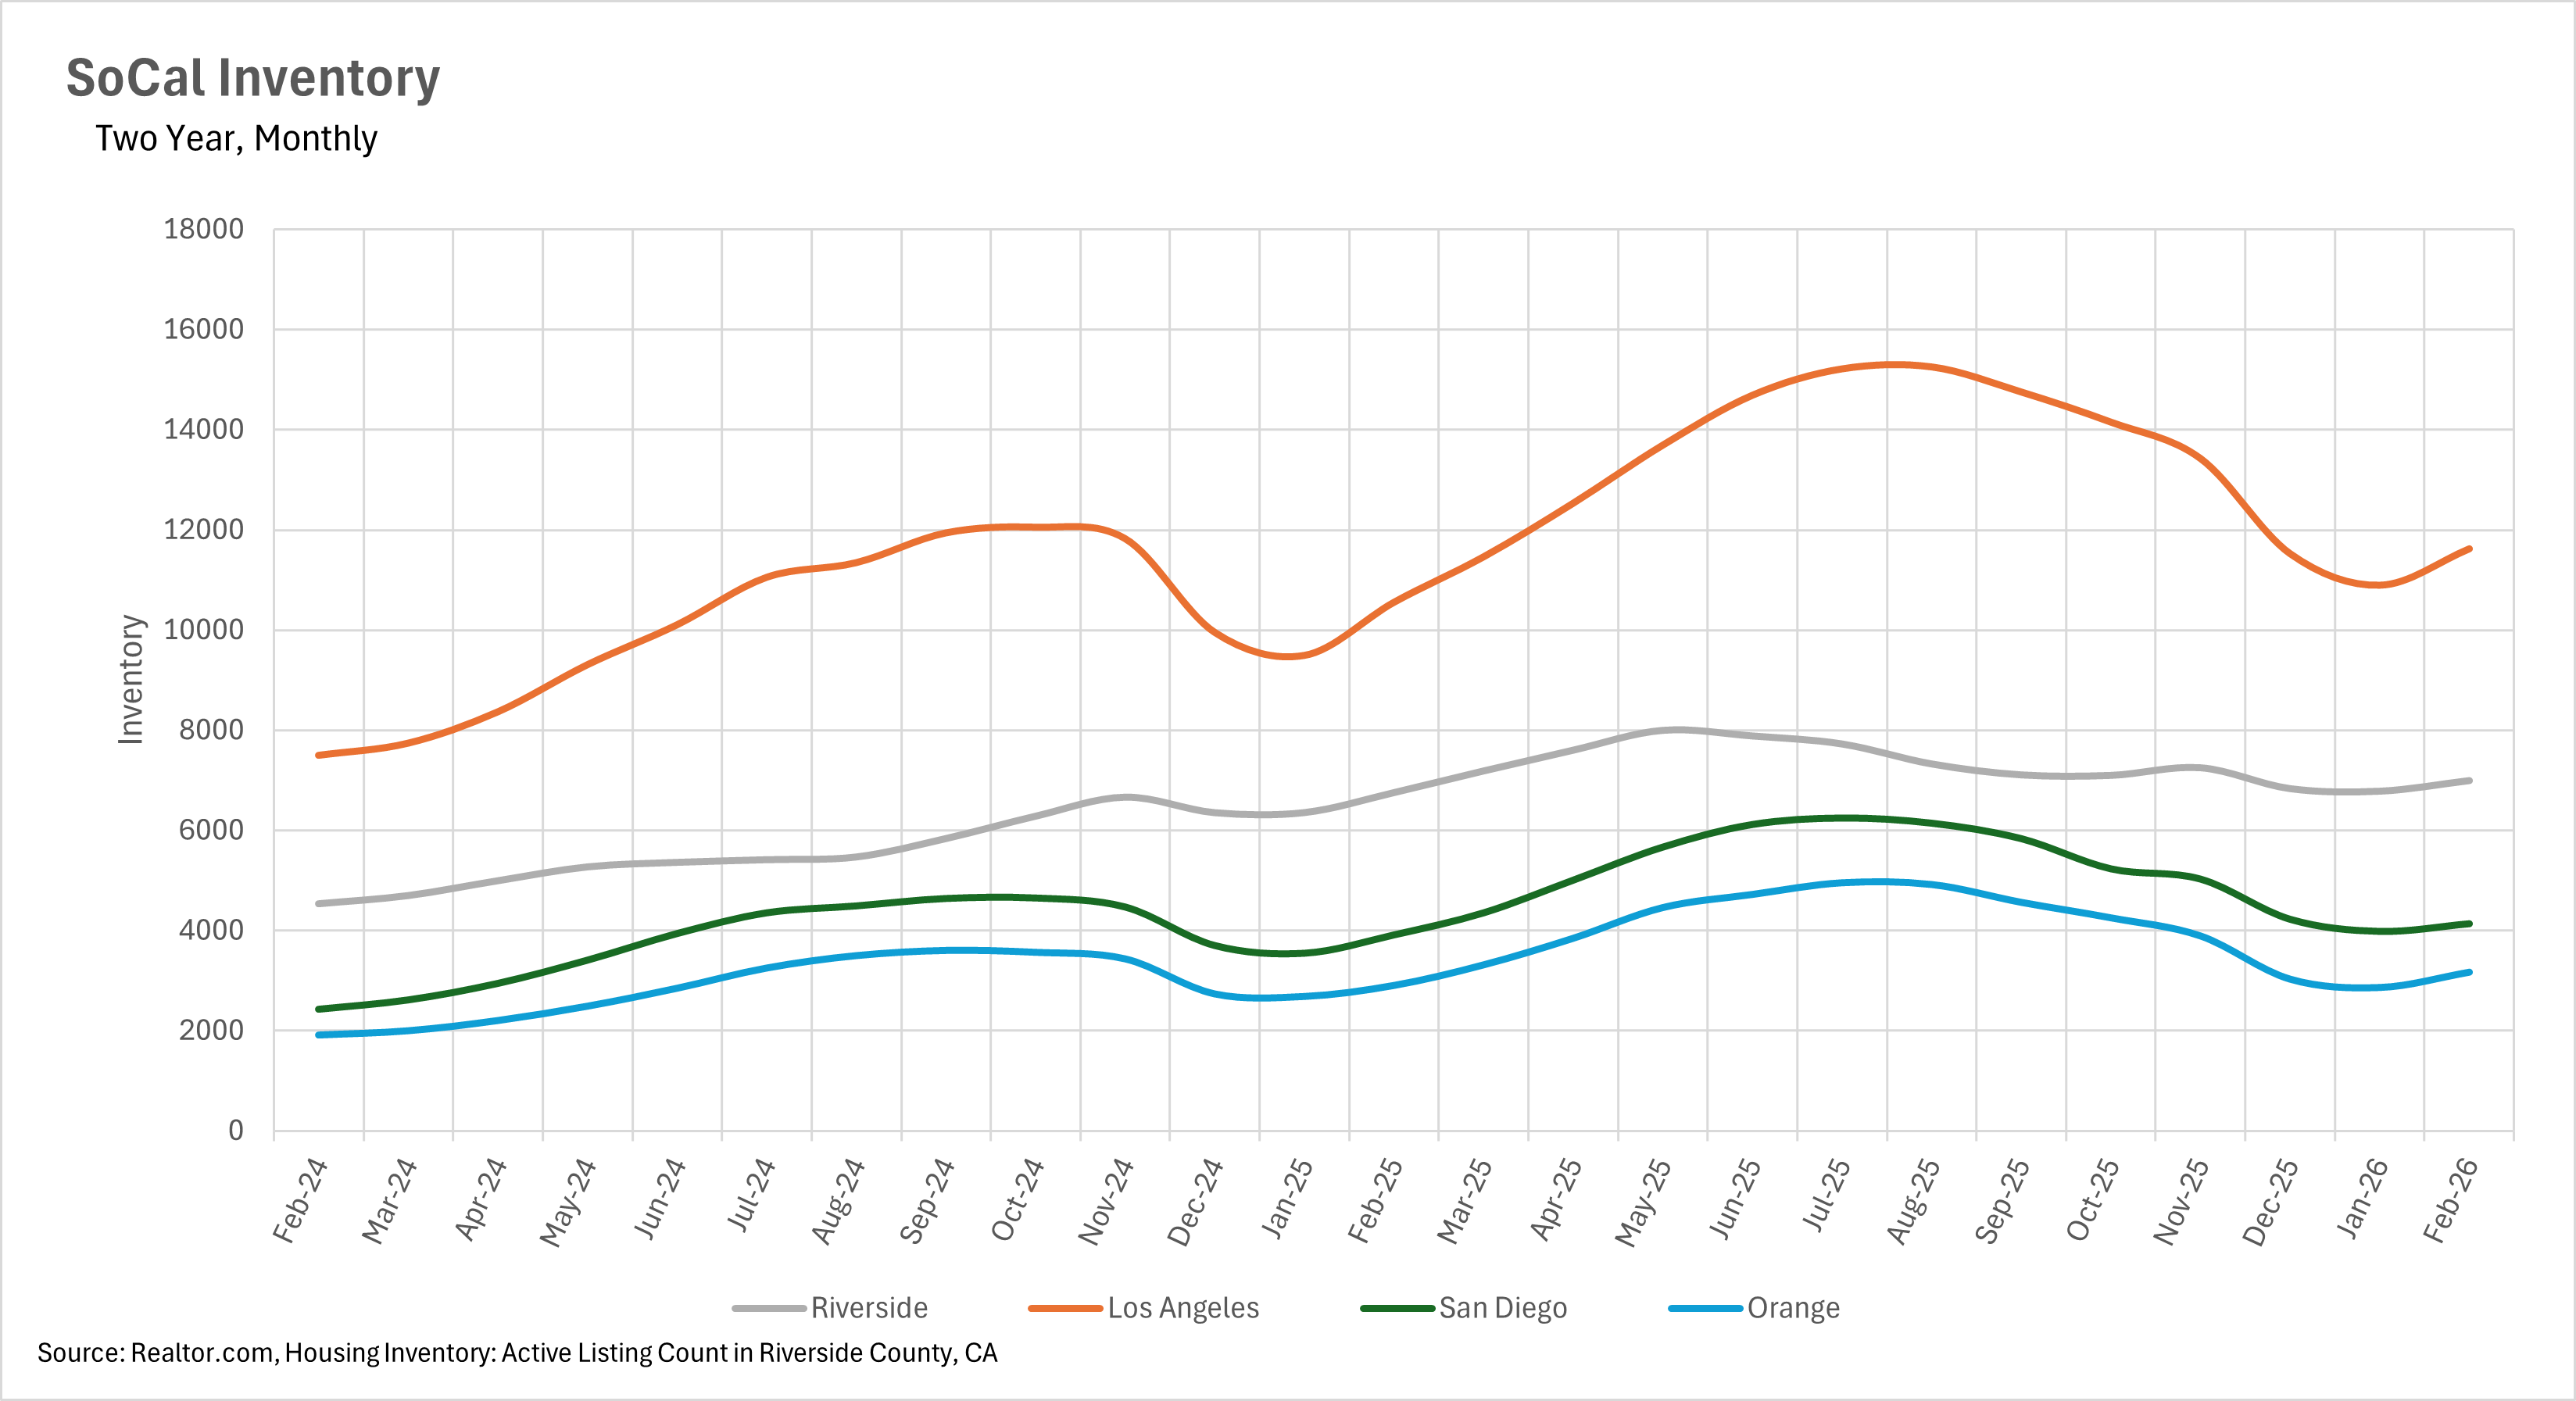
Inventory levels continue to climb throughout Southern California, giving buyers more options to choose from as we approach the spring selling season. Los Angeles leads the way with 11,624 active single-family home listings on the market as of February, representing a 10.13% increase on a year-over-year basis. Orange County follows with a 9.13% year-over-year increase, bringing active listings to 3,166. Riverside has seen inventory climb by 7.53% year-over-year to 6,991 homes, while San Diego has the smallest gap at just 5.70%, with 4,133 active listings. It's worth noting that San Diego's inventory picture has largely stabilized compared to the double-digit year-over-year increases we saw throughout the summer of 2025. Across the board, the month-over-month increases we're seeing are consistent with the typical seasonal pattern of new inventory entering the market as we approach the warmer months.
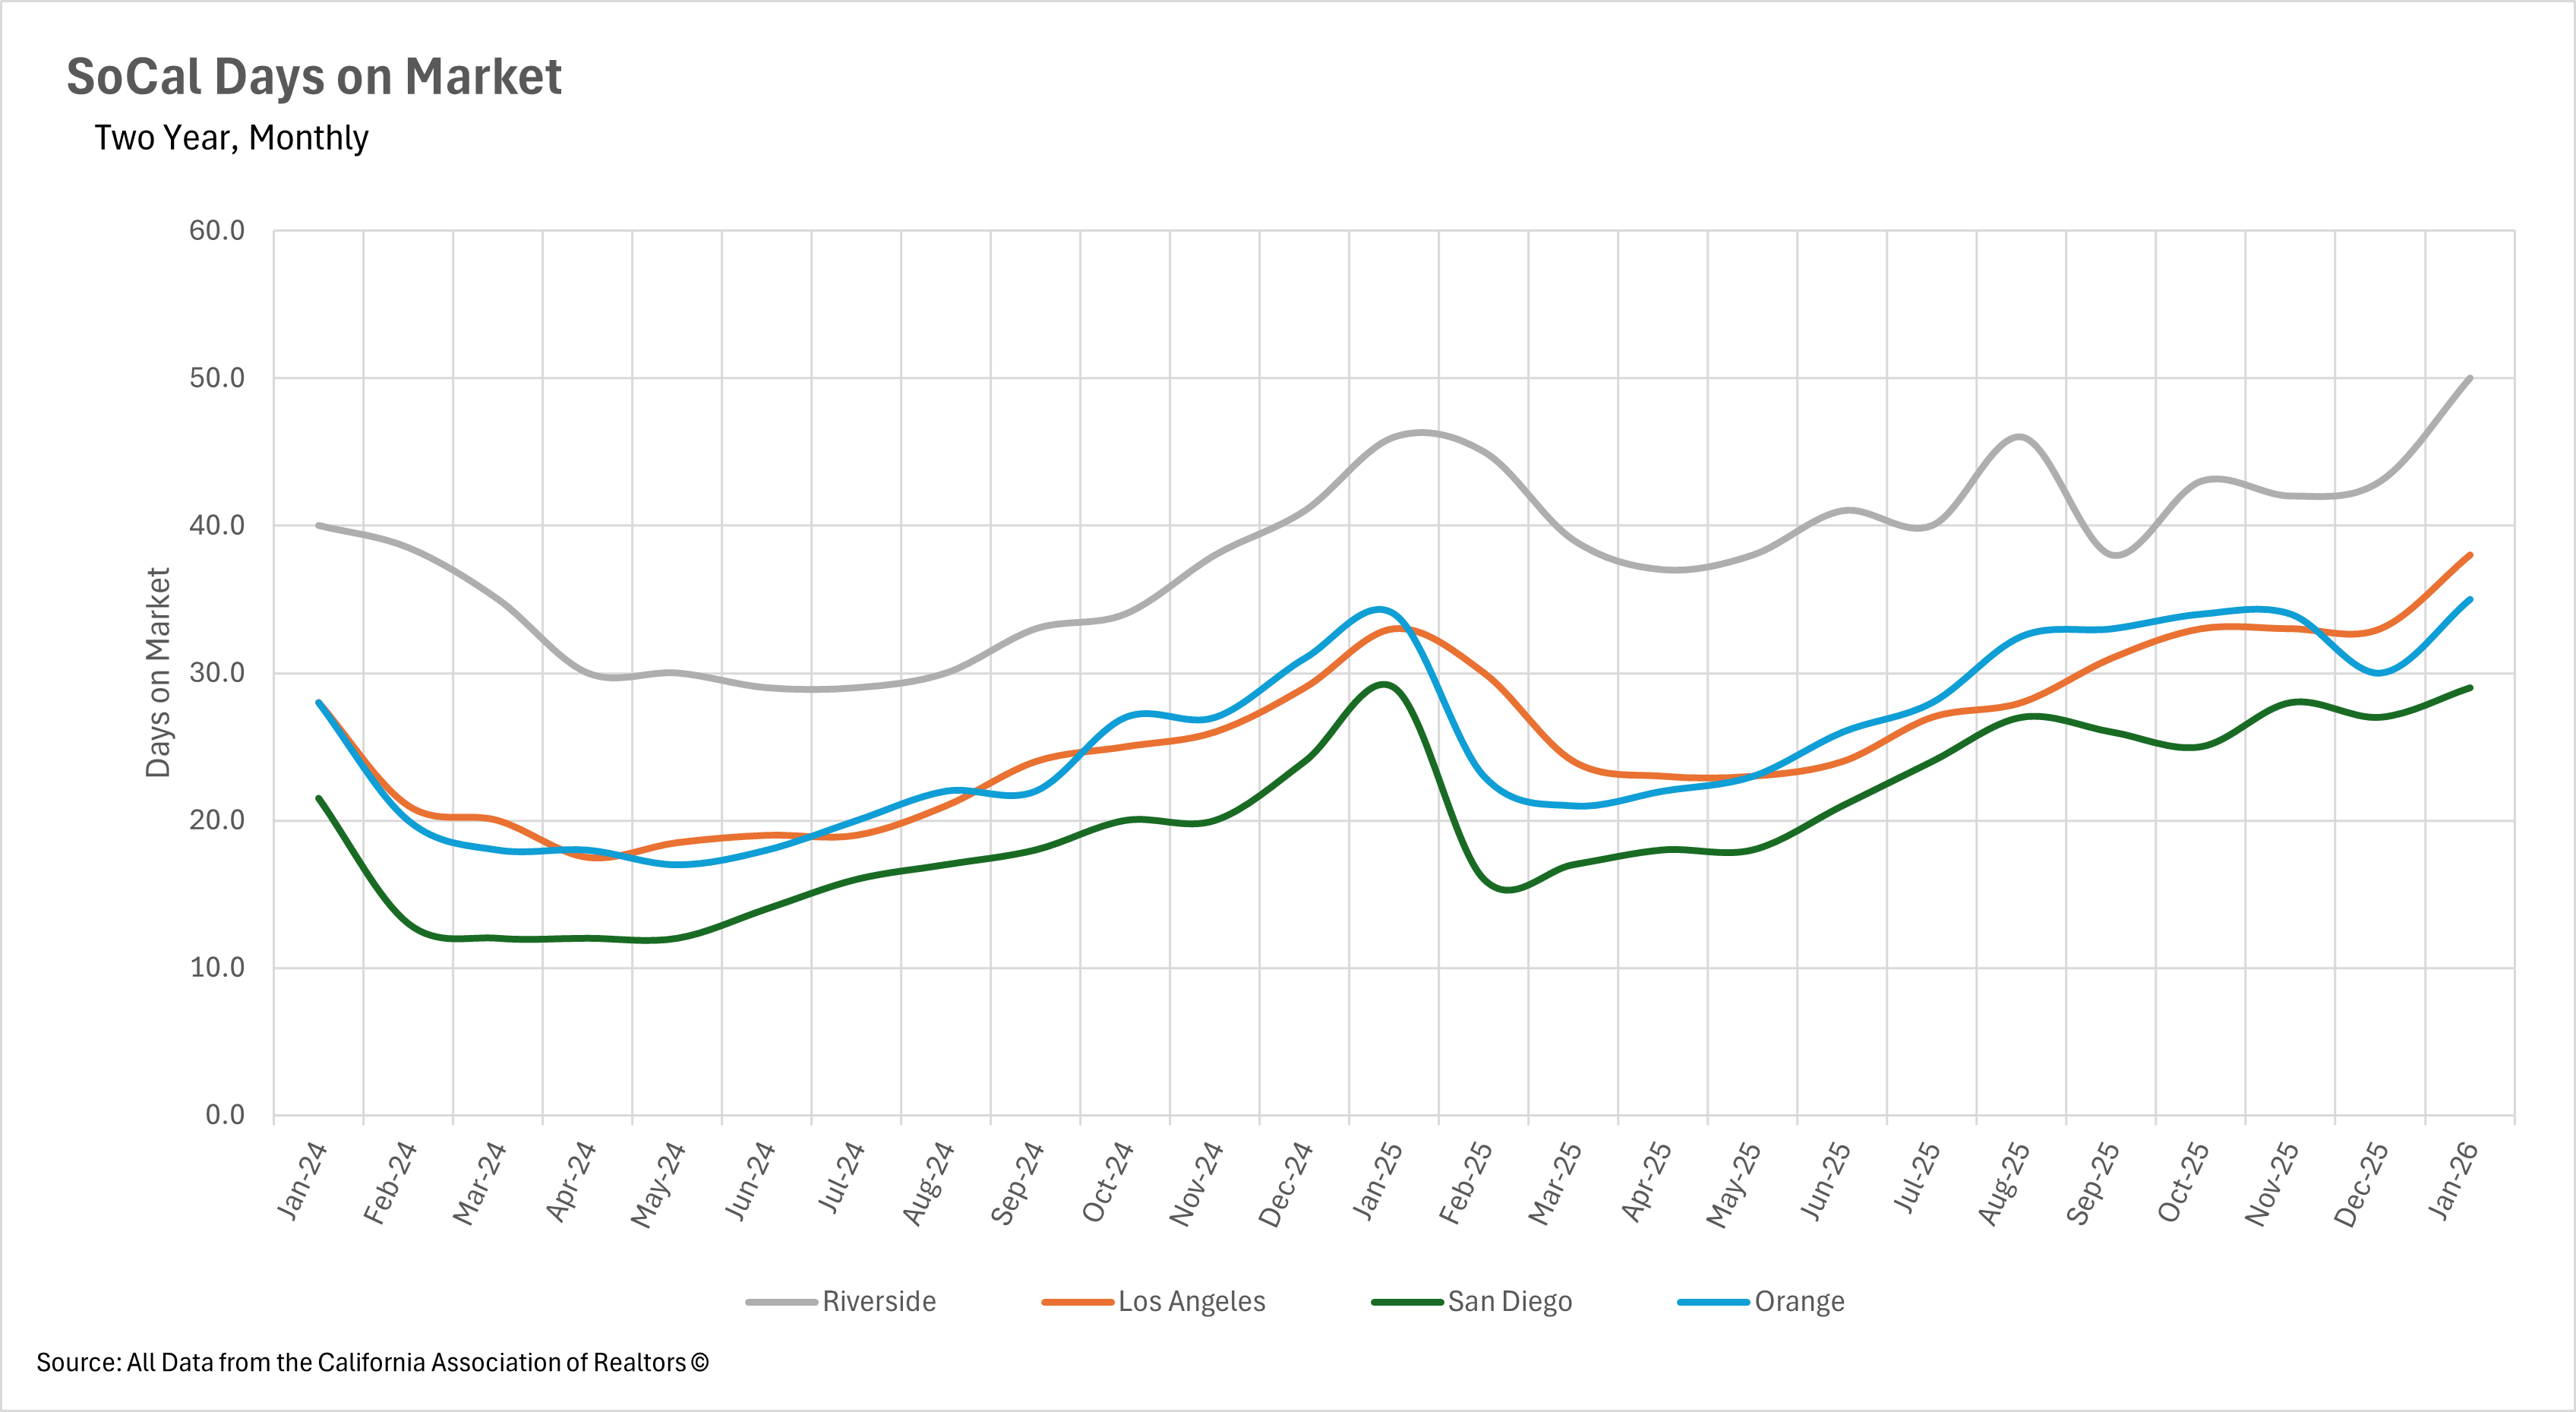
With inventory levels on the rise, it should come as no surprise that listings are spending more time on the market across Southern California. Riverside continues to see the longest selling times, with the median listing sitting for 50 days in January, representing a 10.53% increase on a year-over-year basis. Los Angeles is also seeing elevated market times at 38 days, up 15.15% from last year, which marks a meaningful jump from the 33 days we saw in each of the prior three months. Orange County saw listings spend 35 days on the market, a modest 2.94% year-over-year increase. The one bright spot is San Diego, where the median listing sat for 29 days, completely flat on a year-over-year basis. This stabilization in San Diego suggests that buyer activity is keeping pace with the flow of new inventory entering the market, while buyers in the other three markets are clearly taking more time to evaluate their options before pulling the trigger on offers.
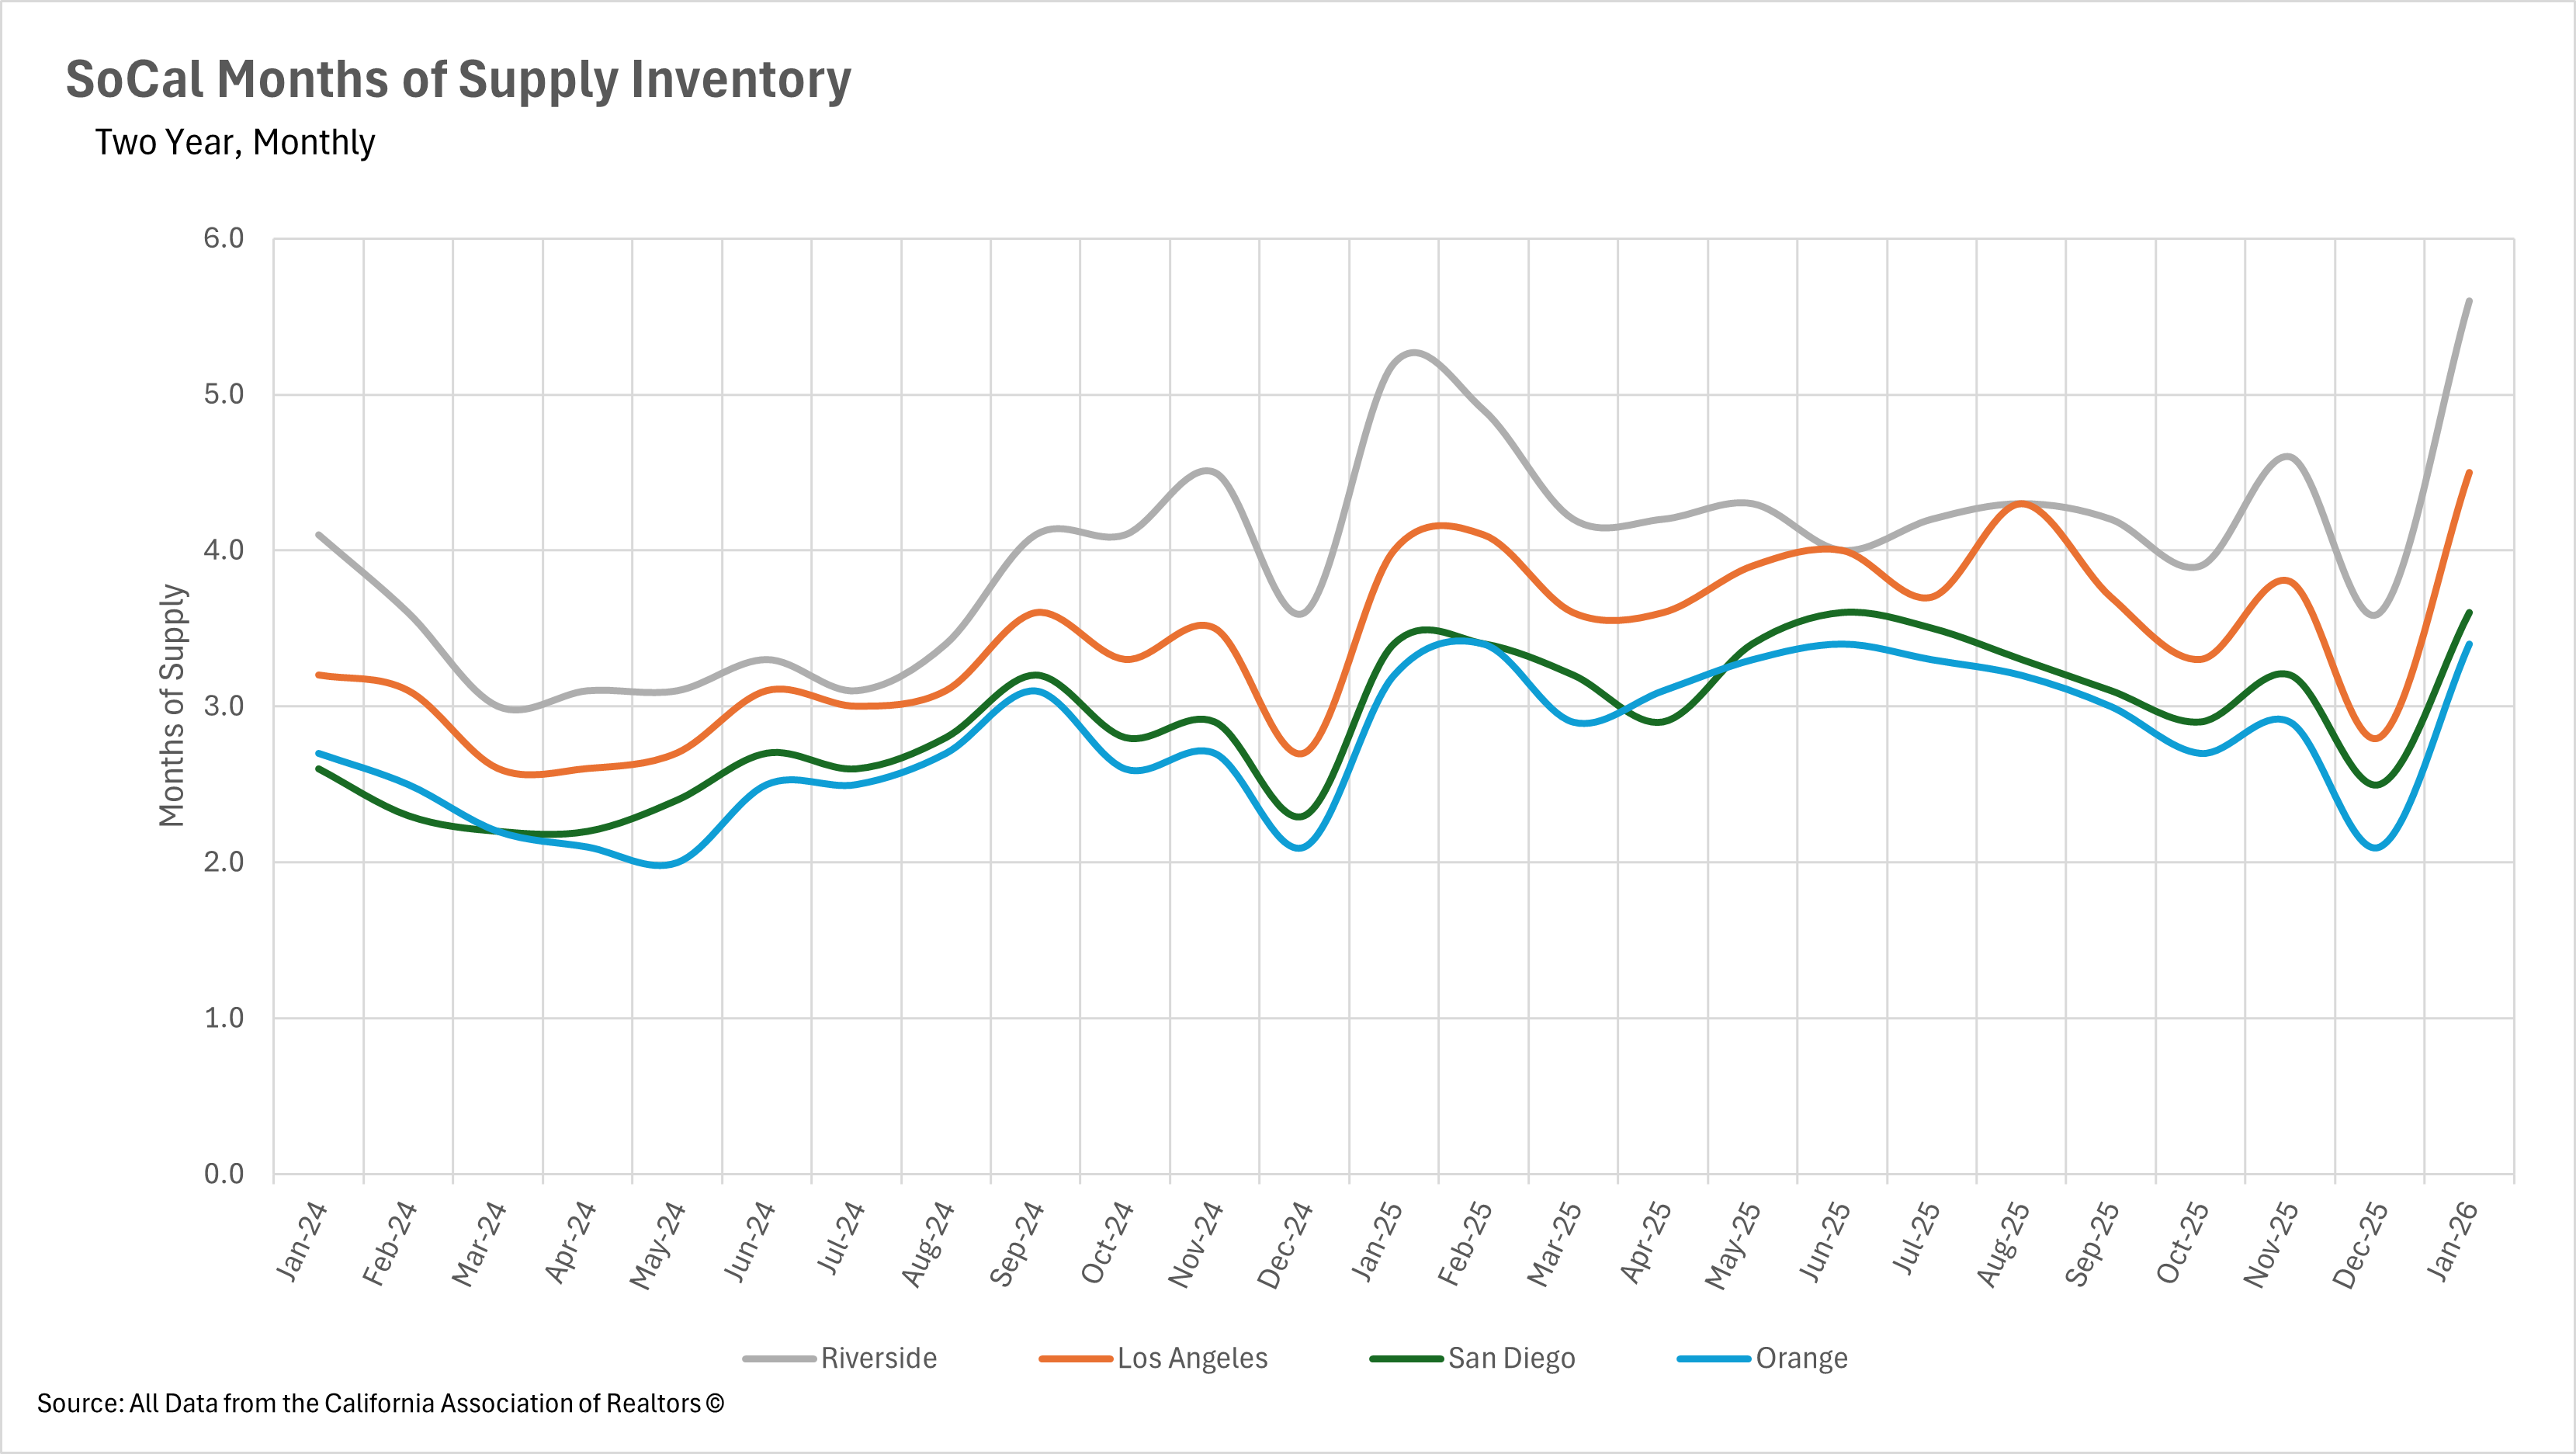
When determining whether a market is a buyers' market or a sellers' market, we look to the Months of Supply Inventory (MSI) metric. The state of California has historically averaged around three months of MSI, so any area with at or around three months of MSI is considered a balanced market. Any market that has lower than three months of MSI is considered a seller's market, whereas markets with more than three months of MSI are considered buyers' markets.
After briefly dipping into seller's market territory at the end of 2025, all four major Southern California markets have swung back into buyer's market territory to kick off the new year. Riverside leads the way with 5.6 months of supply, placing it firmly in buyer's market territory. Los Angeles follows with 4.5 months of supply, representing a 60.71% month-over-month increase and the highest level we've seen in more than a year. San Diego has 3.6 months of supply, up 44.00% from December, while Orange County sits at 3.4 months, a massive 61.90% month-over-month increase. This seasonal bounce is not uncommon, as buyer activity tends to slow during the winter months while new inventory enters the market. The big question heading into the spring is whether the uptick in demand that typically accompanies the warmer months will be enough to bring these figures back down, or if buyers will continue to hold the upper hand throughout the selling season.
Stay up to date on the latest real estate trends.

July 2026

A Closer Look at Dallas Rental Prices, Hidden Costs, and What Renters Need to Know Before Moving

June 2026

May 2026
April 2026

March 2026

February 2026
January 2026

Trusted Experts in the Palisades, Santa Monica, and Brentwood Real Estate Markets
You’ve got questions and we can’t wait to answer them.