Market Update Los Angeles

Note: You can find the charts & graphs for the Big Story at the end of the following section.
*National Association of REALTORS® data is released two months behind, so we estimate the most recent month’s data when possible and appropriate.
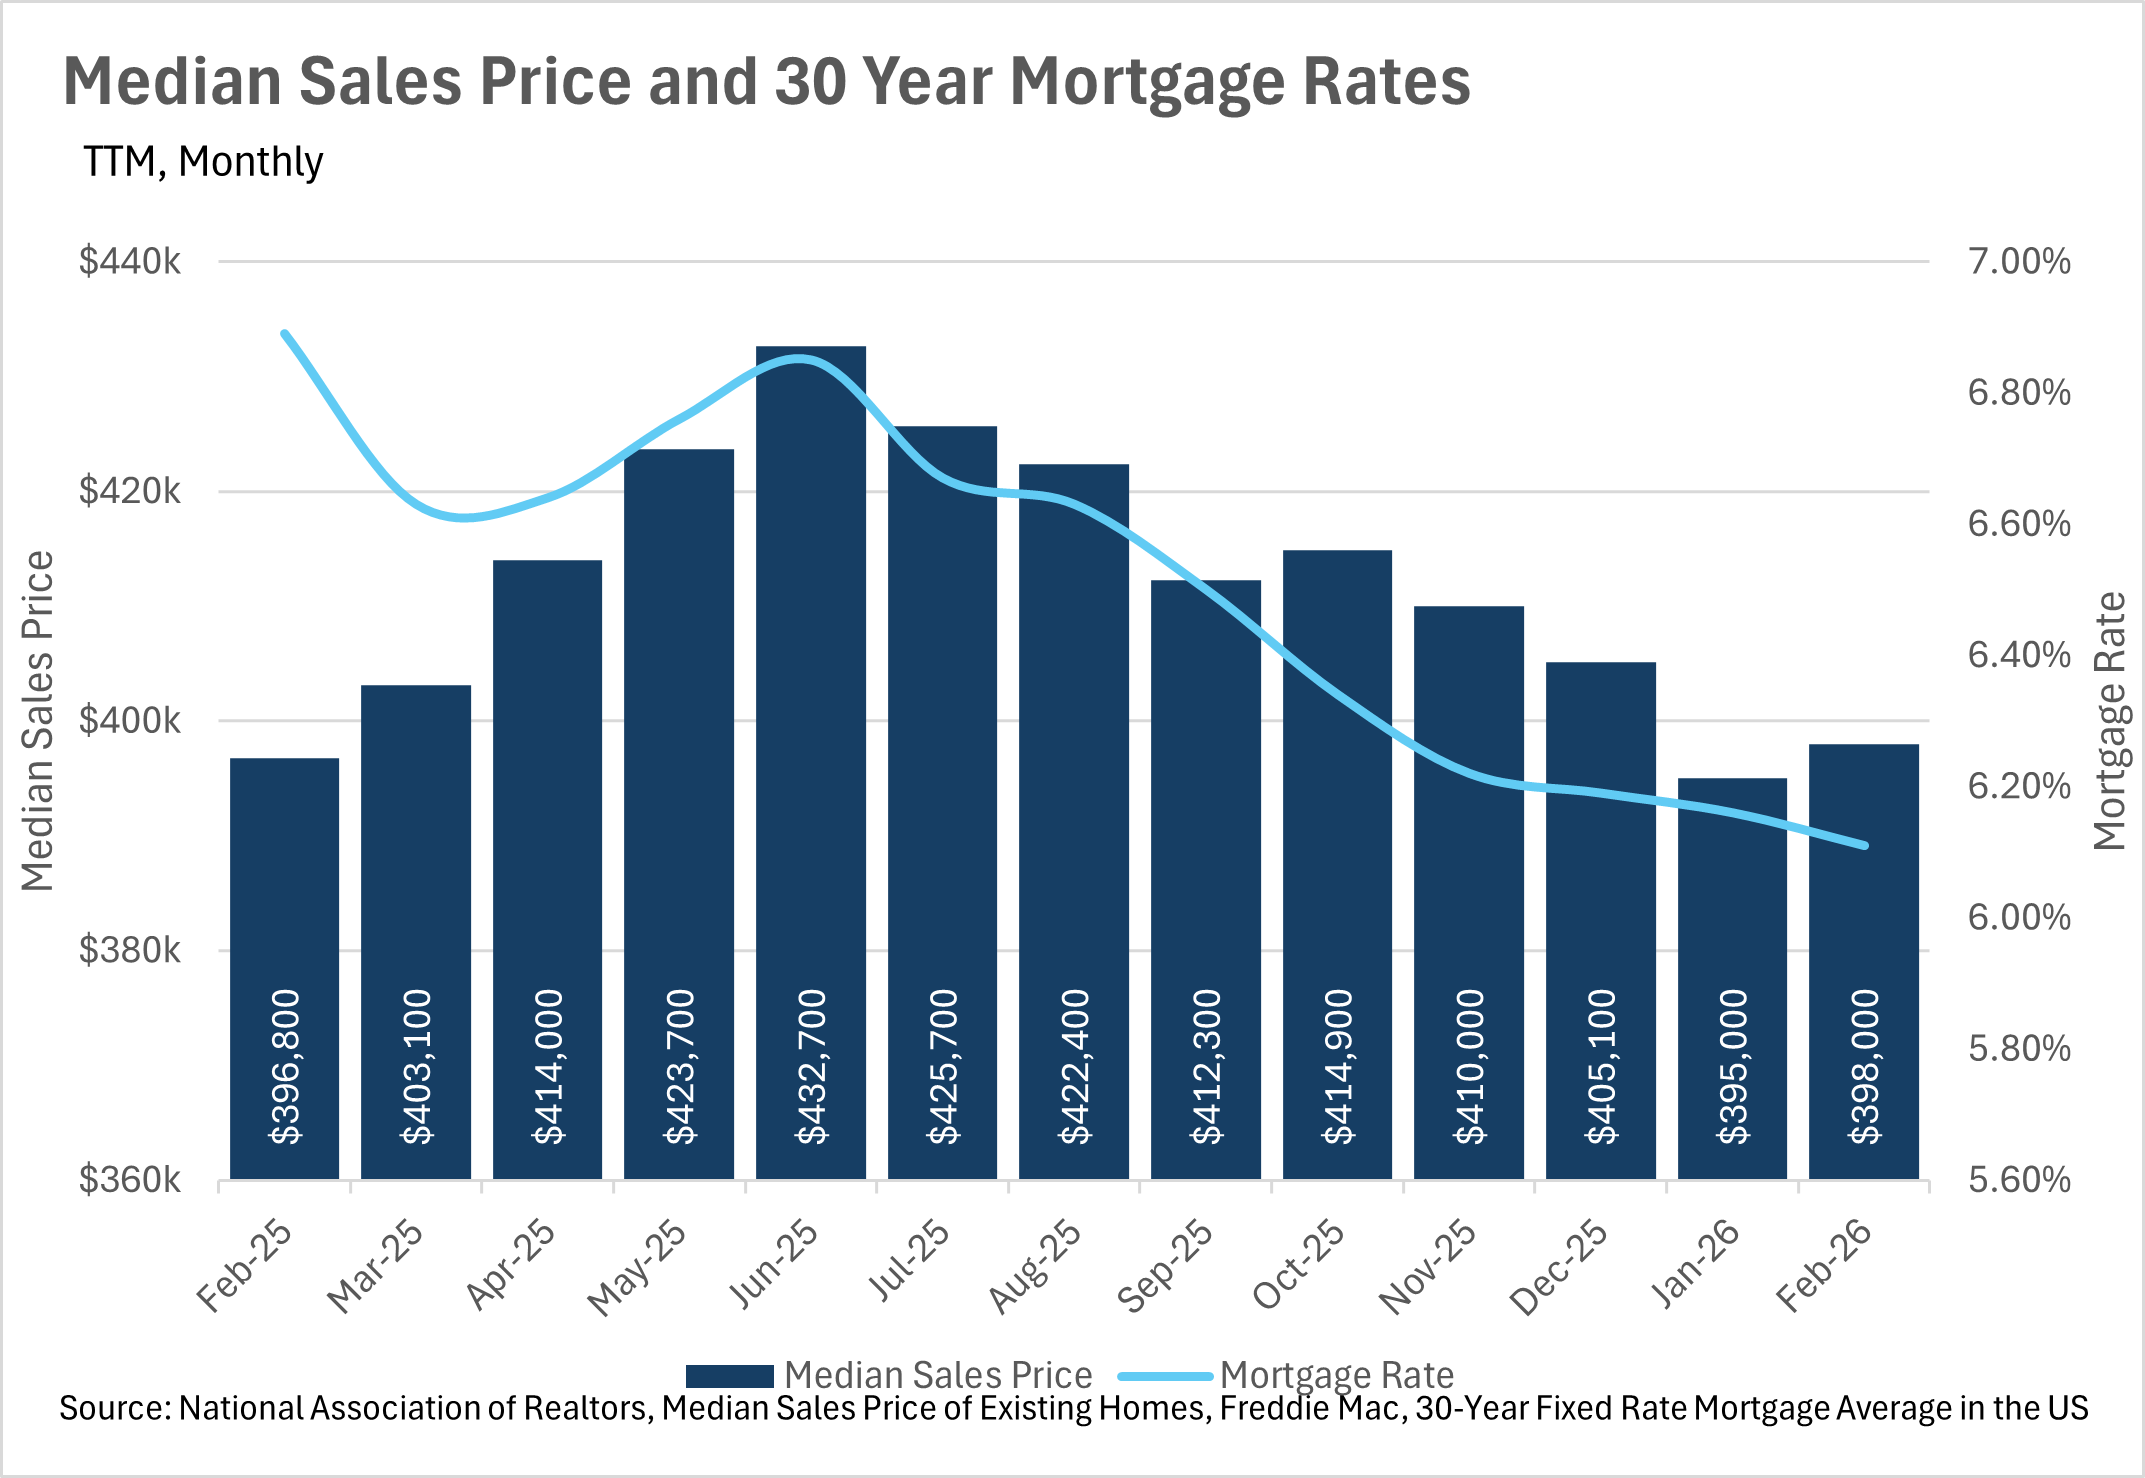
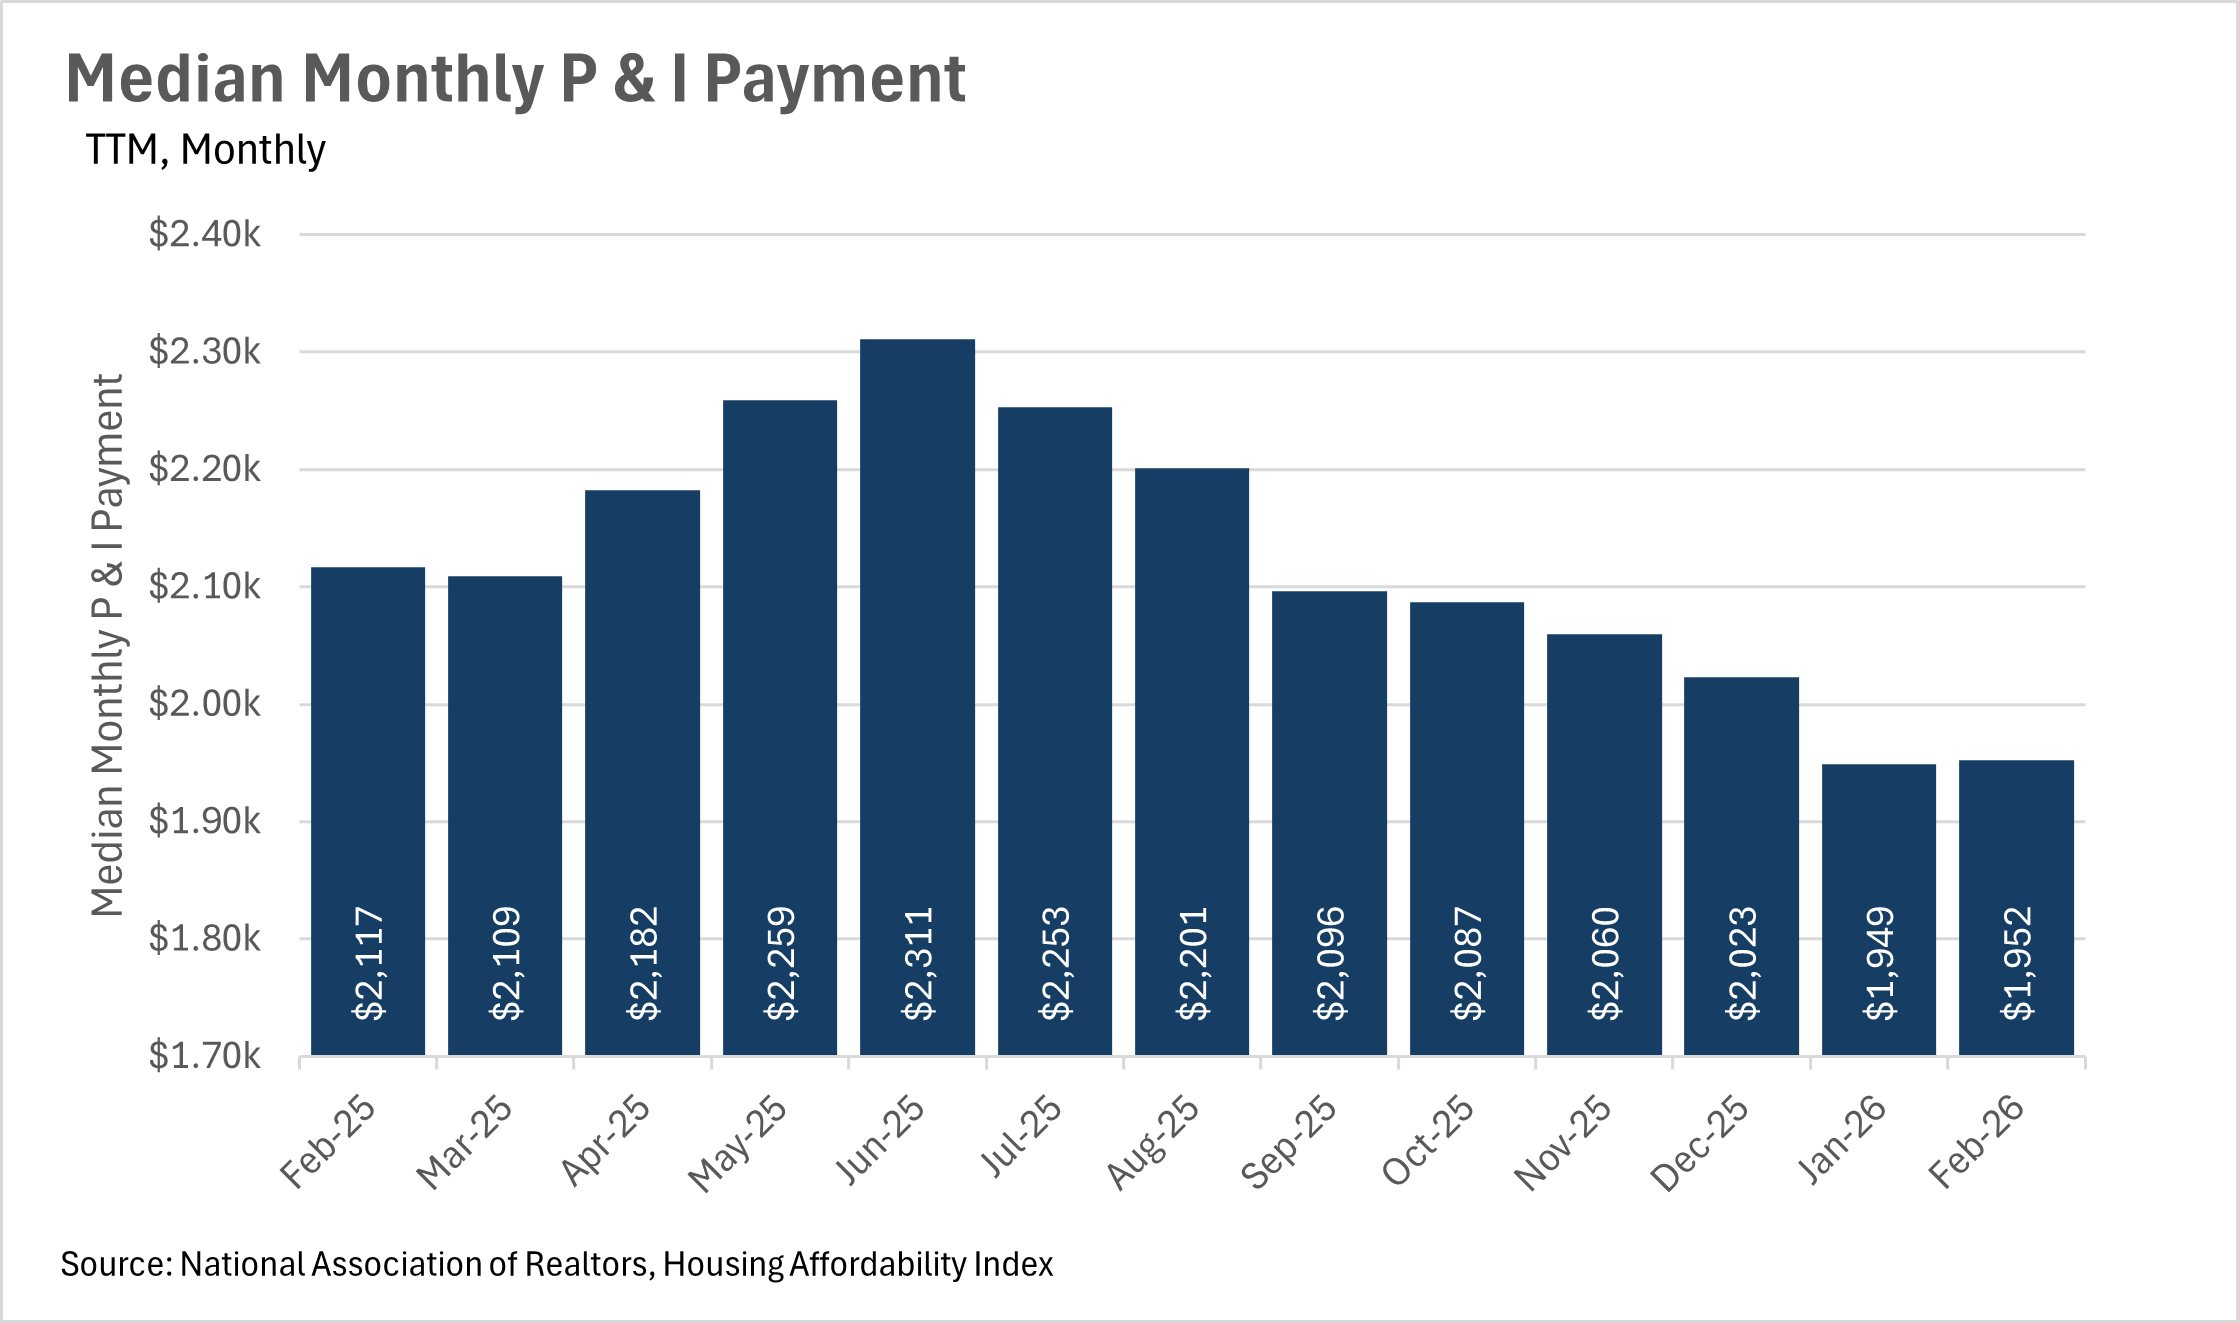
Although median home sale prices have remained remarkably stable over the past several months, the continued decline in mortgage rates is making homeownership considerably more affordable than it was just a year ago. In February, the median home sold for $398,000, representing a modest 0.30% year-over-year increase and a 0.76% uptick from January. On the mortgage rate front, the average 30-year rate dropped to 6.11% in February, representing an 11.32% year-over-year decline from the 6.89% we were seeing at this time last year. This decline in rates has had a major impact on what the average homeowner is paying each month. The median monthly P&I payment came in at $1,952 in February, down 7.79% from the $2,117 the median homeowner was paying just a year ago. That's approximately $165 in monthly savings, which is a significant boost to the average American's budget. If rates continue to trend downward, we could see buyers start to return to the market in a meaningful way as we move deeper into the spring and summer months.
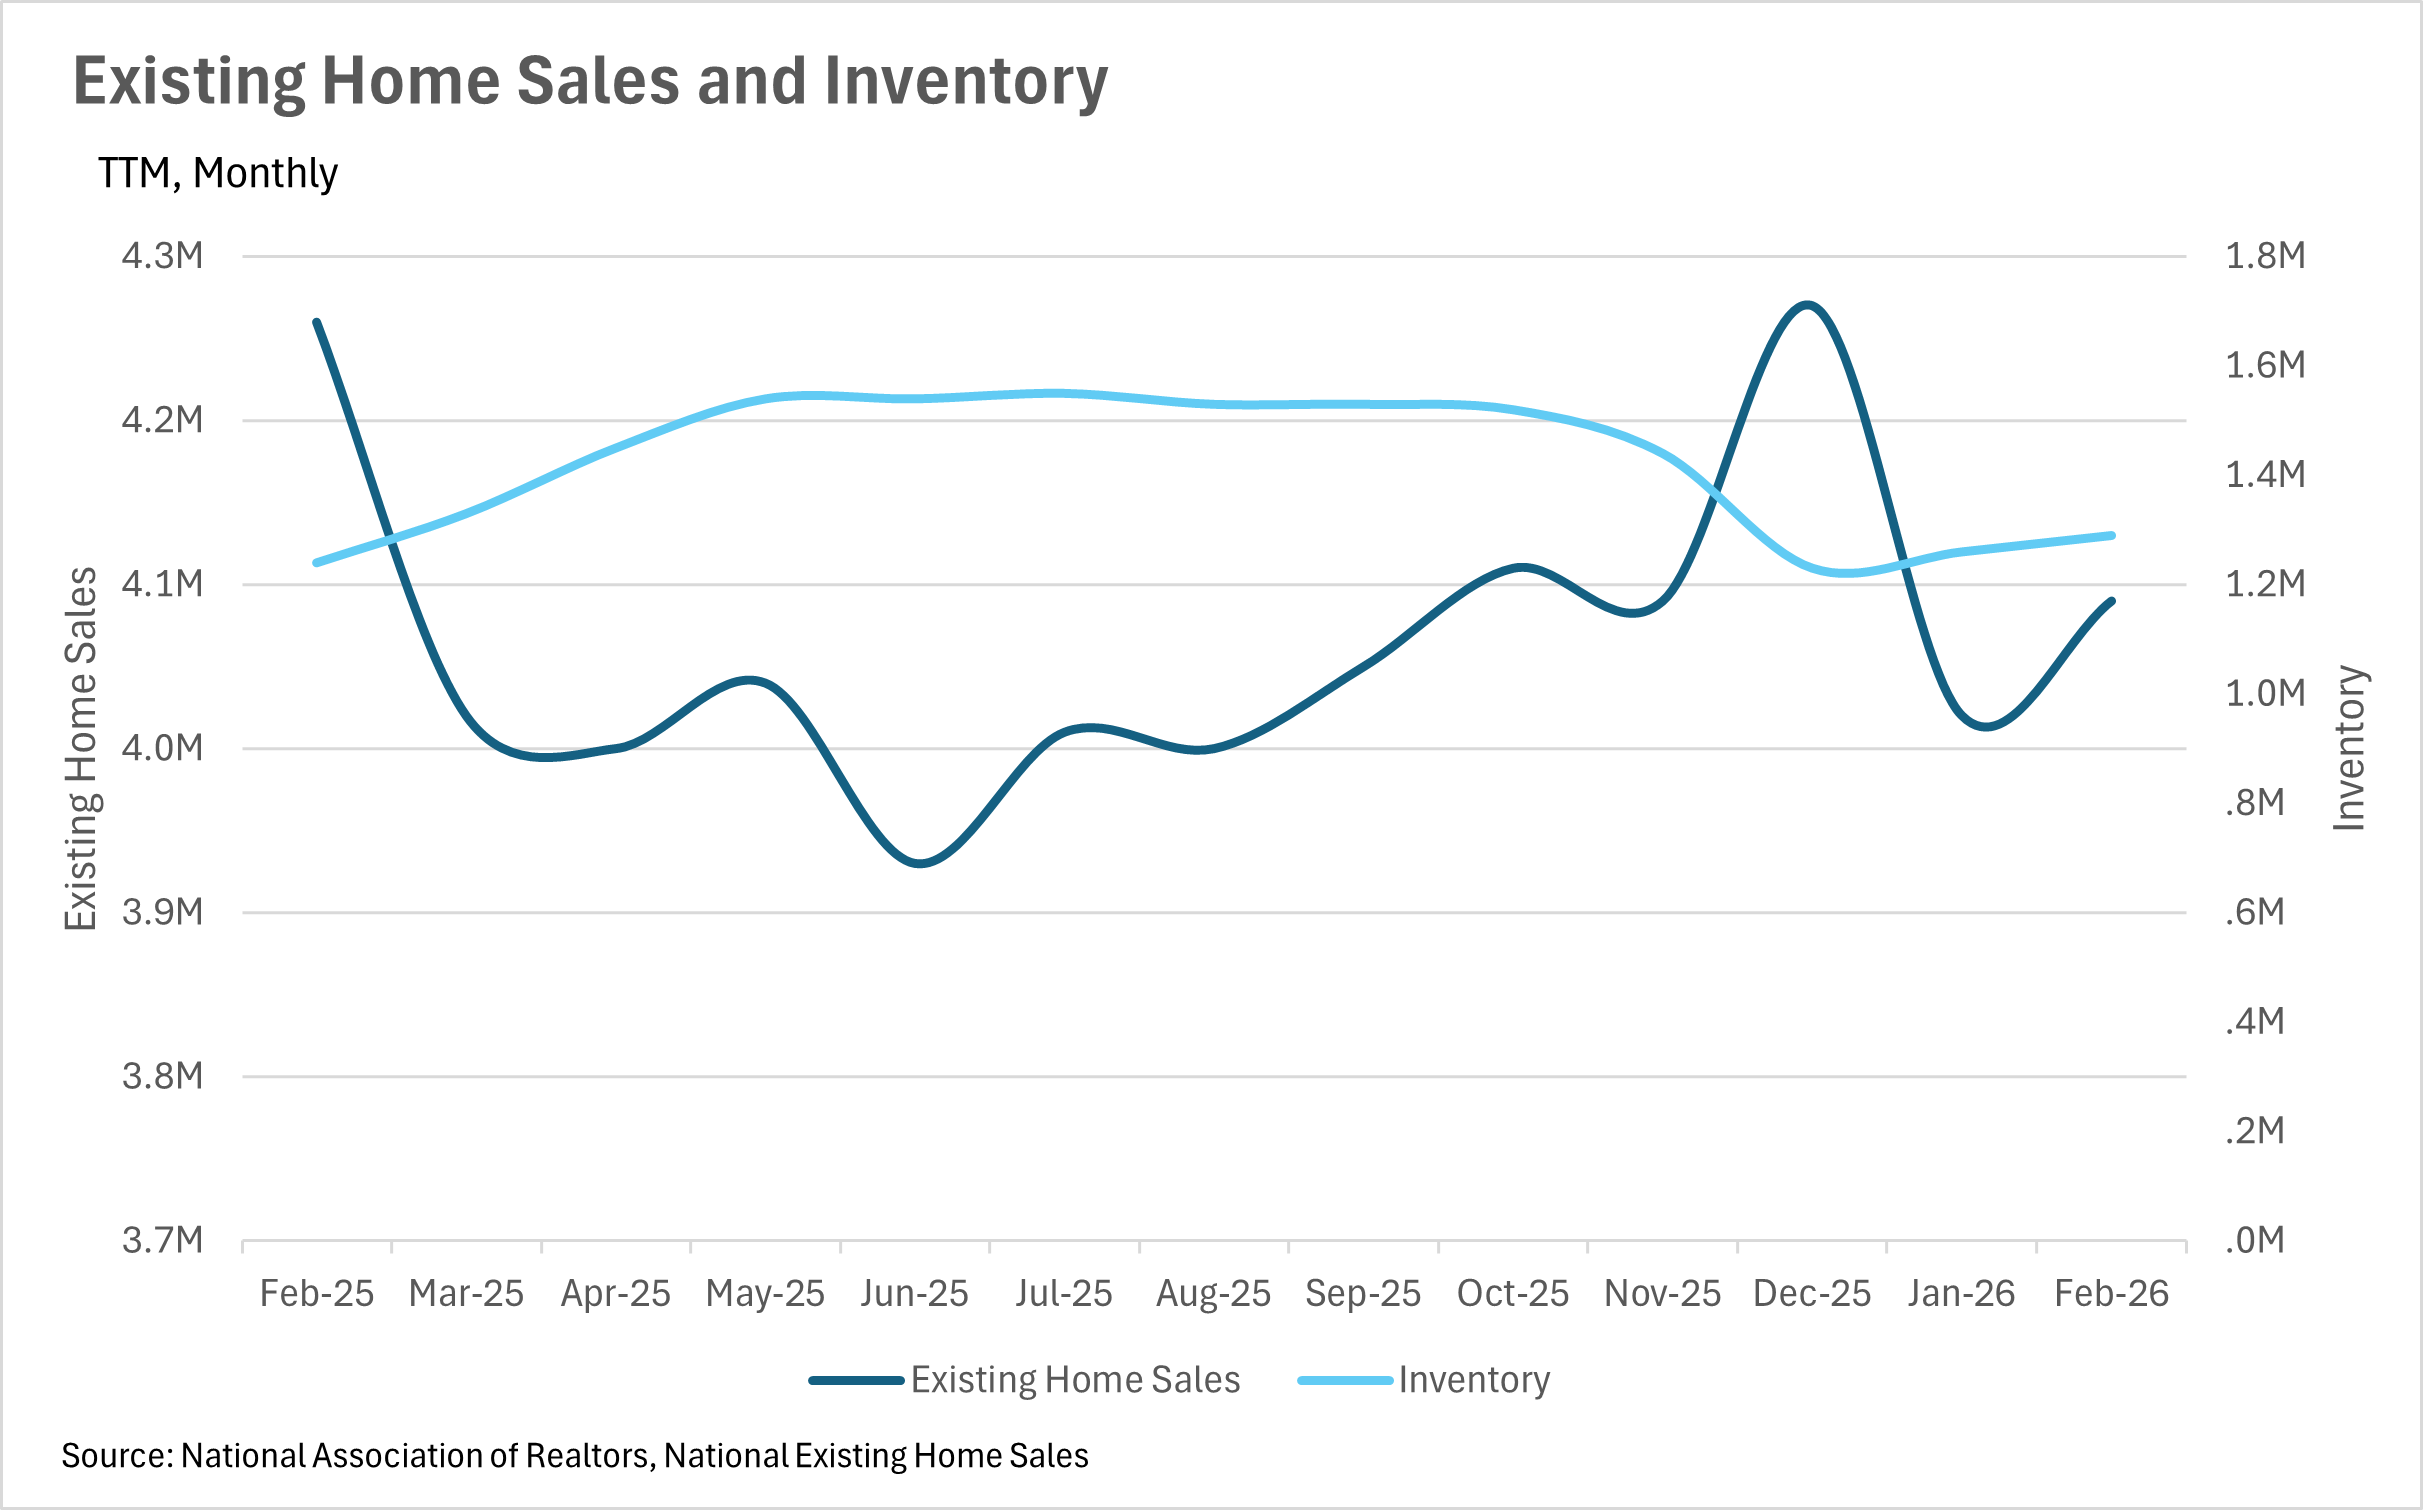
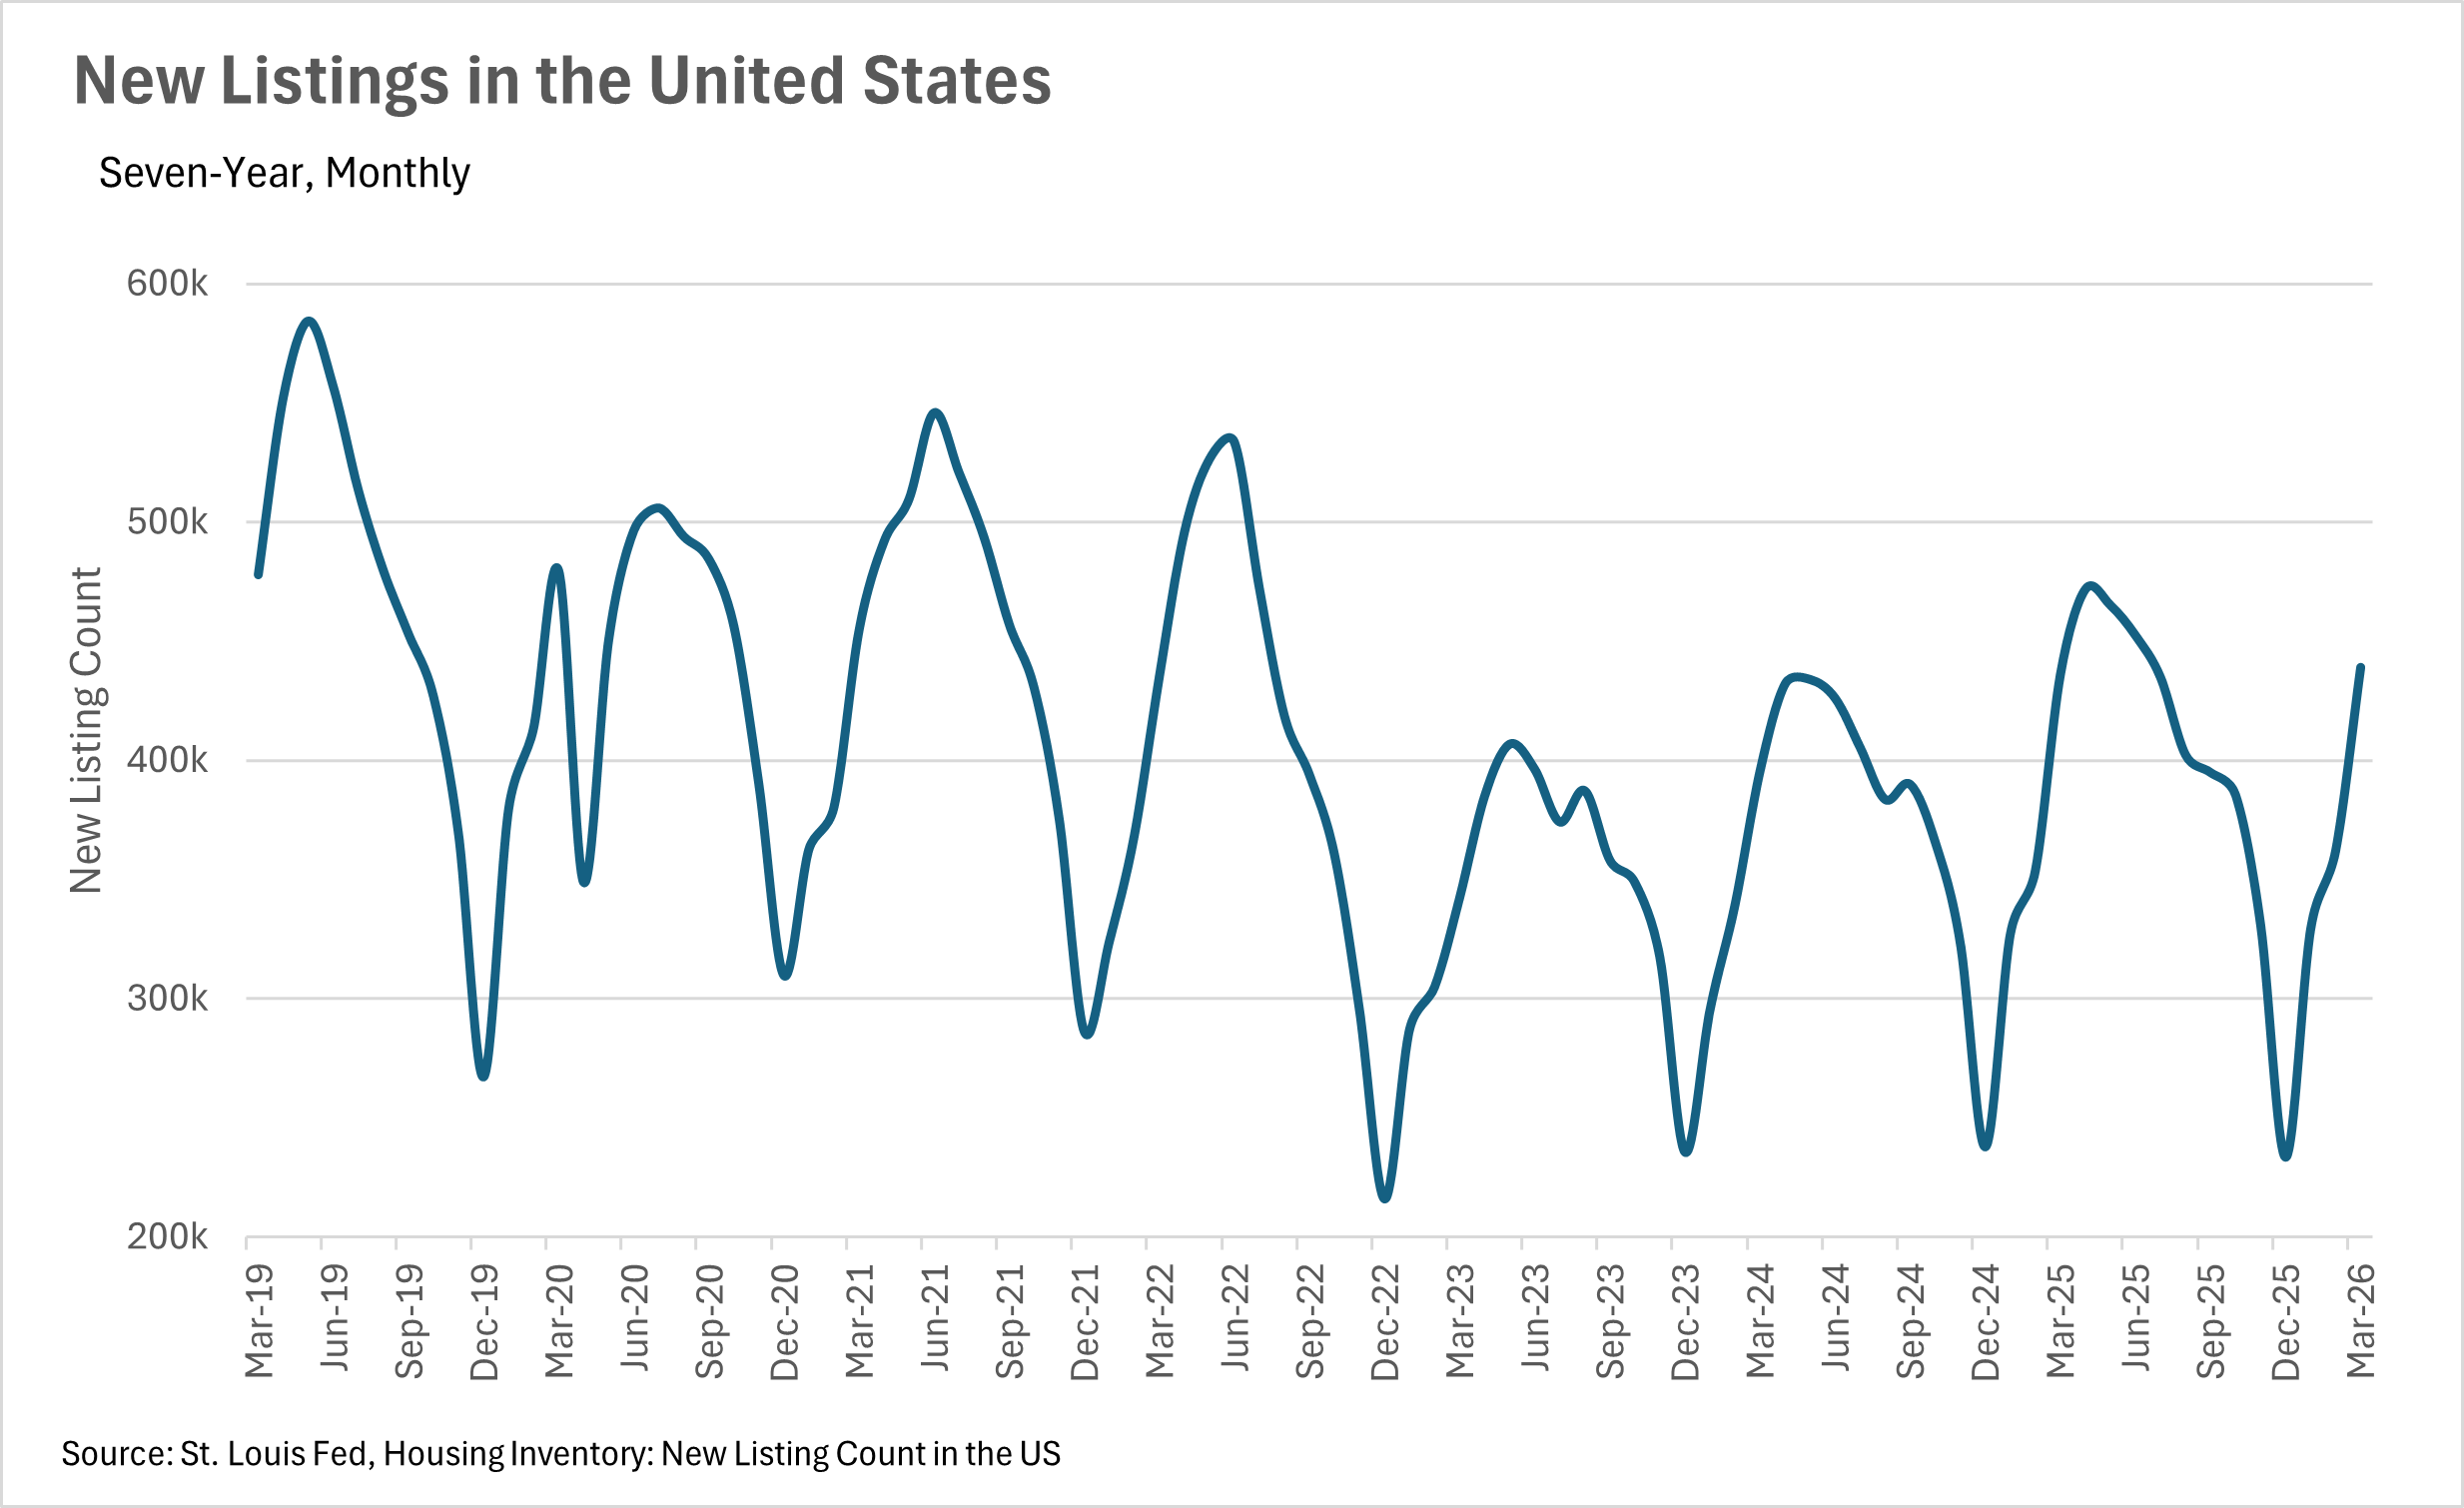
One of the most encouraging stories in the housing market right now is the dramatic increase in new listings as we move into the spring selling season. In March, there were 439,000 new listings that hit the market, representing an eye-popping 21.21% month-over-month increase and a 0.70% year-over-year increase. This surge in new listings is a very welcome sight, as it means buyers will have considerably more options to choose from as the market heats up. On the inventory side, there were 1,290,000 homes available for sale in February, representing a 4.03% year-over-year increase and a 2.38% month-over-month increase. This gradual build in inventory, combined with the huge surge in new listings, should give buyers some breathing room as we head into the busier months of the year. That said, inventory levels still have a long way to go before they reach the levels we'd consider truly healthy, so it'll be worth keeping a close eye on whether this momentum carries through the spring.
After a sluggish January, existing home sales rebounded slightly in February, with 4,090,000 homes changing hands. This represents a 1.74% month-over-month increase, but still comes in 3.99% below where we were this time last year. While it's certainly encouraging to see sales pick back up, the year-over-year decline tells us that buyers are still being cautious despite the substantial drop in mortgage rates that we've seen over the past year. Part of the story here may be that buyers are waiting to see even more rate cuts before they jump in, or they may be waiting for the influx of new listings to give them more options to choose from. Either way, it'll be fascinating to see whether the combination of lower rates, climbing inventory, and a fresh wave of new listings is enough to bring buyers off the sidelines in the coming months.
When determining whether a market is a buyers' market or a sellers' market, we look to the Months of Supply Inventory (MSI) metric. The state of California has historically averaged around three months of MSI, so any area with at or around three months of MSI is considered a balanced market. Any market that has lower than three months of MSI is considered a seller's market, whereas markets with more than three months of MSI are considered buyers' markets.
At the national level, we're seeing an interesting dynamic play out. Inventory is growing at a modest pace on a year-over-year basis, existing home sales are lagging slightly behind last year's figures, and new listings are surging into the market just as we head into the traditionally busy spring season. All of this suggests that the market is slowly tilting back toward a more balanced state, which would be welcome news for buyers who have been dealing with tight inventory for years. However, if mortgage rates continue to drop and buyers finally decide to come off the sidelines, we could just as easily see the market swing back in favor of sellers. As always, real estate is a highly localized asset, which is why you should check out what's going on in your local market below in the Local Lowdown!
Note: You can find the charts/graphs for the Local Lowdown at the end of this section.
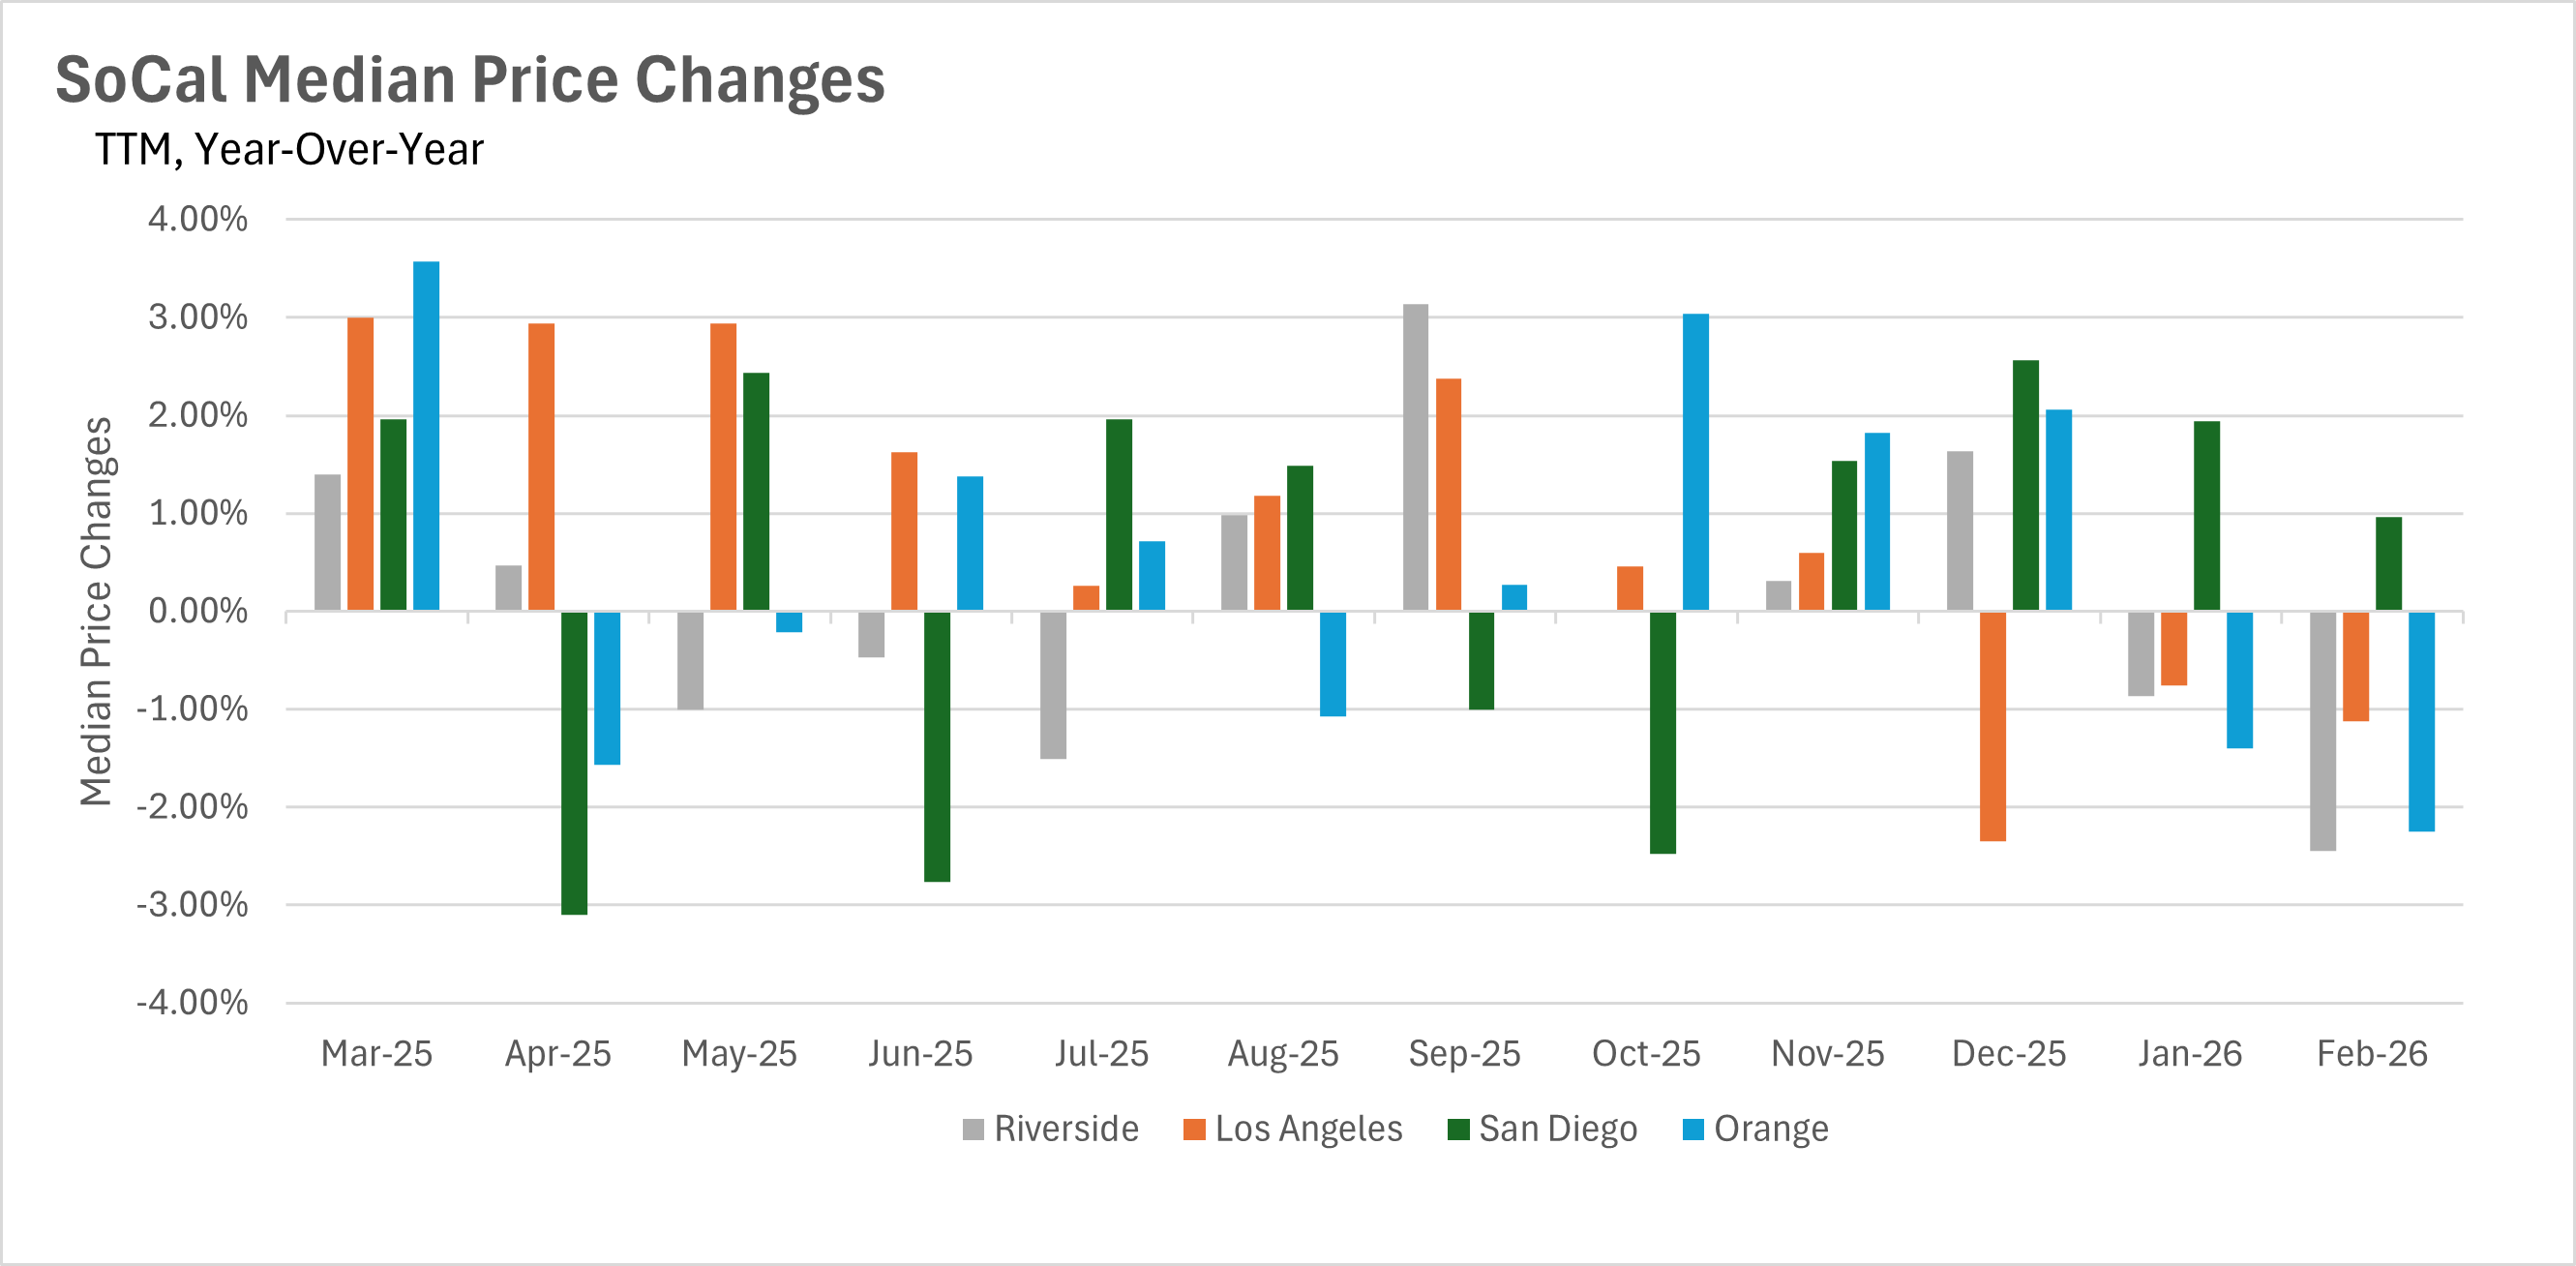
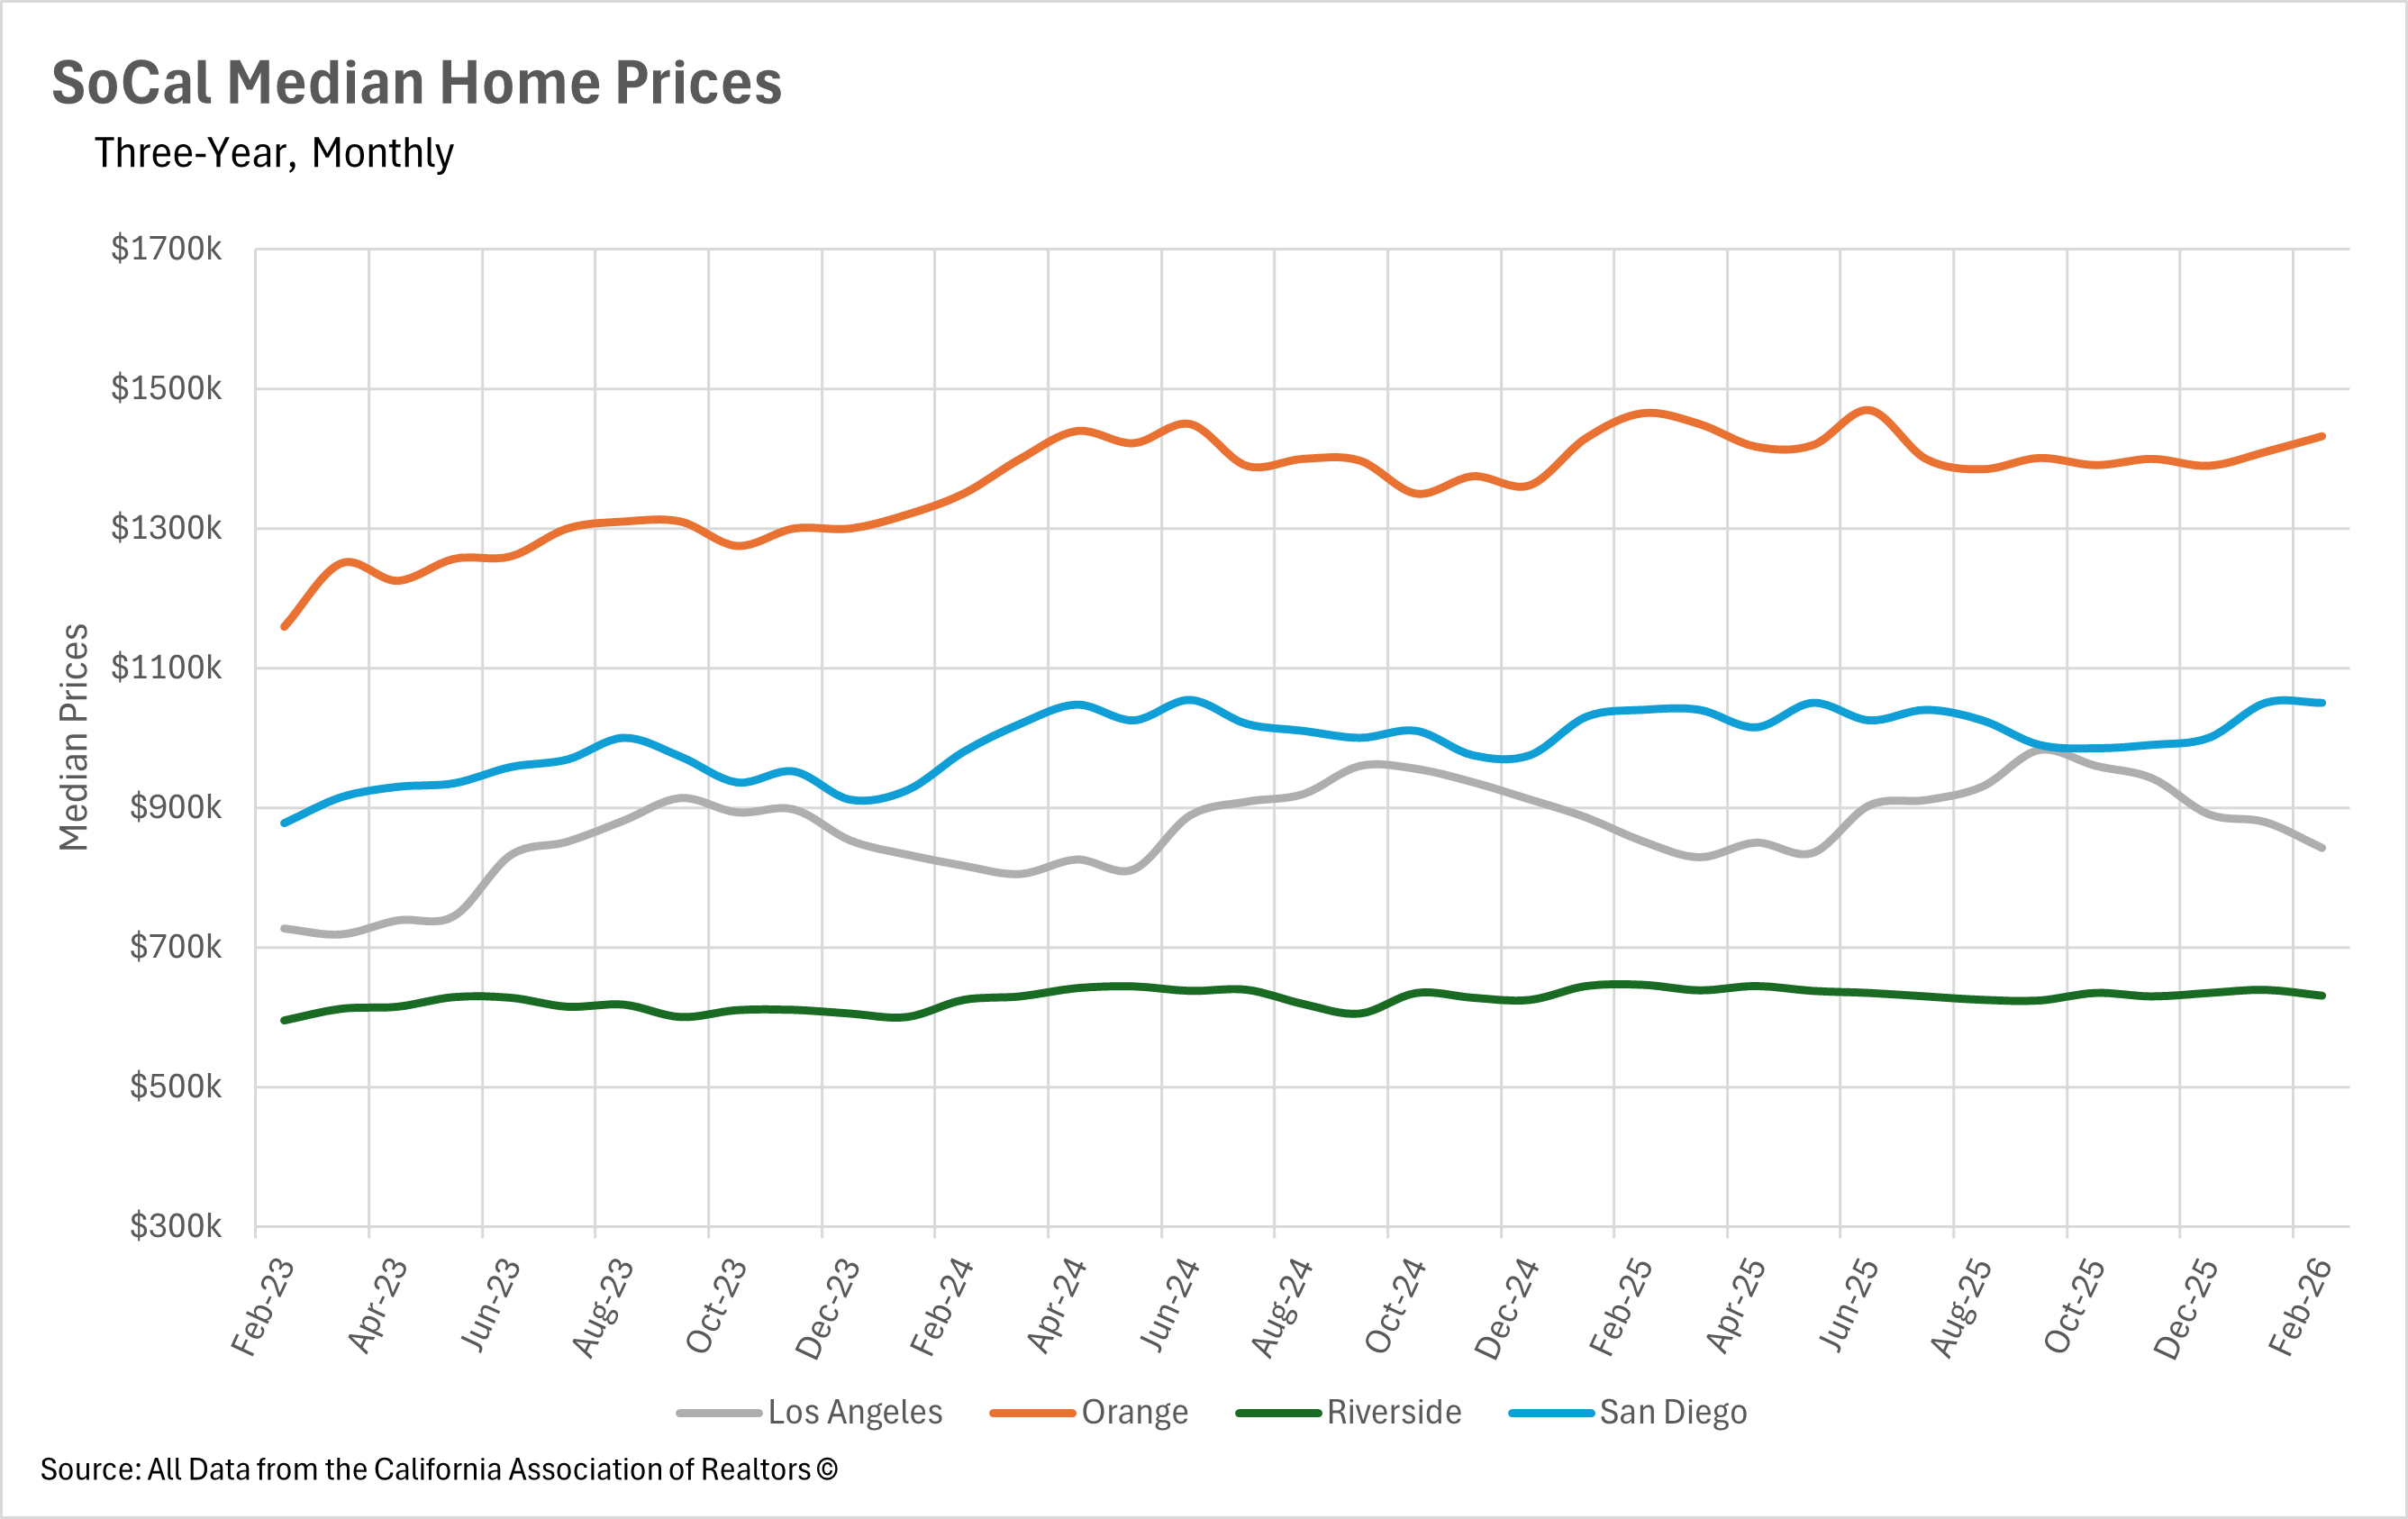
Southern California's housing markets are showing a clear divergence in pricing trends as we move deeper into 2026. San Diego continues to be the standout performer, with the median single-family home selling for $1,050,000 in February, representing a 0.96% year-over-year increase. This marks the fourth consecutive month of year-over-year gains for San Diego, and the fact that prices are holding firm above the million-dollar threshold is a strong signal that demand remains healthy in the area. However, the other three markets are telling a different story. Los Angeles has now posted three consecutive months of year-over-year price declines, with the median sale price coming in at $842,660, down 1.12% from last year. Orange County saw an even steeper decline at 2.25%, bringing its median to $1,432,500, though it's worth noting that early 2025 was exceptionally strong for Orange County, creating tough comps. Riverside rounded out the picture with a 2.45% year-over-year decline, bringing its median sale price to $631,000.
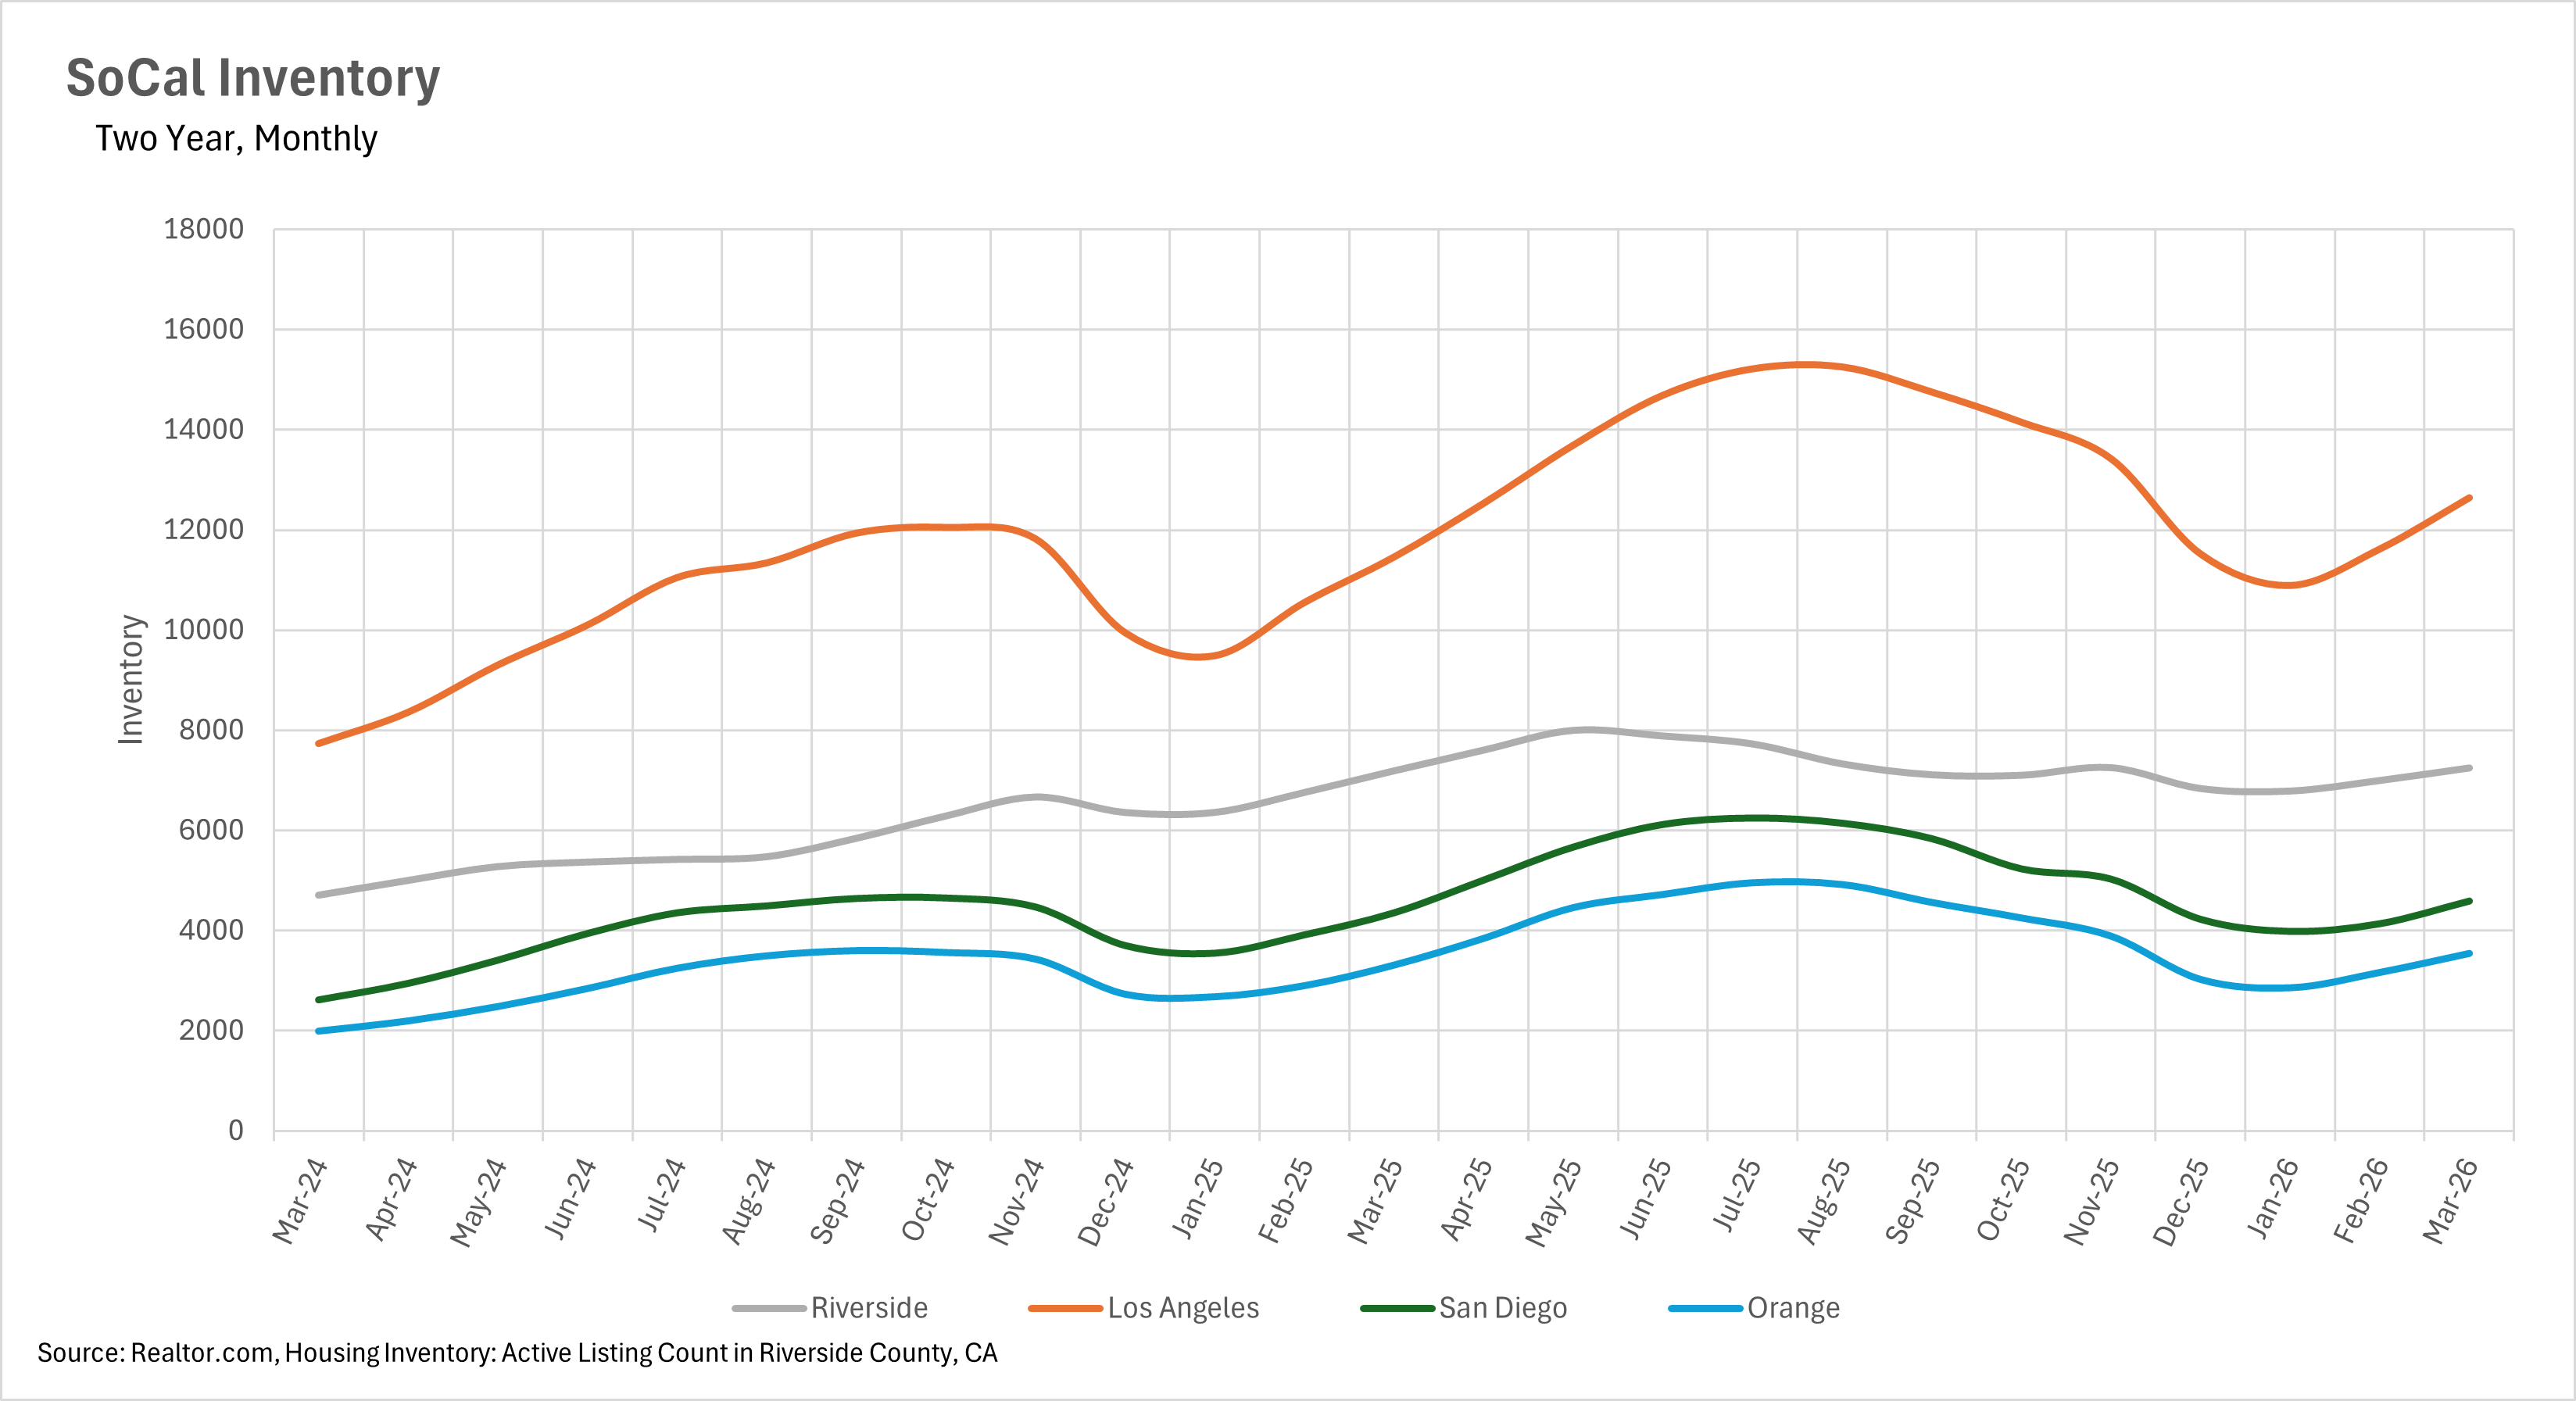
As we move deeper into the spring selling season, inventory levels are climbing at a steady pace throughout Southern California. Los Angeles leads the way with 12,647 active single-family home listings on the market as of March, representing a 10.33% increase on a year-over-year basis and an 8.80% increase month-over-month. Orange County follows with a 7.00% year-over-year increase, bringing active listings to 3,544. Riverside has seen inventory climb by 6.70% year-over-year to 7,241 homes, while San Diego has the smallest gap at just 5.40%, with 4,586 active listings. Across the board, the month-over-month increases we're seeing are consistent with the typical seasonal pattern, as sellers often wait until spring to list their homes in hopes of capturing increased buyer activity. The year-over-year gaps have actually narrowed somewhat from earlier in the cycle, which suggests that the inventory picture across the region is continuing to stabilize after the dramatic buildup we saw throughout the summer of 2025.
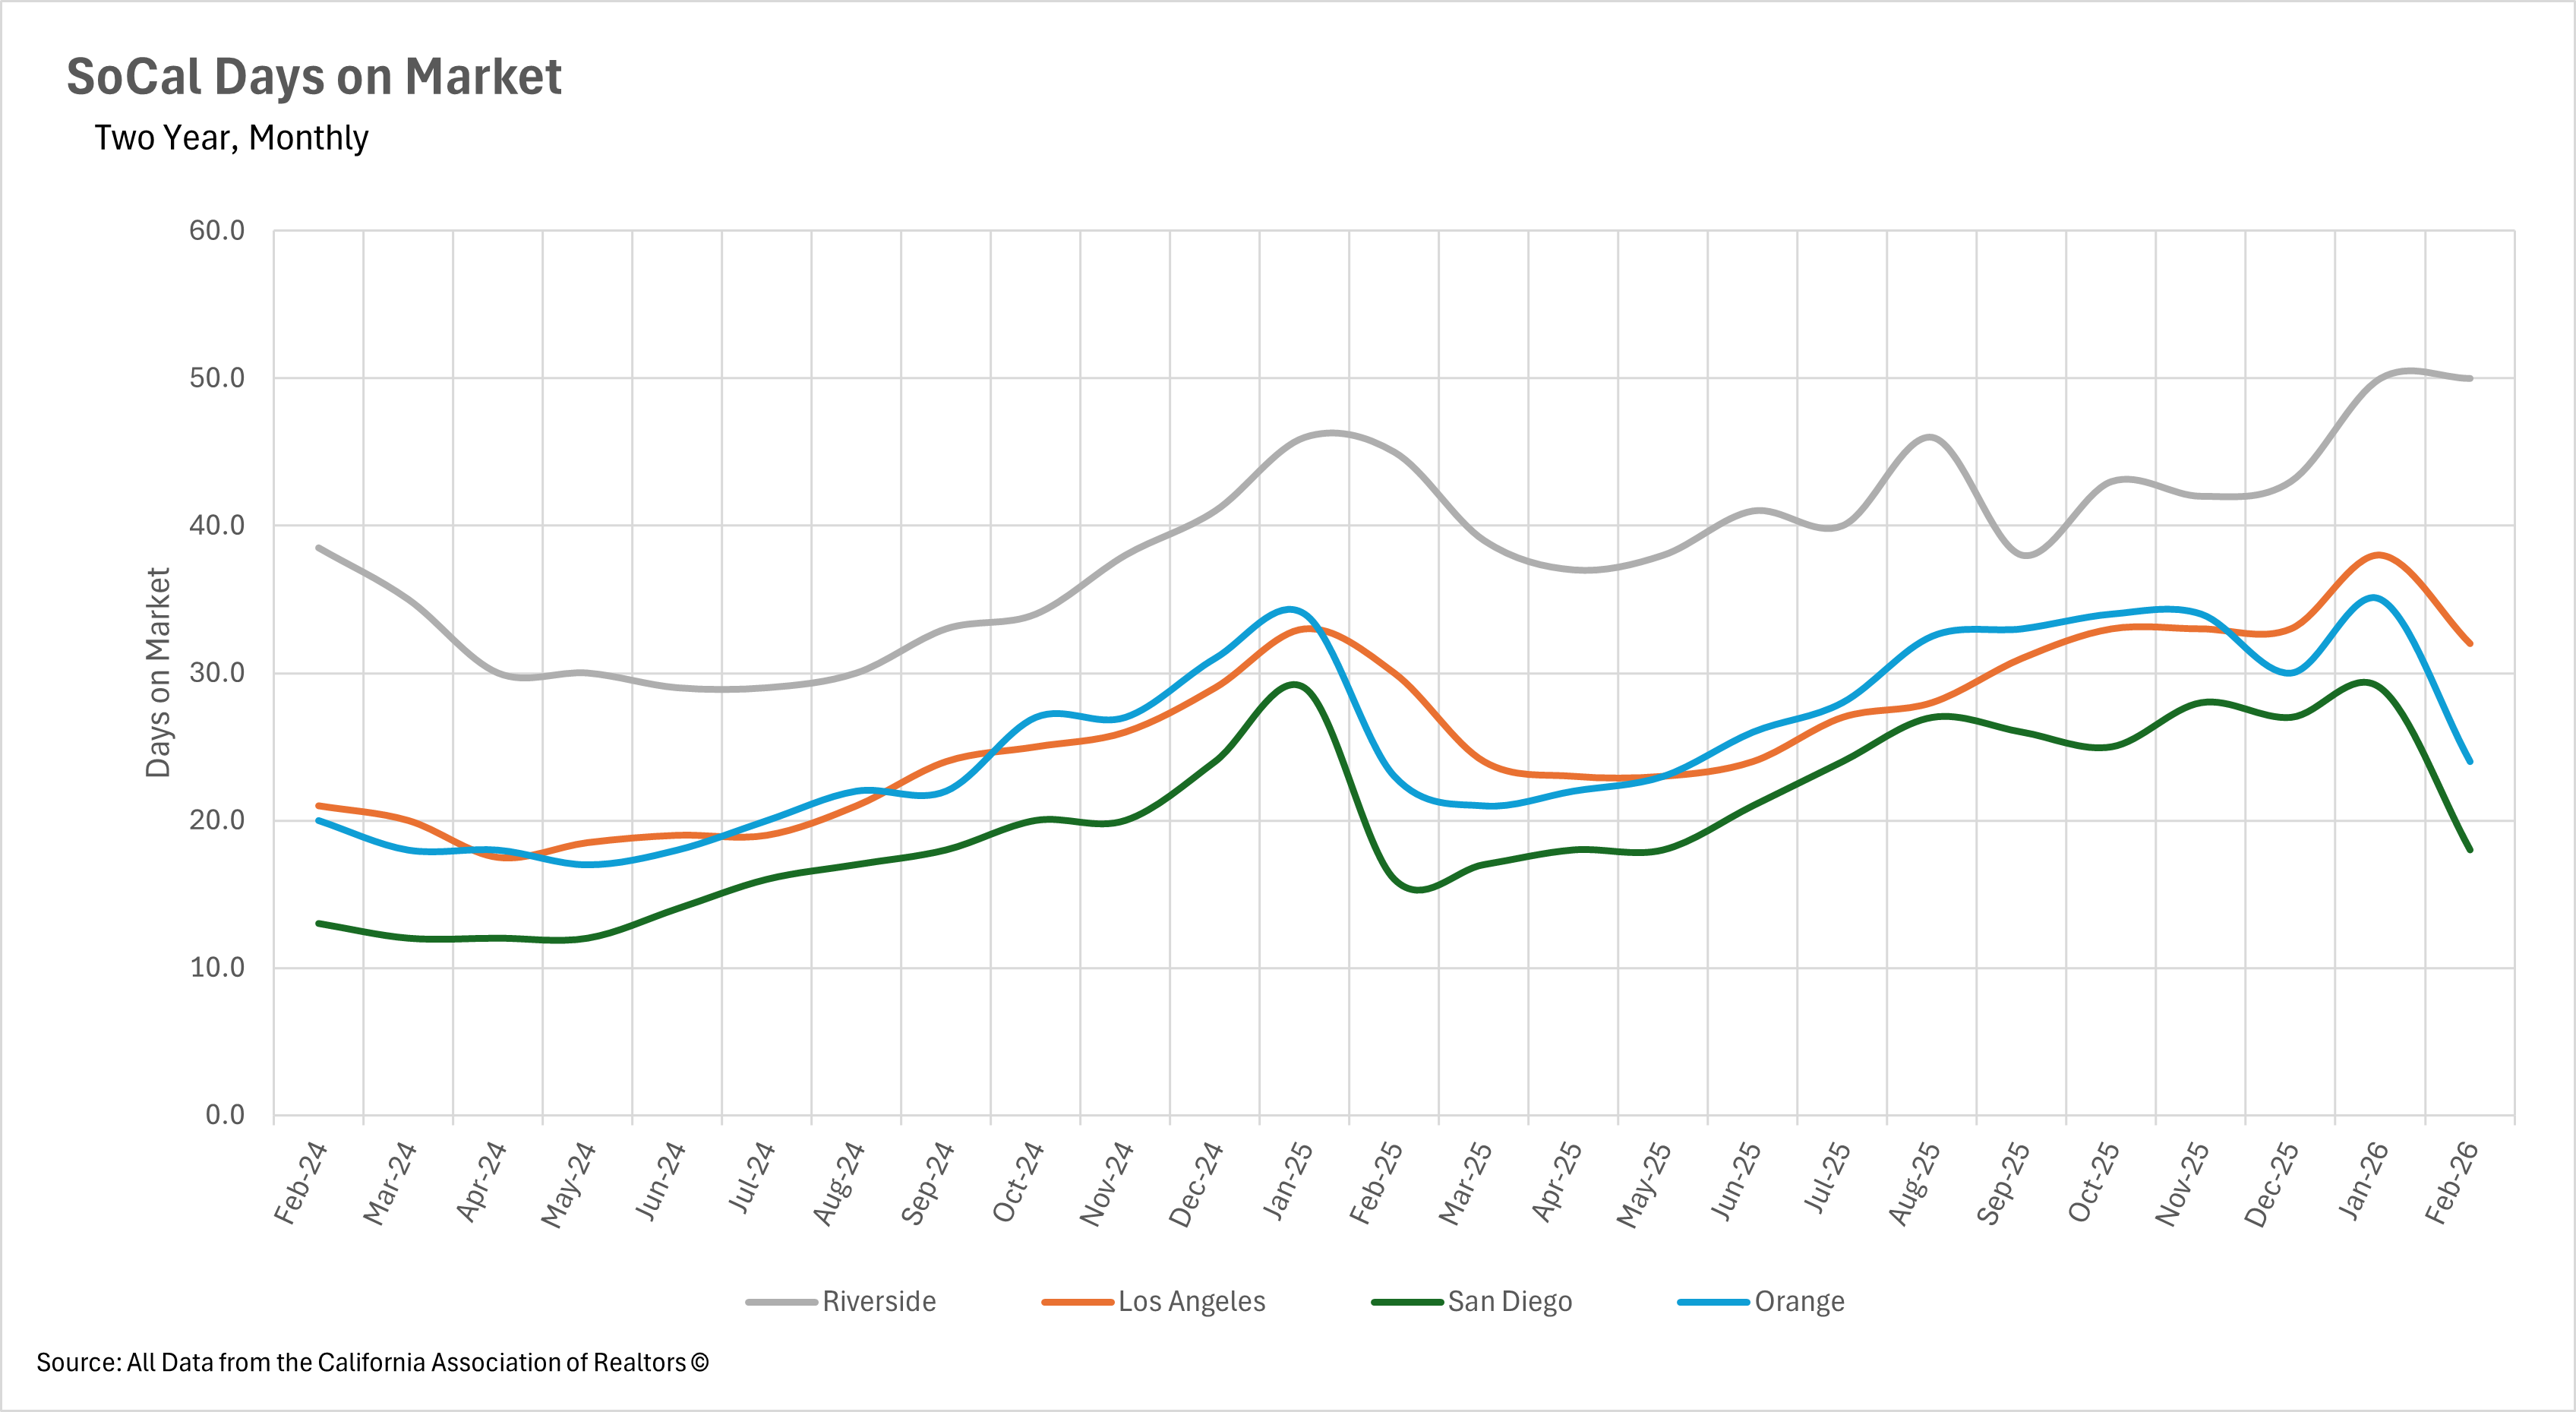
In a welcome development for sellers, listings are moving considerably faster across Southern California than they were at the start of the year. San Diego saw the most dramatic improvement, with the median listing spending just 18 days on the market in February, a massive 37.93% decrease from January's 29 days. Orange County wasn't far behind, with the median listing sitting for just 24 days, representing a 31.43% month-over-month decline. Los Angeles also saw improvement, with days on market dropping 15.79% from January to land at 32 days. Riverside was the only market that didn't see a month-over-month improvement, with listings sitting for 50 days, unchanged from January. On a year-over-year basis, all four markets are still seeing listings spend more time on the market than they did last year, with increases ranging from 4.35% in Orange County to 12.50% in San Diego. However, the overall trend is encouraging and suggests that spring buyers are beginning to step off the sidelines.
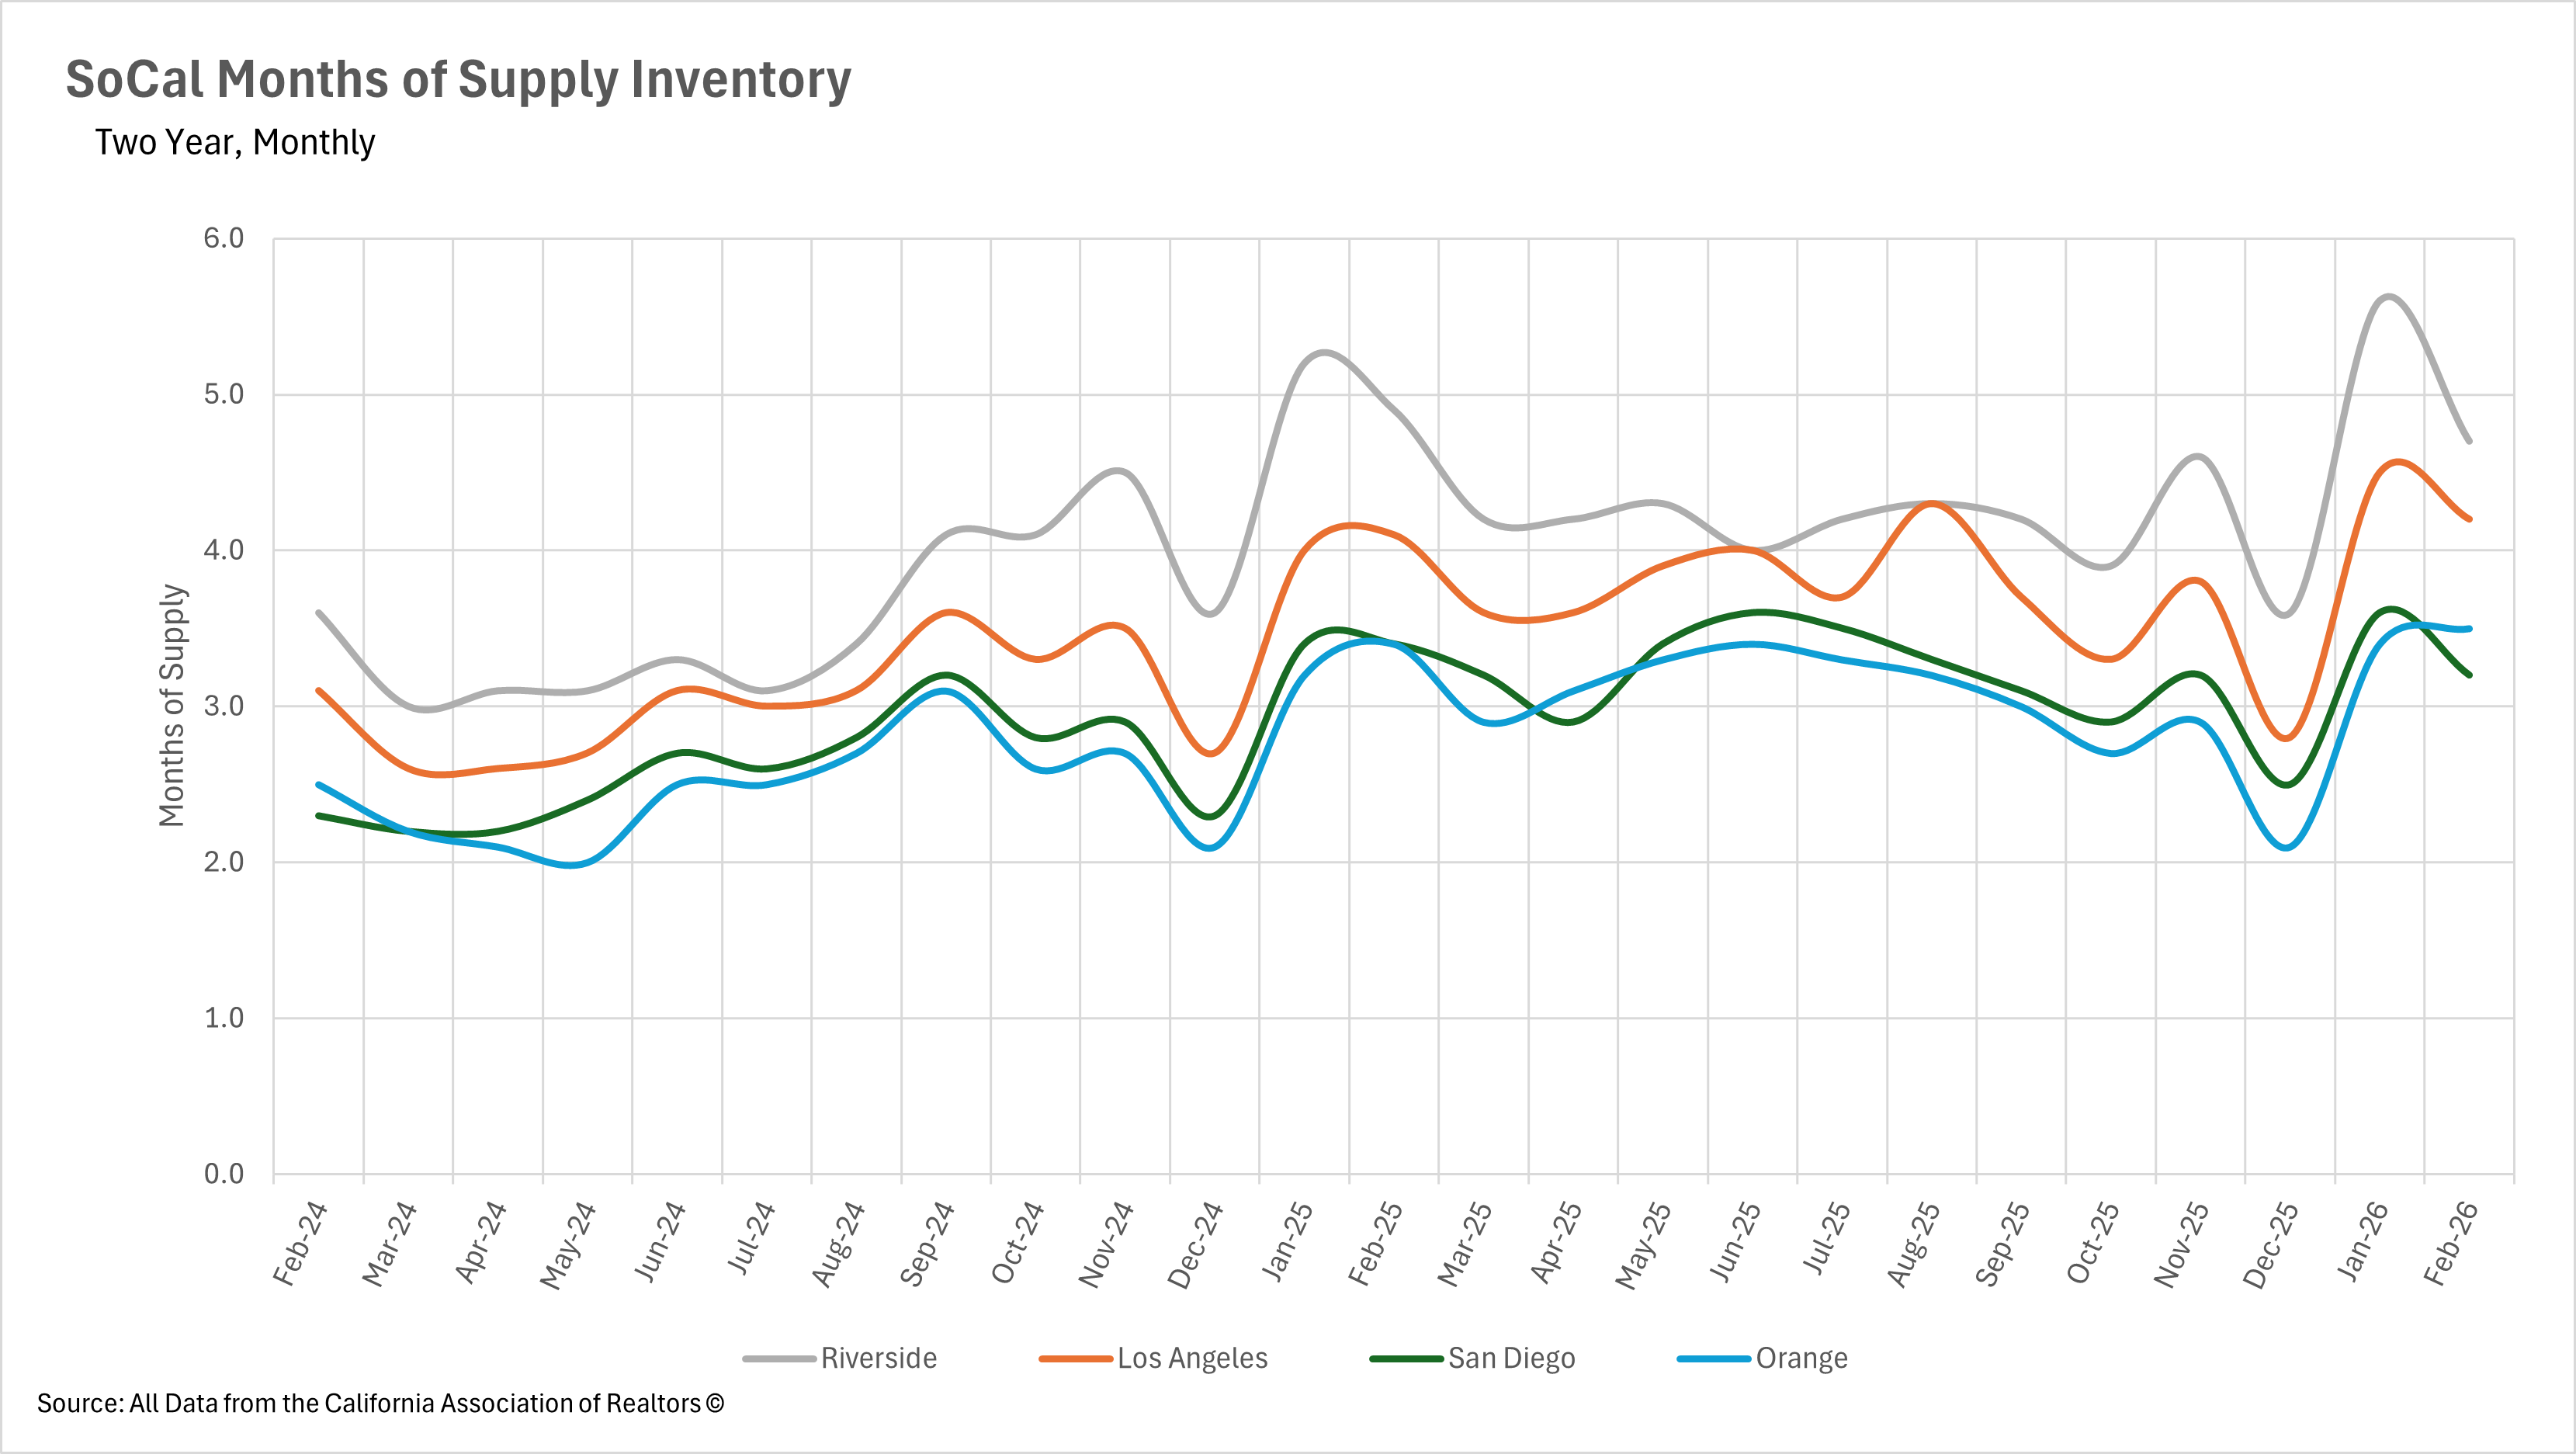
When determining whether a market is a buyers' market or a sellers' market, we look to the Months of Supply Inventory (MSI) metric. The state of California has historically averaged around three months of MSI, so any area with at or around three months of MSI is considered a balanced market. Any market that has lower than three months of MSI is considered a seller's market, whereas markets with more than three months of MSI are considered buyers' markets.
Market conditions are shifting across Southern California as spring buying activity begins to pick up. San Diego has moved back toward balanced ground, ending February with 3.2 months of supply, an 11.11% month-over-month decrease that puts it right around California's historical average. Orange County is also hovering near balanced territory at 3.5 months of supply. However, Los Angeles and Riverside remain firmly in buyers' market territory, with 4.2 and 4.7 months of supply, respectively. It's worth noting that all four markets saw month-over-month declines in MSI, which suggests that buyer activity is picking up at a faster pace than new inventory is entering the market. As we move into the peak spring and summer months, it will be worth watching whether this trend continues and whether the markets that are still in buyers' territory are able to shift back toward more balanced conditions.
Stay up to date on the latest real estate trends.

July 2026

A Closer Look at Dallas Rental Prices, Hidden Costs, and What Renters Need to Know Before Moving

June 2026
May 2026

April 2026
March 2026

February 2026
January 2026

Trusted Experts in the Palisades, Santa Monica, and Brentwood Real Estate Markets
You’ve got questions and we can’t wait to answer them.