Market Update Dallas

Note: You can find the charts & graphs for the Big Story at the end of the following section.
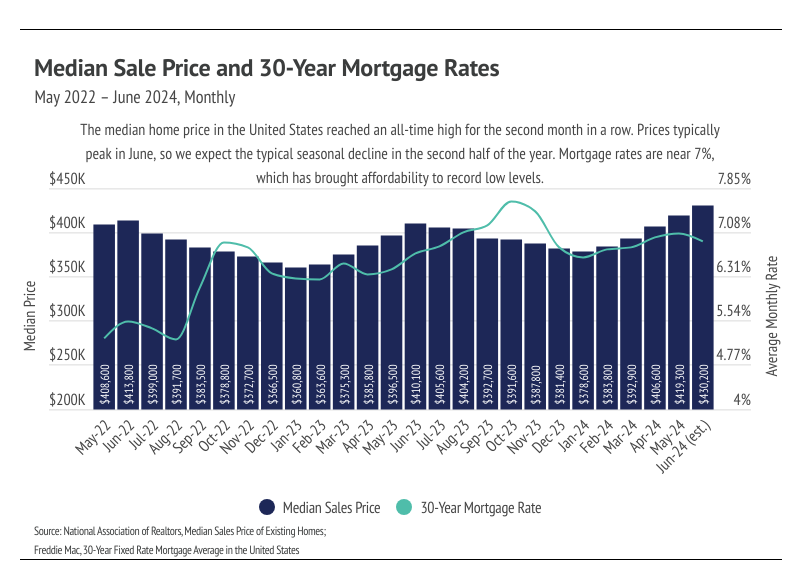
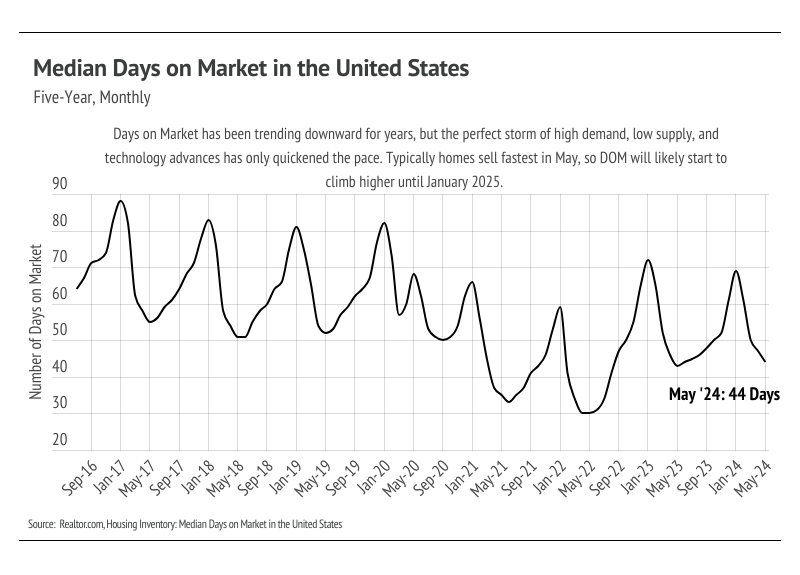
In June, prices rose for the fifth month in a row, peaking at an all-time high in June 2024. This also marks the 12th consecutive month of year-over-year price growth. According to typical seasonality, the median price peaks in June, so we expect prices to decline starting in July. Over time, prices generally move much higher in the first half of the year than they decline in the second half; you can think of it as two steps forward and one step back, year after year. Last year, for example, prices rose 13.7% from January 2023 to June 2023, then fell 7.7% from June 2024 to January 2024, which was still a year-over-year gain of 4.9%. This year will likely look similar, although we don’t think that prices will decline as much in the second half of 2024 as they did in 2023, especially if the Fed cuts rates in the fall. Even a minor rate cut, like the expected 0.25%, could significantly affect mortgage rates, as it would signal the beginning of more and more cuts.
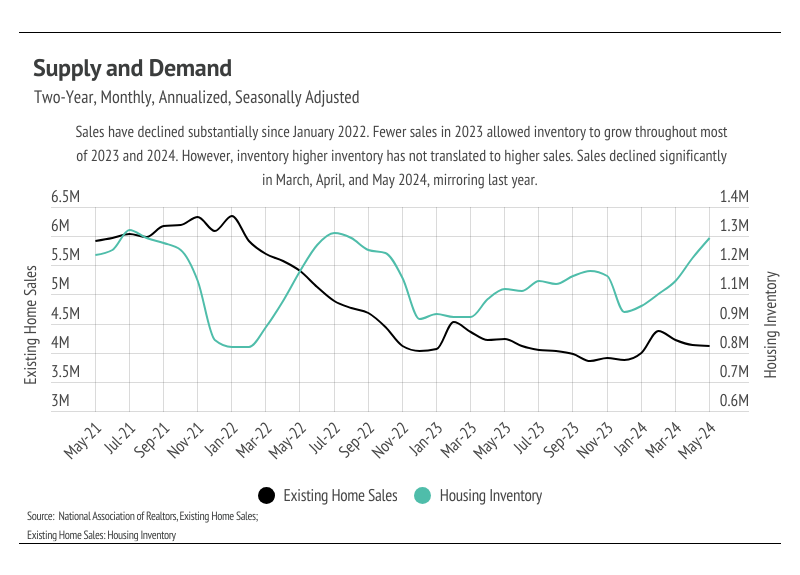
For the moment though, we are starting summer with a combination of elevated mortgage rates and record high prices, which have brought affordability to an all-time low. Low affordability has resulted in fewer sales and growing inventory. Demand is still high relative to supply, even though inventory is building. We know that demand is still high because buyers are still buying at peak prices. From a historical context, we should’ve expected this to happen. We took a look at data from the 1980s to see how much home prices appreciated during a decade-long period of the highest mortgage rates in history. From January 1, 1980, to January 1, 1990, the 30-year mortgage rate ranged from 9.03% to 18.63%, with an average rate of 12.71%. Although home prices didn’t increase dramatically like they have in the recent past, inflation-adjusted home prices still increased about 8% during that decade. Today, with the strong U.S. economy, it was never very likely for home prices to stagnate or decline due to higher mortgage rates. However, high rates have slowed sales volume considerably, which has caused inventory to grow.
Overall, inventory growth is great news for the undersupplied U.S. housing market. According to data from the National Association of REALTORS® (NAR), inventory reached its highest level since August 2022. The market is still broadly undersupplied, but the increasing inventory level should cause rising home prices to slow. In the pre-pandemic seasonal trends, sales, new listings, inventory, and price would roughly all rise in the first half of the year and decline in the second half of the year. Sales and new listings have been far lower than usual since mortgage rates started climbing, which is to be expected. Because we don’t anticipate sales to pick up until the spring of 2025, inventory could continue to grow in the second half of the year.
Different regions and individual houses vary from the broad national trends, so we’ve included a Local Lowdown below to provide you with in-depth coverage for your area. As always, we will continue to monitor the housing and economic markets to best guide you in buying or selling your home.
Note: You can find the charts/graphs for the Local Lowdown at the end of this section.
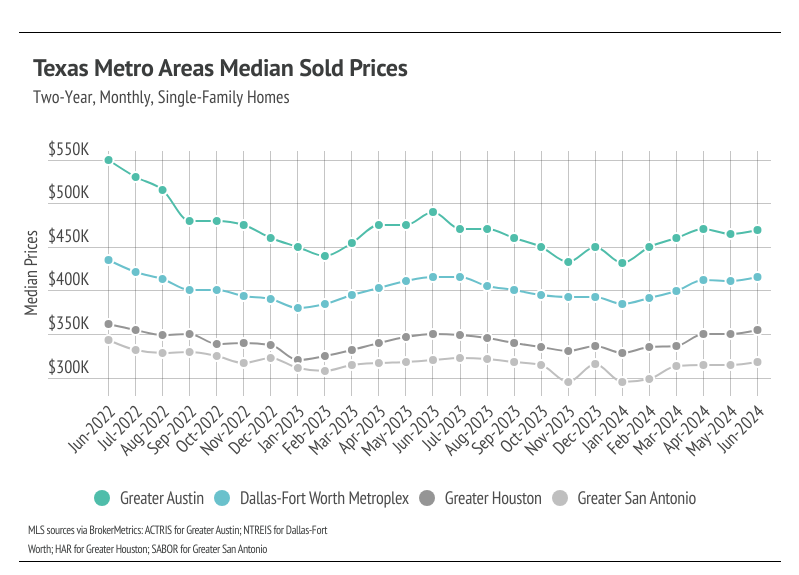
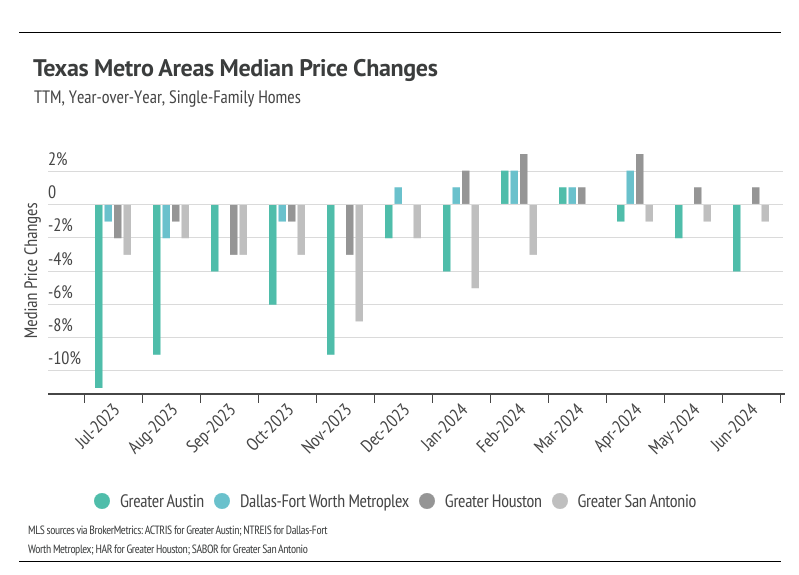
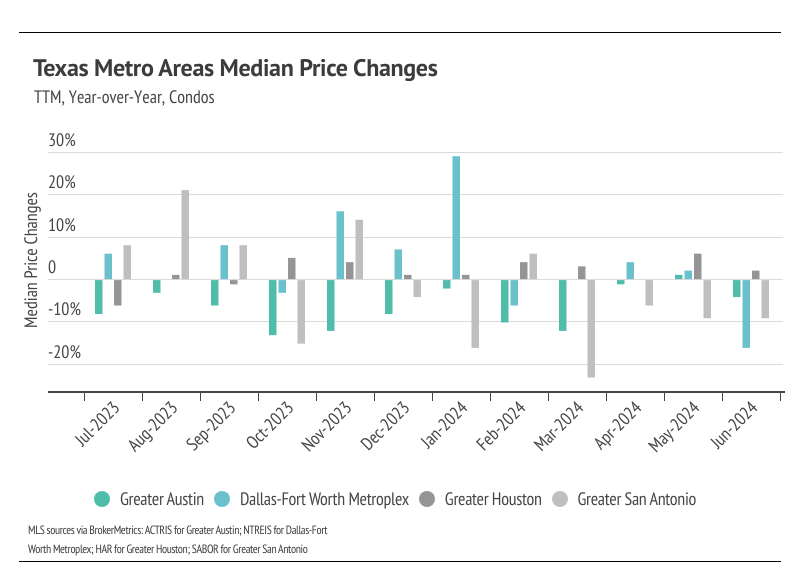
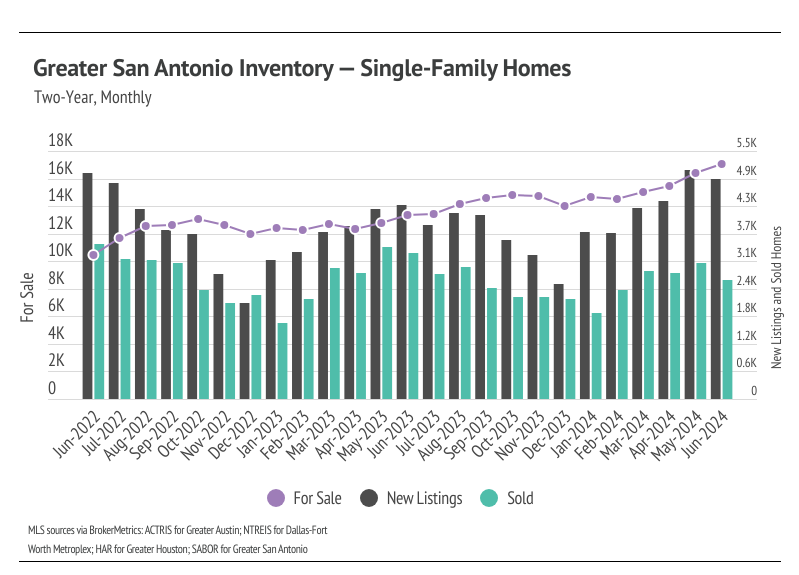
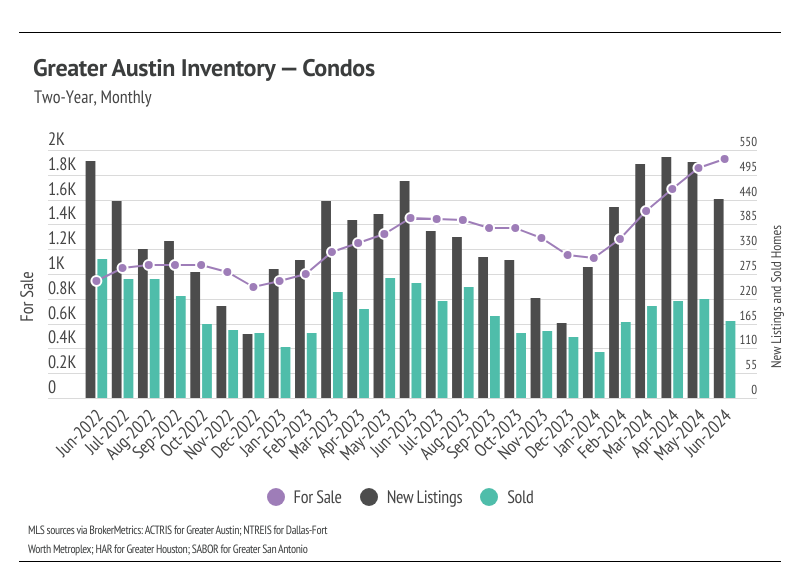
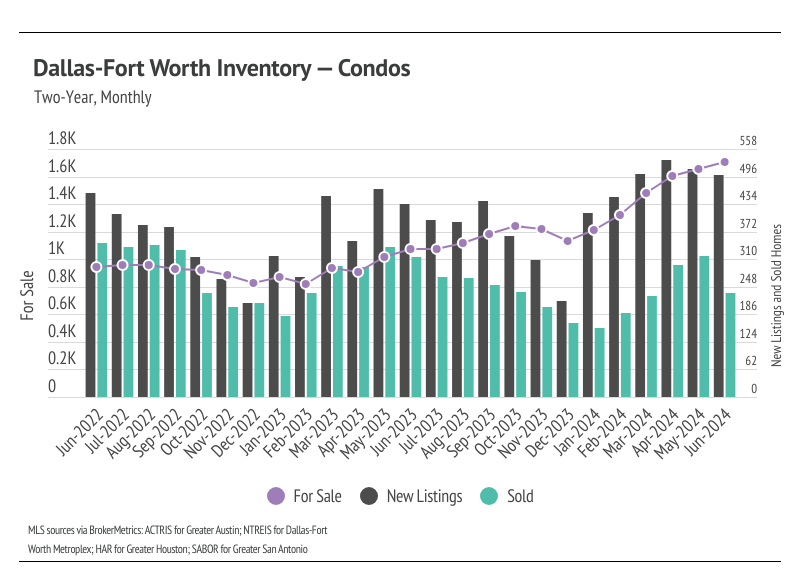
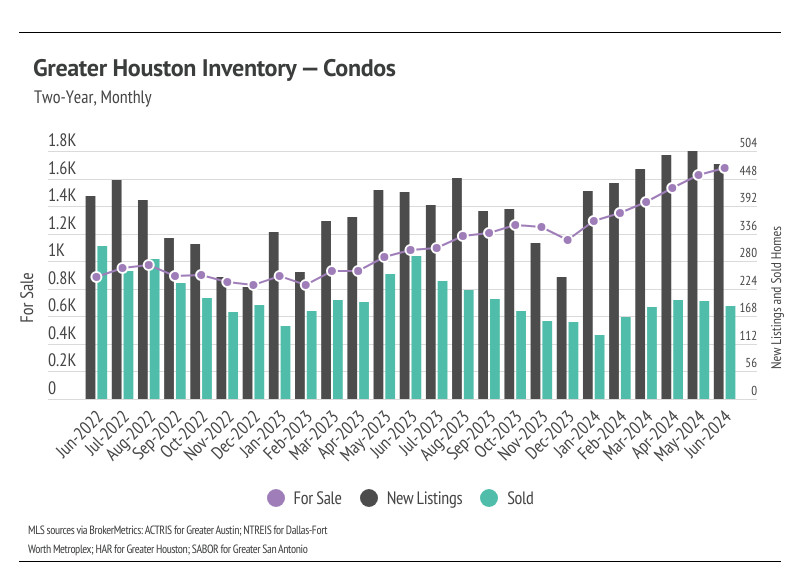
In Texas, home prices haven’t been largely affected by rising mortgage rates with the exception of Greater Austin, which has had a major price contraction from May 2022 to February 2023. Broadly, price contractions are normal in the fall and winter months of any year, so it’s hard to conclude that higher rates had any meaningful effect on price across most of Texas’ major metros. Since February 2023, prices have been fairly stable across markets, however. We expected prices to remain below peak in the winter, but as seasonal demand increased in the spring, prices started to increase. However, we don’t expect record high prices in the summer months. The inventory buildup in 2023 has created a healthier market in 2024, satiating demand as it has grown. We expect single-family home prices to continue to rise next month, as the rising inventory and new listings attract more buyers to the market.
High mortgage rates soften both supply and demand, but home buyers and sellers seemed to tolerate rates above 6%. Now that rates are near 7% again, sales are slowing during the time of the year when sales tend to be at their highest. This phenomenon isn’t great for the market, but it isn’t terrible, either, as it may allow inventory to build in a massively undersupplied market.
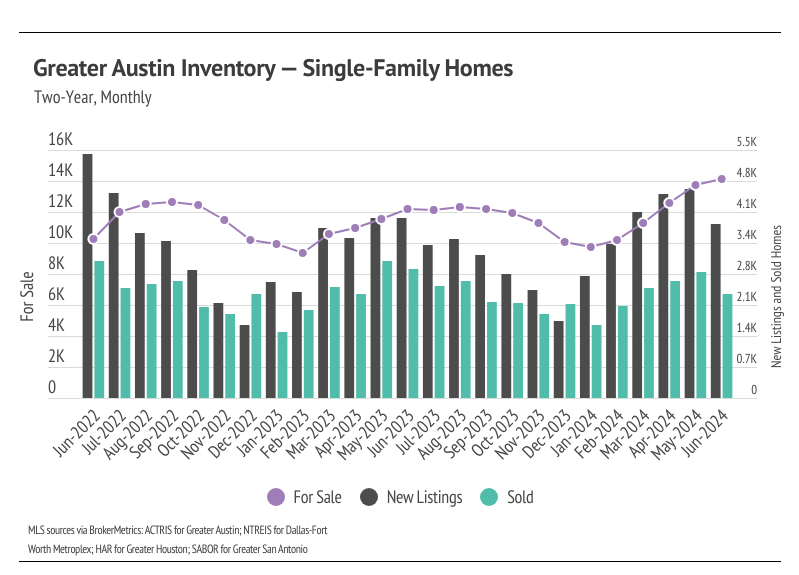
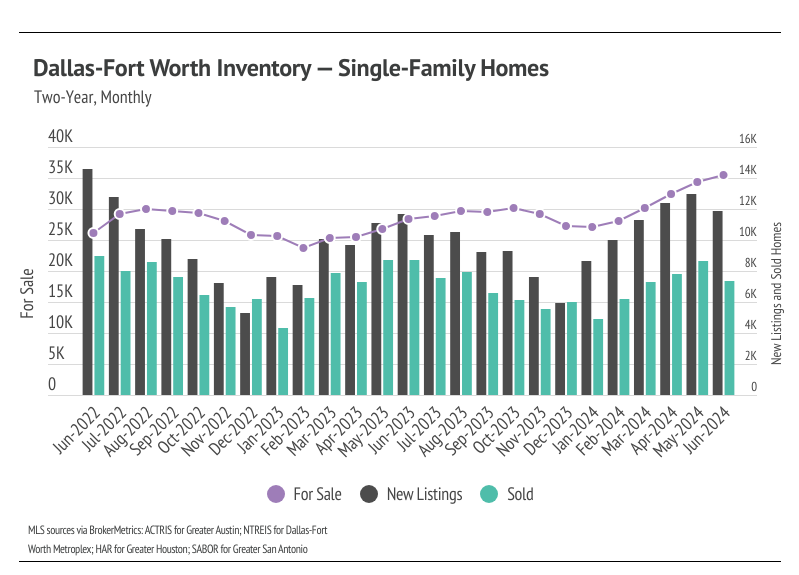
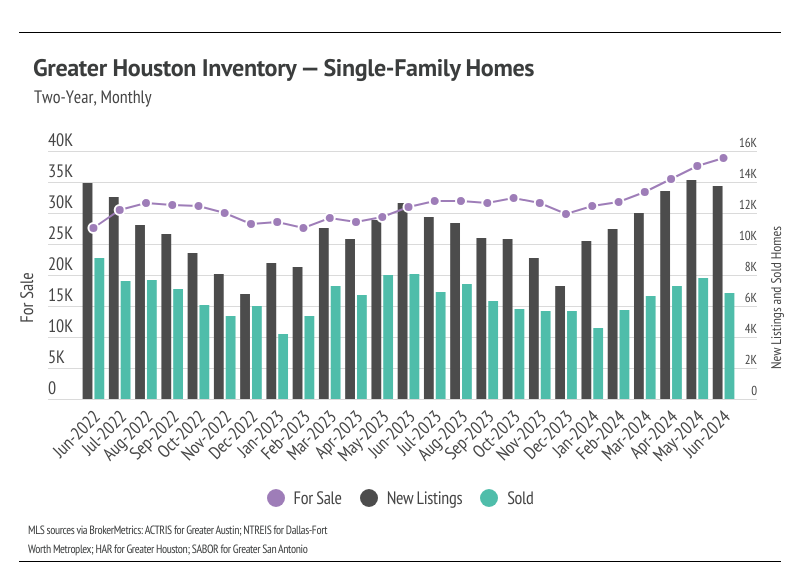
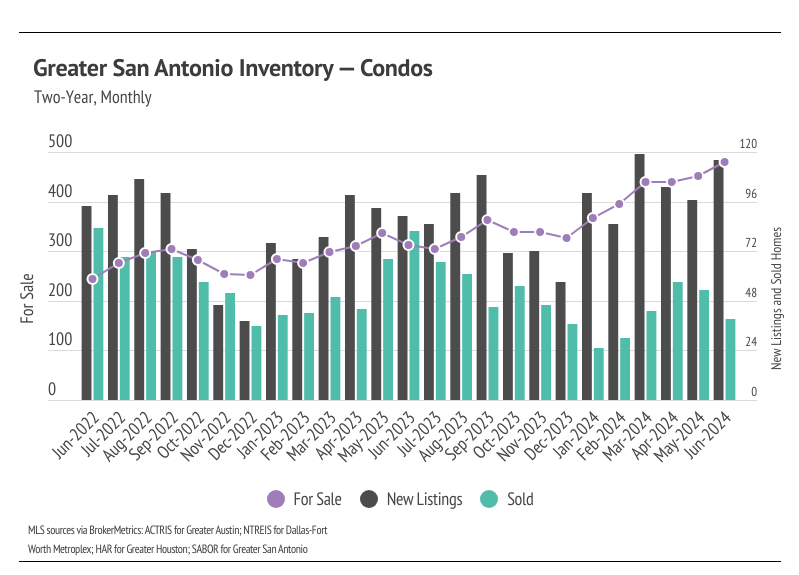
Inventory trended higher into the fall of 2023 and winter 2023/2024, which is far from the seasonal norm. Typically, inventory peaks in July or August and declines through December or January. Inventory levels in Texas’ major metro areas are unusual in the United States, in that they actually built up to pre-pandemic levels in 2023, moving higher primarily due to softening demand caused by higher interest rates. During Q4 2023, inventory peaked in October before declining slightly in November and December, as sales and new listings declined.
In 2024, inventory began to increase once again. Notably, inventory across markets reached a two-year high in May and then again in June. The number of new listings coming to market is a significant predictor of sales, and the substantial increase in new listings so far in 2024 has led to an increase in sales through May month over month. In June, new listings and sales declined across markets.
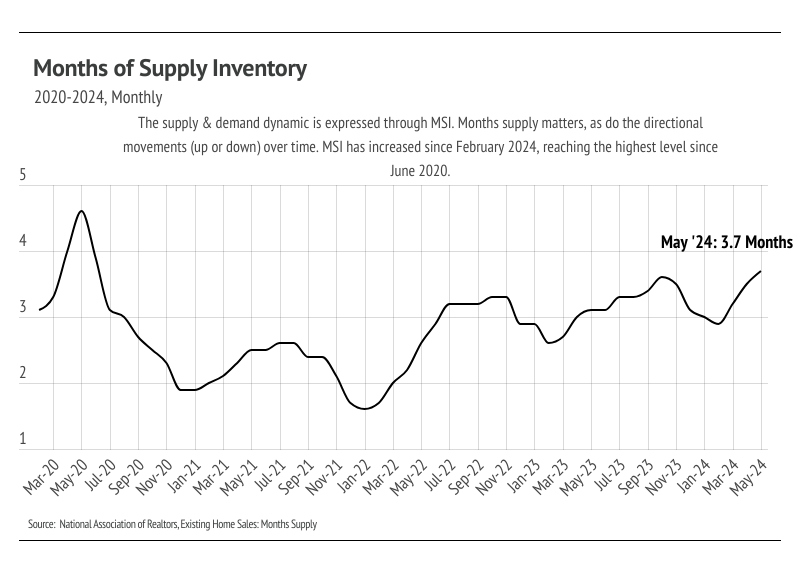
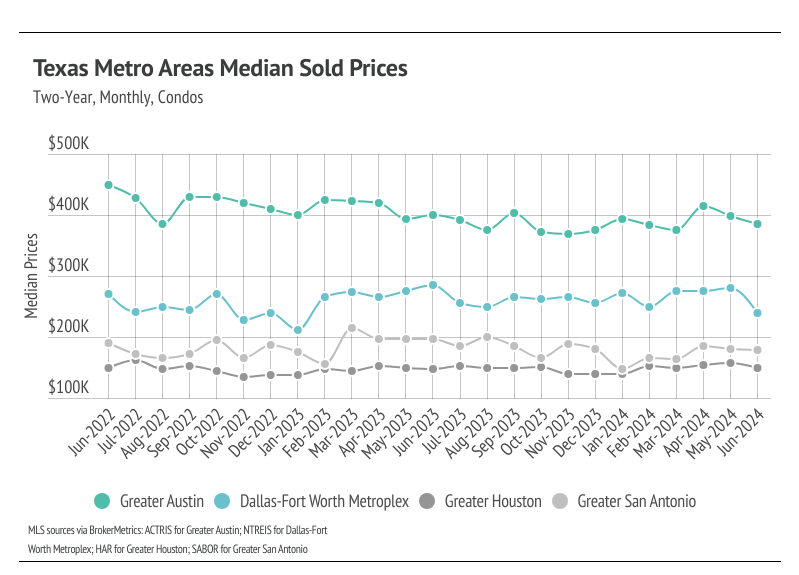
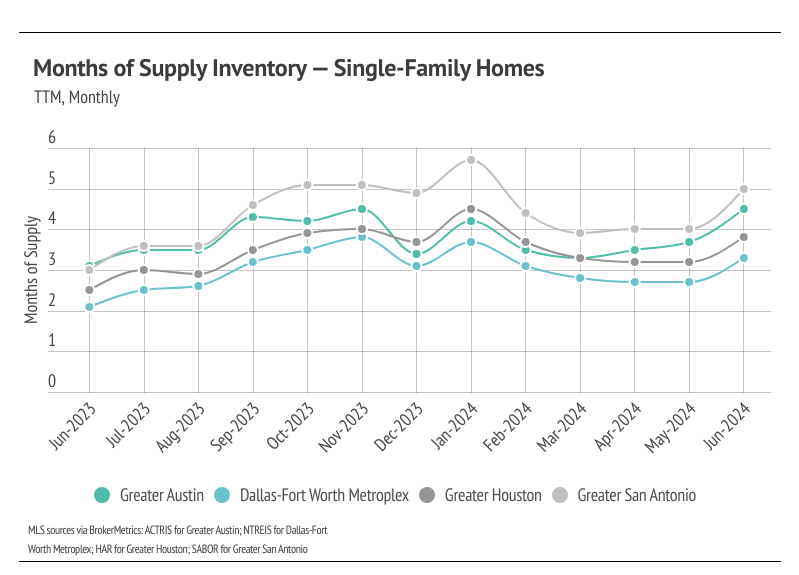
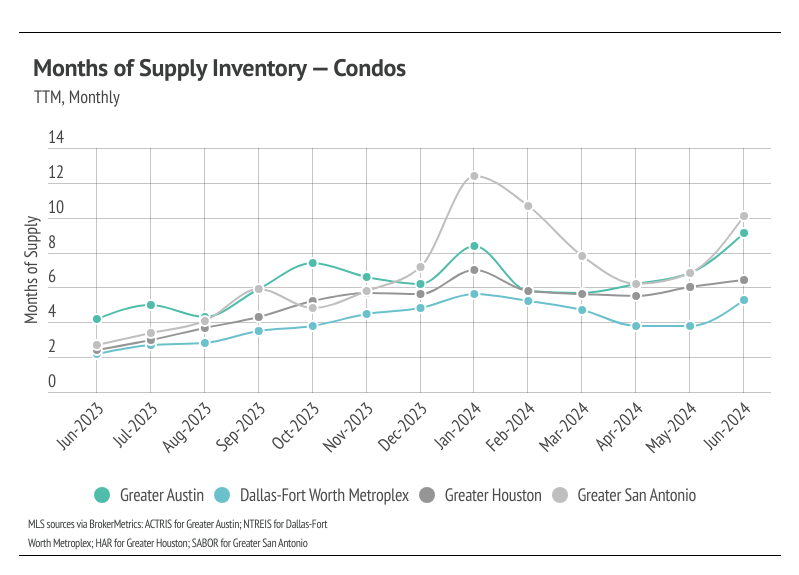
Months of Supply Inventory (MSI) quantifies the supply/demand relationship by measuring how many months it would take for all current homes listed on the market to sell at the current rate of sales. The long-term average MSI is around four to five months in Texas, which indicates a balanced market. An MSI lower than four indicates that there are more buyers than sellers on the market (meaning it’s a sellers’ market), while an MSI higher than five indicates there are more sellers than buyers (meaning it’s a buyers’ market). MSI trended higher from May 2023 to January 2024 largely due to the decline in sales and longer time on the market. However, in February and March 2024, MSI declined across markets as sales rose and homes sold at a faster rate. April and May MSI movements were mixed in Texas markets, and in June, MSI rose across markets. Currently, for single-family homes, MSI indicates that Greater San Antonio is balanced, while Greater Austin, Greater Houston, and Dallas-Fort Worth favor sellers. For condos, MSI indicates that the markets favor buyers except for Dallas-Fort Worth, which now is more balanced.
Stay up to date on the latest real estate trends.

August 2026

July 2026

A Closer Look at Dallas Rental Prices, Hidden Costs, and What Renters Need to Know Before Moving

June 2026

May 2026

April 2026

March 2026

February 2026

January 2026
You’ve got questions and we can’t wait to answer them.