When will inventory return to normal?
Quick Take:
-
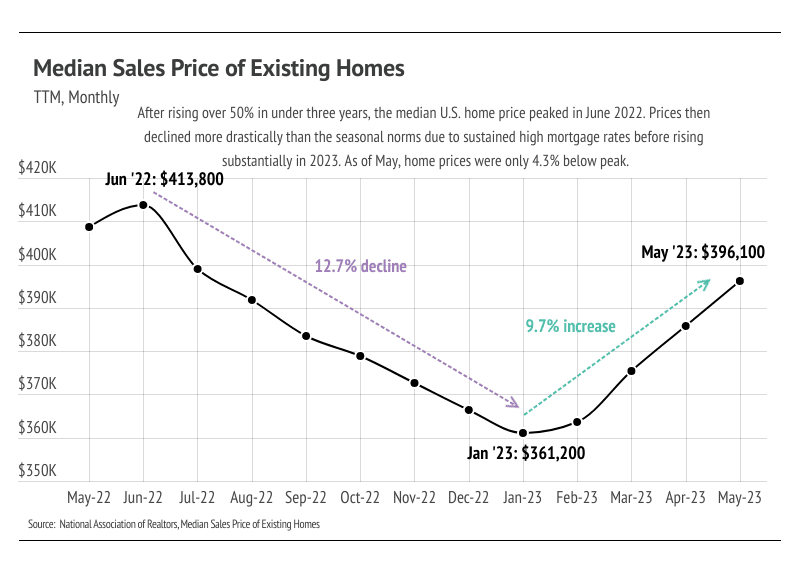
The median home price in the United States landed 4.3% below the all-time high reached in June 2022 after appreciating 9.7% in 2023. When accounting for current home prices and mortgage rates, the monthly cost of financing a home has never been higher.
-
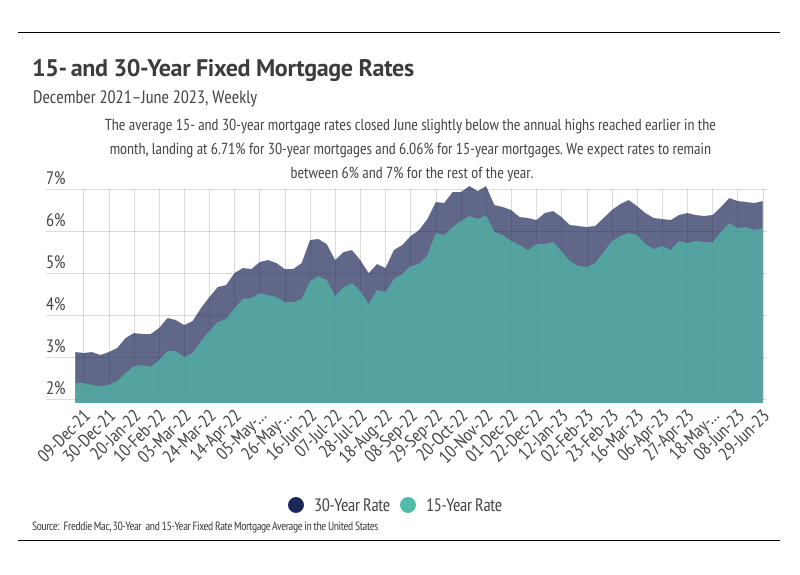
As expected, the Fed chose not to raise rates in June but will likely raise rates at least two more times this year. We continue to expect mortgage rates to remain between 6% and 7% for the rest of 2023.
-
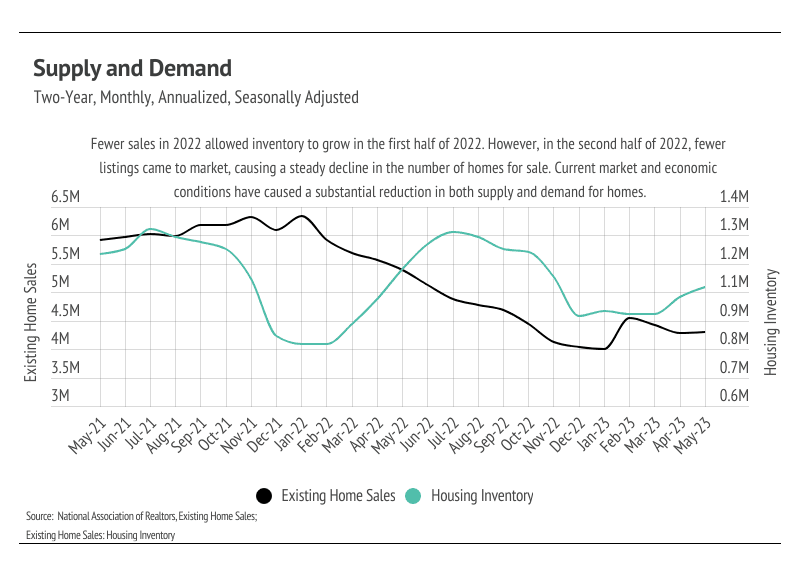
Broadly, housing inventory will likely remain historically low for at least three more years because of the high levels of sales and refinancing that occurred from June 2020 to June 2022.
Note: You can find the charts & graphs for the Big Story at the end of the following section.
Expect sustained mild sales and low inventory because of the 2020-2022 buying boom
The median home price in the United States increased by slightly over 50% in less than three years from 2020 to 2022, peaking in June 2022 — the largest and fastest price growth in history. The dramatic rise in prices primarily resulted from pandemic-related stimulus and lifestyle changes, which incentivized buying a home that was worth spending considerably more time in. All of a sudden, homes became more valuable for buyers, but due to record-low mortgage rates, they also became more attainable, which led to a buying boom that caused inventory to hit record lows in February 2022.
At the same time, homeowners perfectly content with the homes they had also wanted to take advantage of the low mortgage rates, causing refinancing to skyrocket. Refinance rates reached their highest in history in the fourth quarter of 2020. Refinancing remained high in 2021 but fell slowly throughout the year. Generally, it doesn’t make financial sense to refinance, only to sell your property soon thereafter, because of the costs of the refi (often 2-6% of the loan). Between home purchases and refinancing from June 2020 to June 2022, the U.S. has an outsized number of homeowners who were able to lock in a mortgage rate at or near the lowest rate in history. Because most people don’t buy and sell or refinance homes year after year, the current inventory level is reasonable, albeit challenging for buyers.
According to the National Association of Realtors (NAR), the median duration of homeownership in the United States was around 13 years in 2020. But let’s say, for the sake of example, we believe that number is no longer accurate, and it’s really more like five years. If five years is the median duration of homeownership, that means that pandemic-era buyers and refinancers likely won’t even start to consider reentering the housing market for at least another three years. It should be noted that five years is most likely generously low, particularly because the high mortgage rates (6.71% at the end of June) are disincentivizing homeowners who already have low rates from selling and buying a new home. As a result, low inventory is here to stay in most of the U.S., especially in highly developed areas where land for new housing is hard to come by. Additionally, mortgage rates will likely take three years to contract in a meaningful way as the Fed continues to raise rates in an effort to combat inflation.
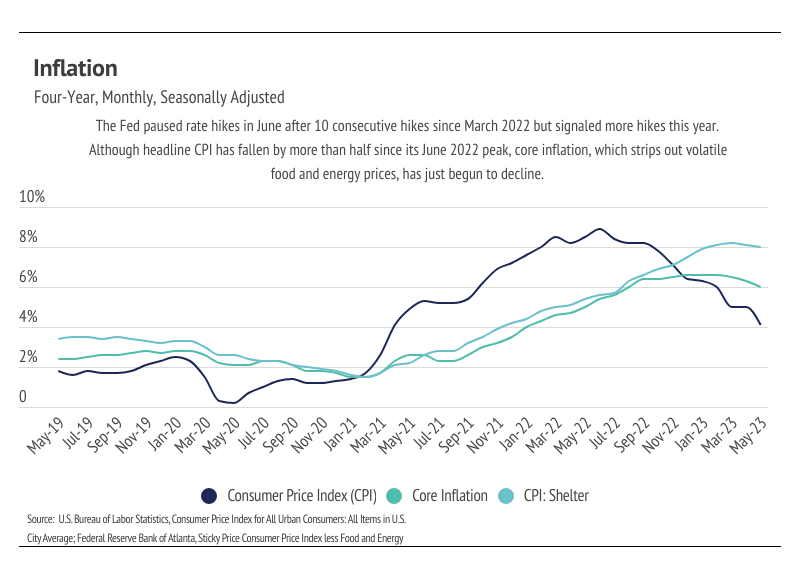
During the Fed’s June meeting, board members decided unanimously to pause rate hikes but noted that at least two more would likely occur this year. Although headline inflation (Consumer Price Index, or CPI) is down by half since it hit 9% last June, core inflation, which removes volatile food and energy prices from the inflation calculation, has barely started to fall. Core inflation peaked in December 2022 and has contracted 9%. A large component to core inflation is shelter. The Consumer Price Index for Shelter is only down 2% from the March 2023 peak. This isn’t exactly surprising. If we compare the monthly cost of financing a median-priced home with the average 30-year mortgage in December 2021 versus June 2023, the monthly cost has increased 95%.
Different regions and individual houses vary from the broad national trends, so we’ve included a Local Lowdown below to provide you with in-depth coverage for your area. In general, higher-priced regions (the West and Northeast) have been hit harder by mortgage rate hikes than less expensive markets (the South and Midwest) because of the absolute dollar cost of the rate hikes and the limited ability to build new homes. As always, we will continue to monitor the housing and economic markets to best guide you in buying or selling your home.
The Local Lowdown
Greater Austin, Greater Houston, Dallas-Fort Worth Metroplex, and Greater San Antonio
Quick Take:
-
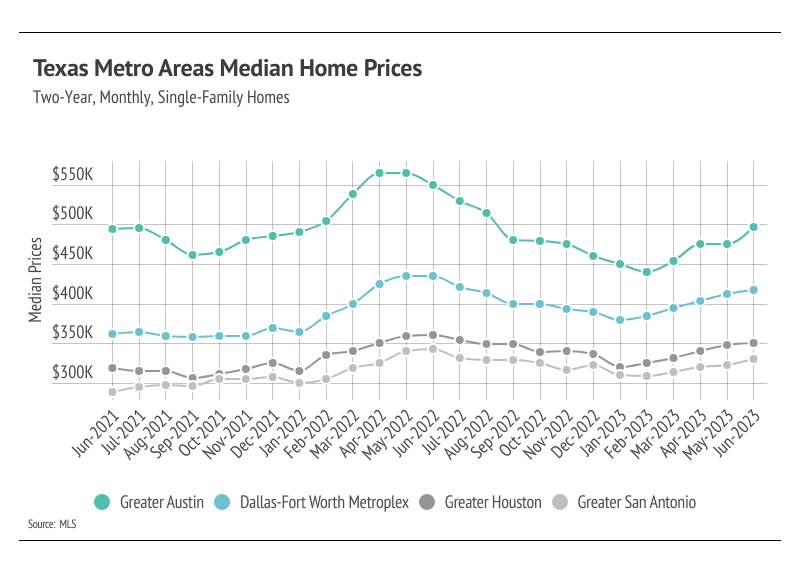
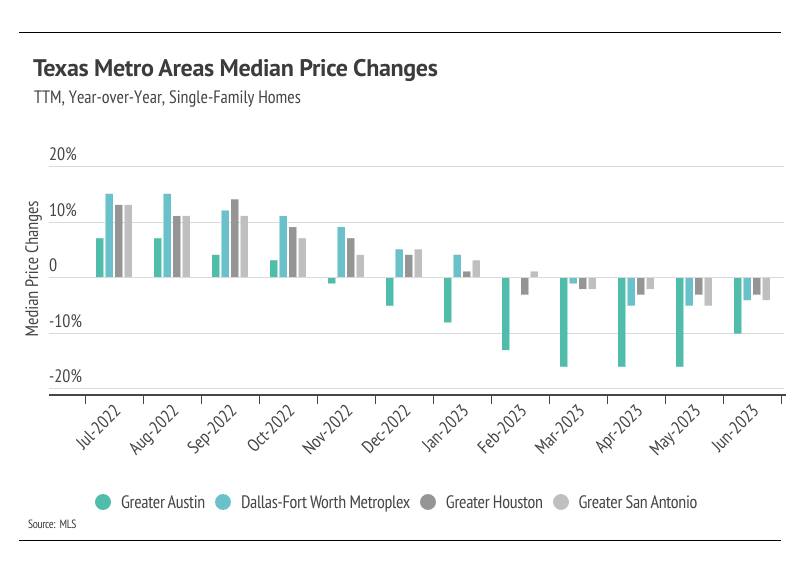
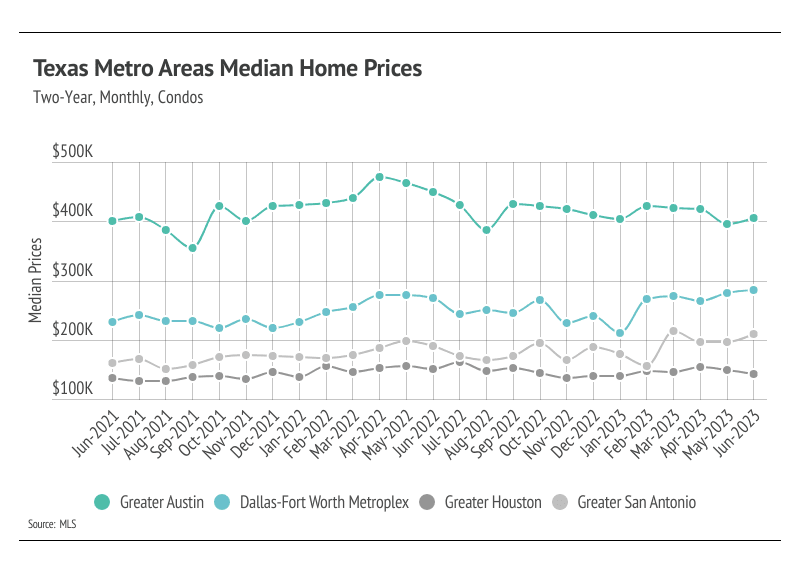
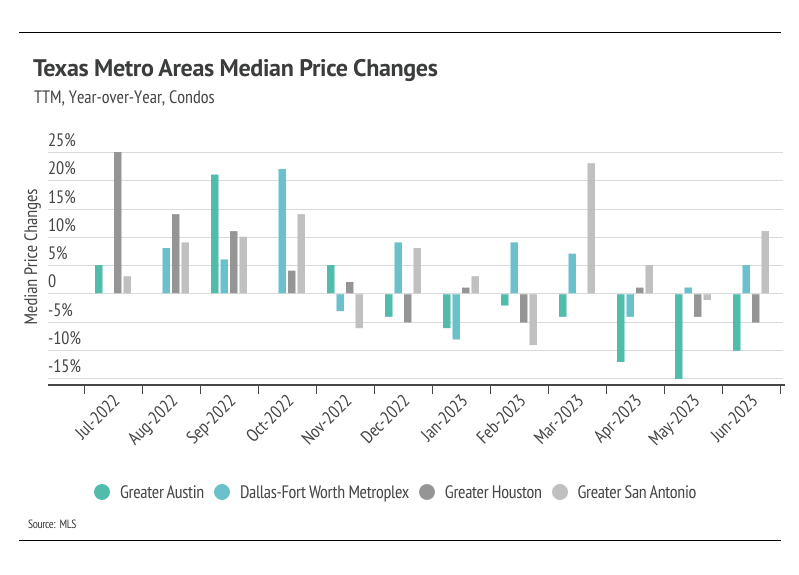
Year to date, single-family home and condo prices were up in the selected Texas markets through June 2023, with the exception of Greater Austin condos. Notably, the median single-family home price in the Dallas-Fort Worth Metroplex, Greater Houston, and Greater San Antonio are near the all-time highs reached in June last year.
-
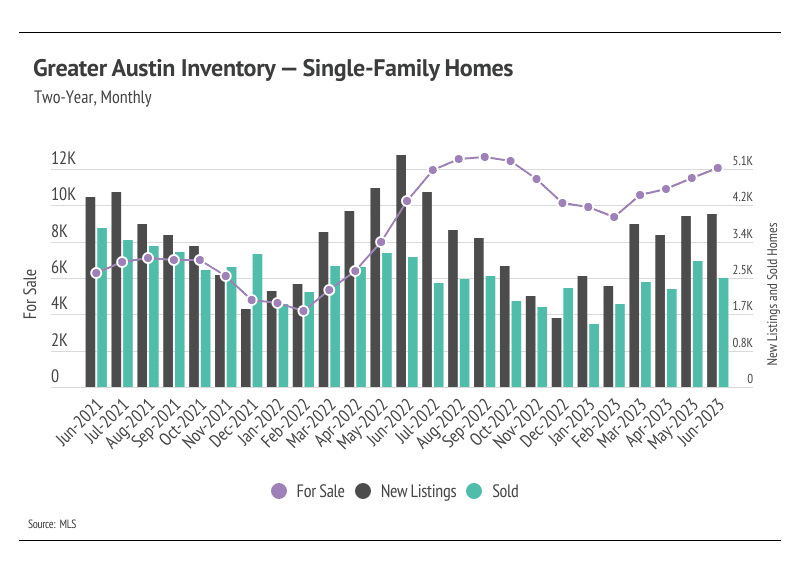
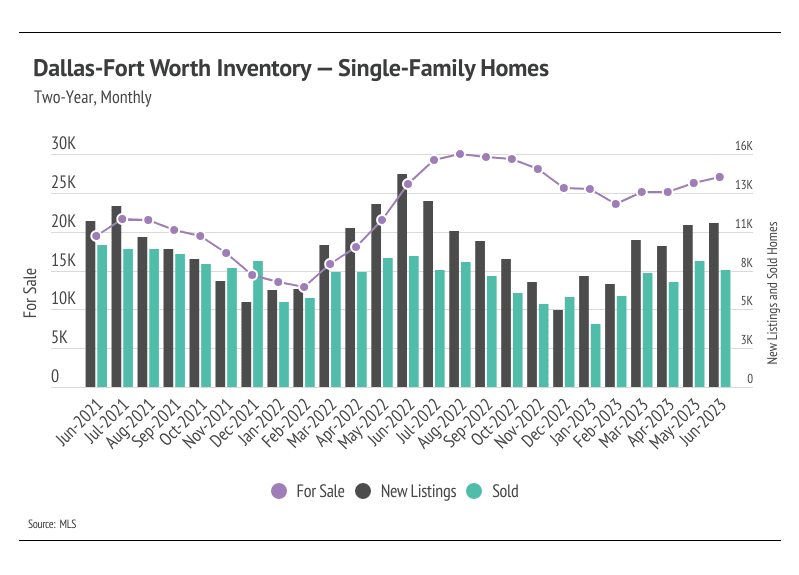
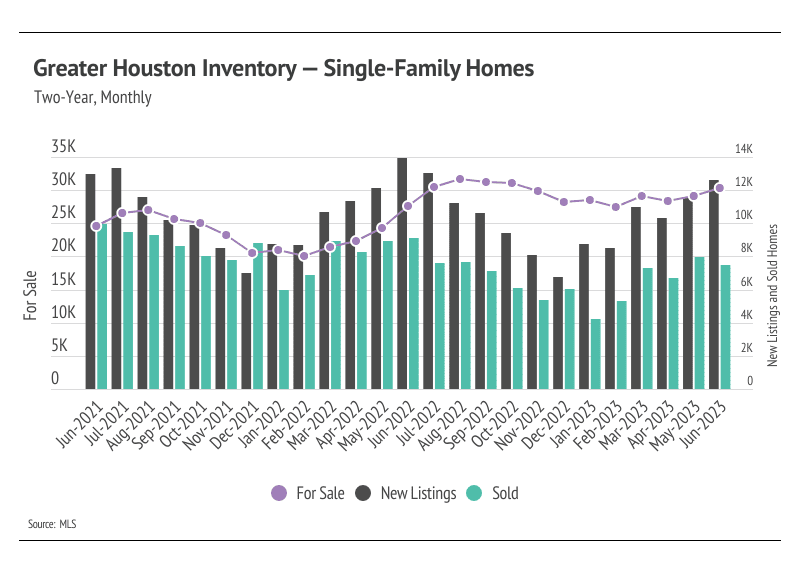
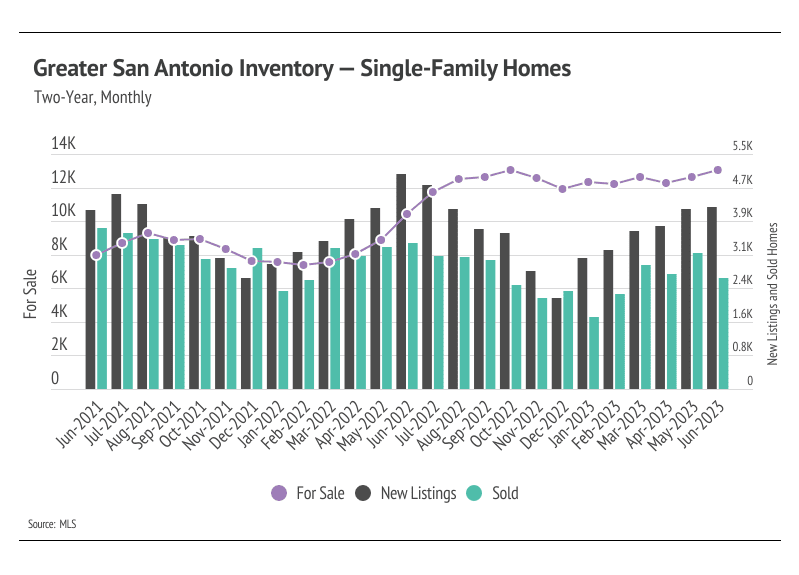
Sales slowed and new listings rose from May to June, which is common this time of year. Single-family home inventory has grown in 2023, which has helped alleviate some excess demand.
-
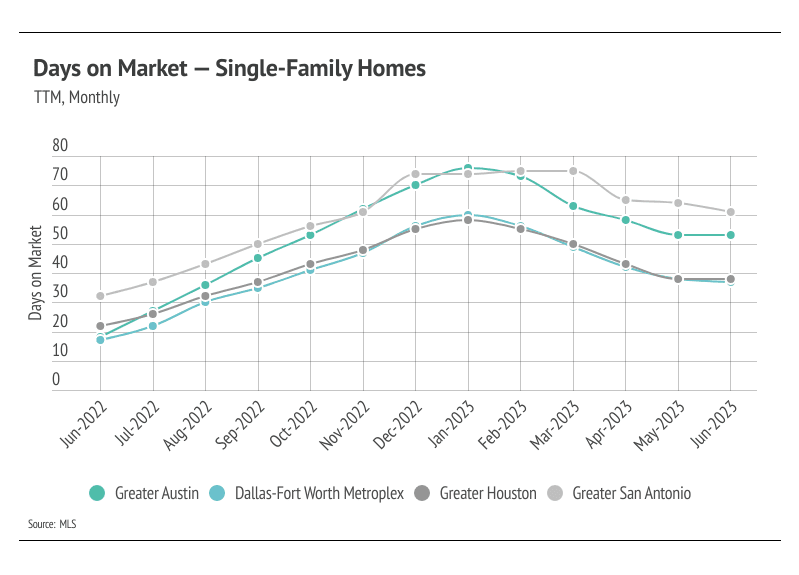
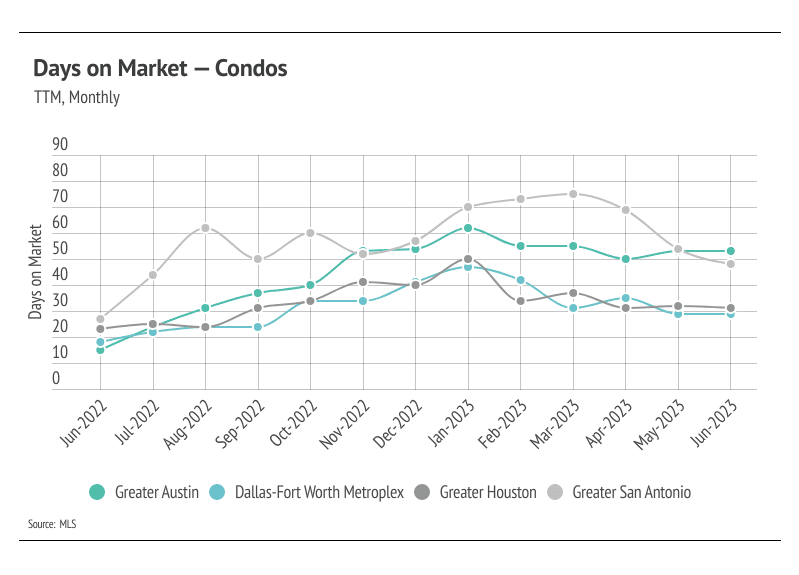
Months of Supply Inventory has declined significantly in 2023, homes are selling more quickly, and sellers are receiving a greater percentage of asking price, all of which highlight an increasingly competitive environment for buyers.
Note: You can find the charts/graphs for the Local Lowdown at the end of this section.
Single-family home prices near all-time high
In the selected Texas markets, housing is always experiencing high demand. Even as prices rise quickly, coupled with mortgage rates near 20-year highs, demand is still strong. Increasing demand and rising inventory are driving the rapid home price appreciation that Texas has experienced this year. Housing prices typically work in a counterintuitive way. In a classic supply/demand problem, as supply falls and demand remains steady or increases, prices rise. Housing works a bit differently. In the first half of the year, new listings usually rise rapidly, far outpacing sales and causing overall inventory to rise from the winter lows. Demand also tends to rise in the first half of the year, and the increasing supply actually benefits the overall market because buyers can more easily find a home that suits their wants and needs. Finding the right home is far more valuable than feeling forced into a home that’s not right, so prices tend to rise in the first half of the year.
Year to date, single-family home prices have increased substantially across Texas markets. Condo prices are up but haven’t appreciated as fast as single-family homes. Single-family home prices in the Dallas-Fort Worth Metroplex, Greater Houston, and Greater San Antonio could easily hit new all-time highs by August 2023.
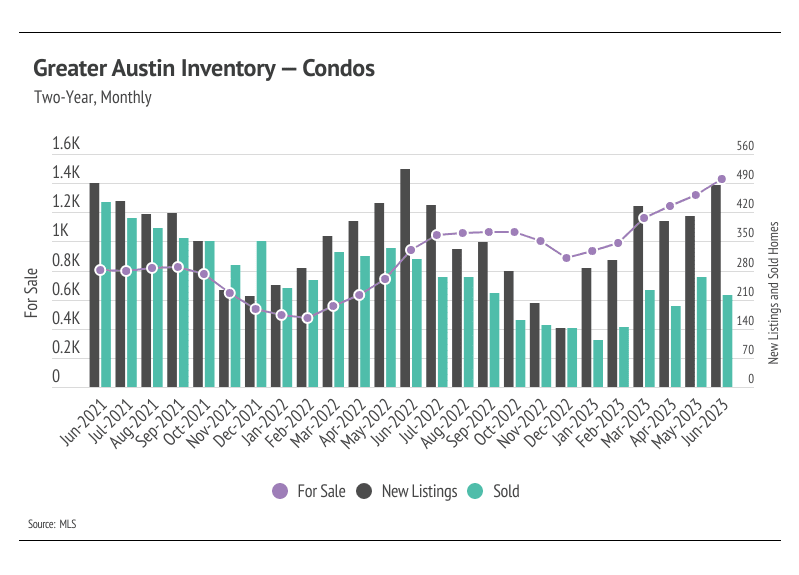
Inventory rose across markets in the first half of the year
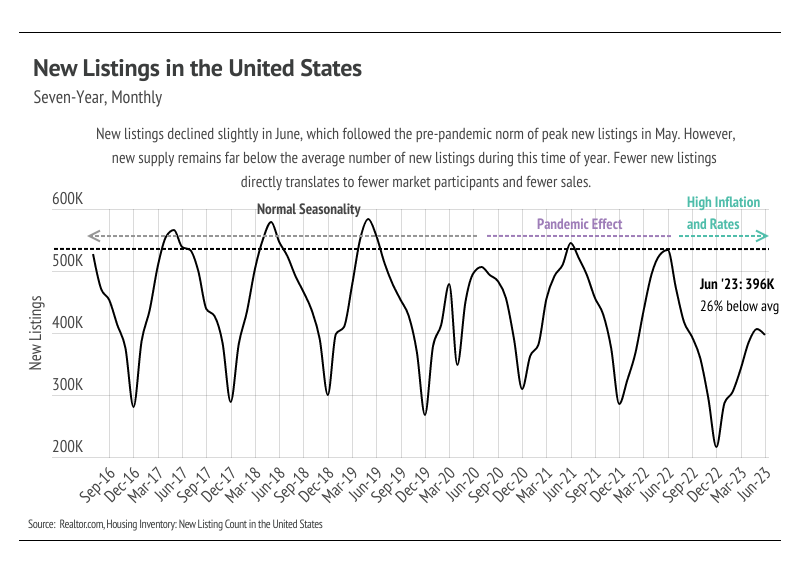
Single-family home and condo inventory, sales, and new listings rose in the first half of the year, with Greater Austin condo and Greater San Antonio single-family home inventory reaching a two-year high. The number of home sales is, in part, a function of the number of active listings and new listings coming to market. Even with inventory growth, supply is low relative to demand, so new listings are good for the market. Potential sellers who have fully paid off their property are in a particularly good position if they don’t have to finance their next property after the sale of their home. Since January, sales rose 77% while new listings increased 46%.
As buyer competition has ramped up and sellers are gaining negotiating power, sellers are receiving more of their listed price. In June 2023, the average seller received 3-5% more of their listed price as compared to January.
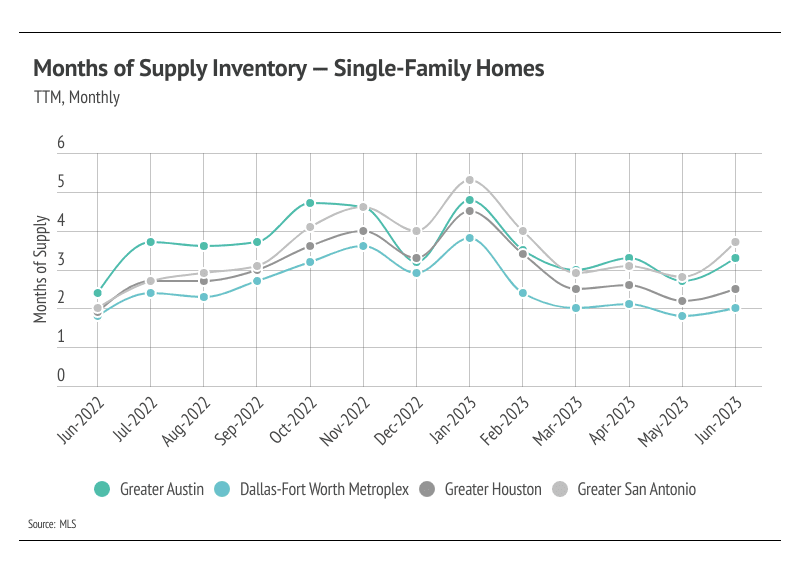
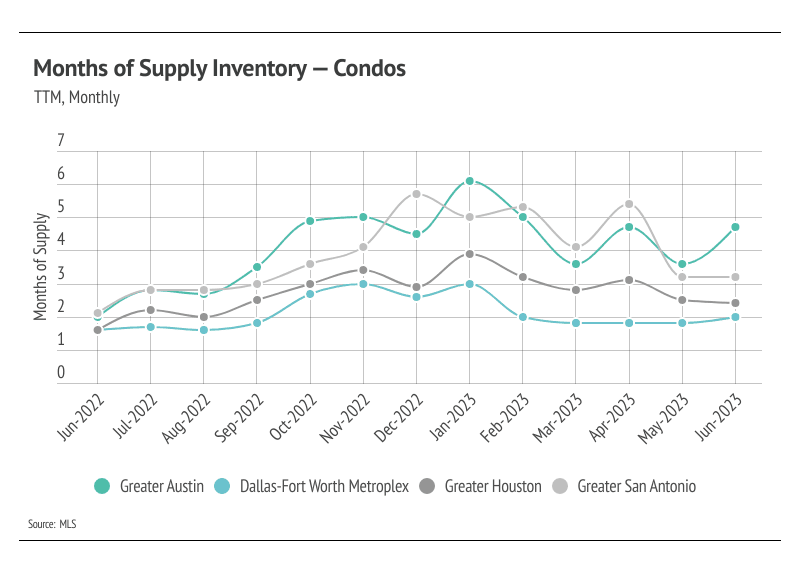
Months of Supply Inventory for single-family homes and condos indicate a sellers’ market
Months of Supply Inventory (MSI) quantifies the supply/demand relationship by measuring how many months it would take for all current homes listed on the market to sell at the current rate of sales. The long-term average MSI is around four to five months in Texas, which indicates a balanced market. An MSI lower than four indicates more buyers than sellers on the market (meaning it’s a sellers’ market), while an MSI higher than five indicates more sellers than buyers (meaning it’s a buyers’ market). MSI dropped significantly across the selected Texas markets for single-family homes and condos this year, indicating a shift from a more balanced to a sellers’ market. MSI for Greater Austin condos was the one exception, moving from a sellers’ market back toward balanced one.