Market Update Dallas

Note: You can find the charts & graphs for the Big Story at the end of the following section.
*National Association of REALTORS® data is released two months behind, so we estimate the most recent month’s data when possible and appropriate.
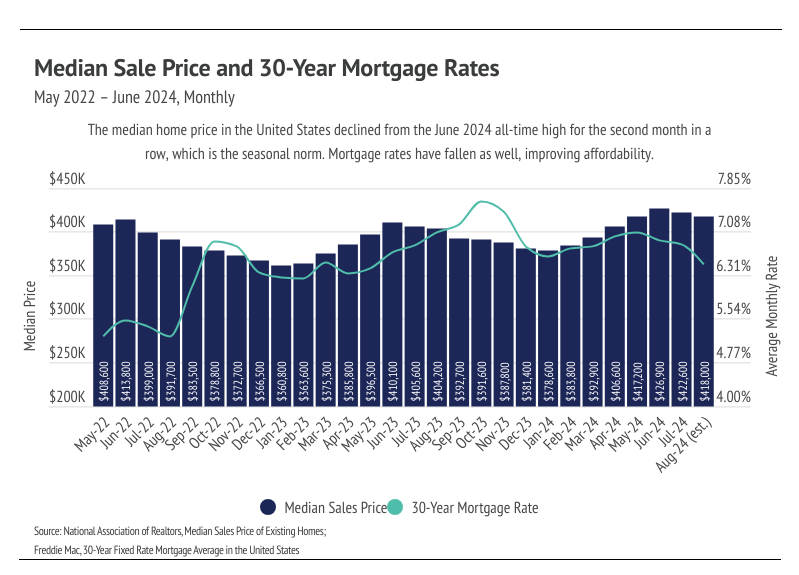
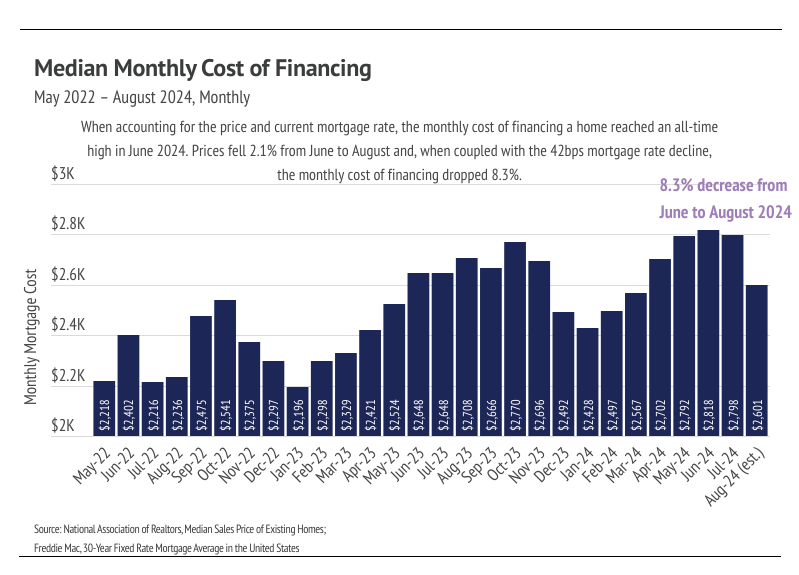
Despite low affordability through June 2024, affordability began improving in August 2024. The median U.S. home price reached a record high in June 2024, as did the monthly cost of financing a median-priced home, even though mortgage rates weren’t quite at their highest level this year. In other words, affordability hit a record low in June. Generally, prices tend to peak in June during any given year, even though the market veered away from this seasonality for a few years during the pandemic. It was no surprise, therefore, when prices declined slightly in July and August of this year. Additionally, during July and August, inflation lowered meaningfully, which means rate cuts. The anticipation of rate cuts alone led to lower rates in July and August. Over the past two months, the average 30-year mortgage rate fell 0.51%, which drastically improved affordability.
A rough but decent shorthand calculation for mortgage rates is that every 0.10% increase or decrease to mortgage rates equates to roughly a 1% increase or decrease in the monthly mortgage cost. This means that, over the past two months, the monthly payments on homes became approximately 5% cheaper.
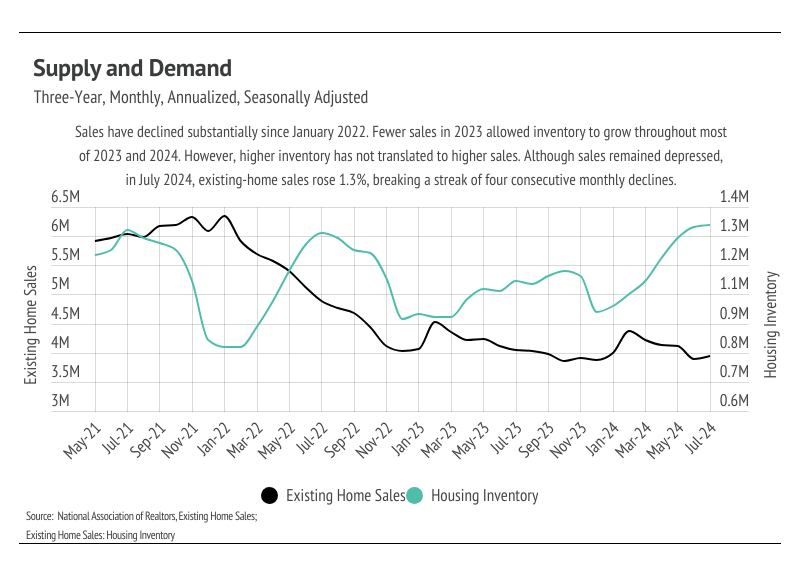
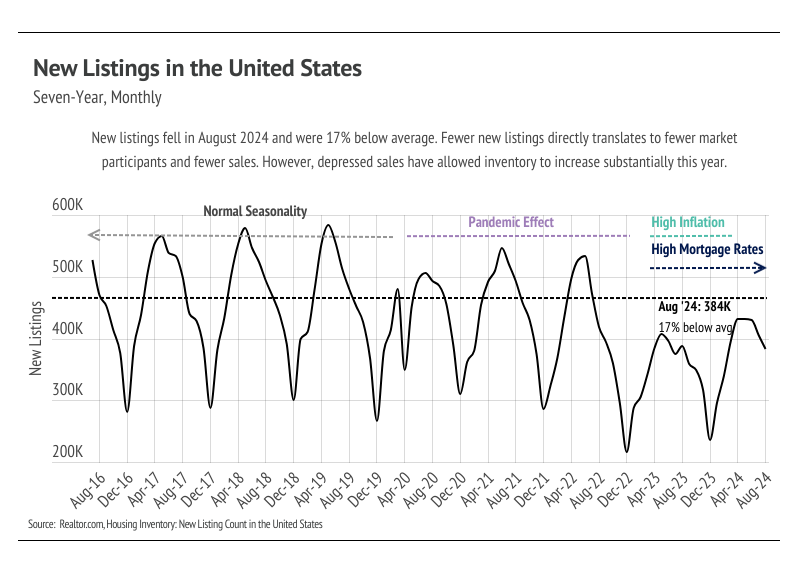
Sales and inventory generally also decline in the second half of the year. However, this historical trend has broken over the past couple of years. Sales have been historically low since January 2023; so, even though new listings have also been depressed, inventory has grown to its highest level since 2020. At this moment, homebuyers have more choice than they’ve had in years. Higher supply, lower price, and lower interest rates caused sales to increase month over month, albeit only slightly — up 1.3%.
Sales may continue to increase, however, because of the improving conditions, and sales levels are so low they almost have nowhere to go but up. The mid-September Fed meeting will likely bring about the first in a series of rate cuts, and the housing market may fare extremely well next year due to the timing of the cuts. The inventory build-up will likely slow for the rest of the year; but, since it’s already grown substantially, that isn’t concerning. We expect to enter 2025 with falling rates, high inventory, and seasonally lower home prices, which should create a perfect storm for a hotter spring market. We realize spring is a bit far; but, until then, we expect the sluggish market we’ve experienced over the past two years to persist, at least in terms of sales. The current market is favoring buyers, so if you’re thinking of buying, we can at least say that you have the most options to choose from.
Different regions and individual houses vary from the broad national trends, so we’ve included a Local Lowdown below to provide you with in-depth coverage for your area. As always, we will continue to monitor the housing and economic markets to best guide you in buying or selling your home.
Stay up to date on the latest real estate trends.

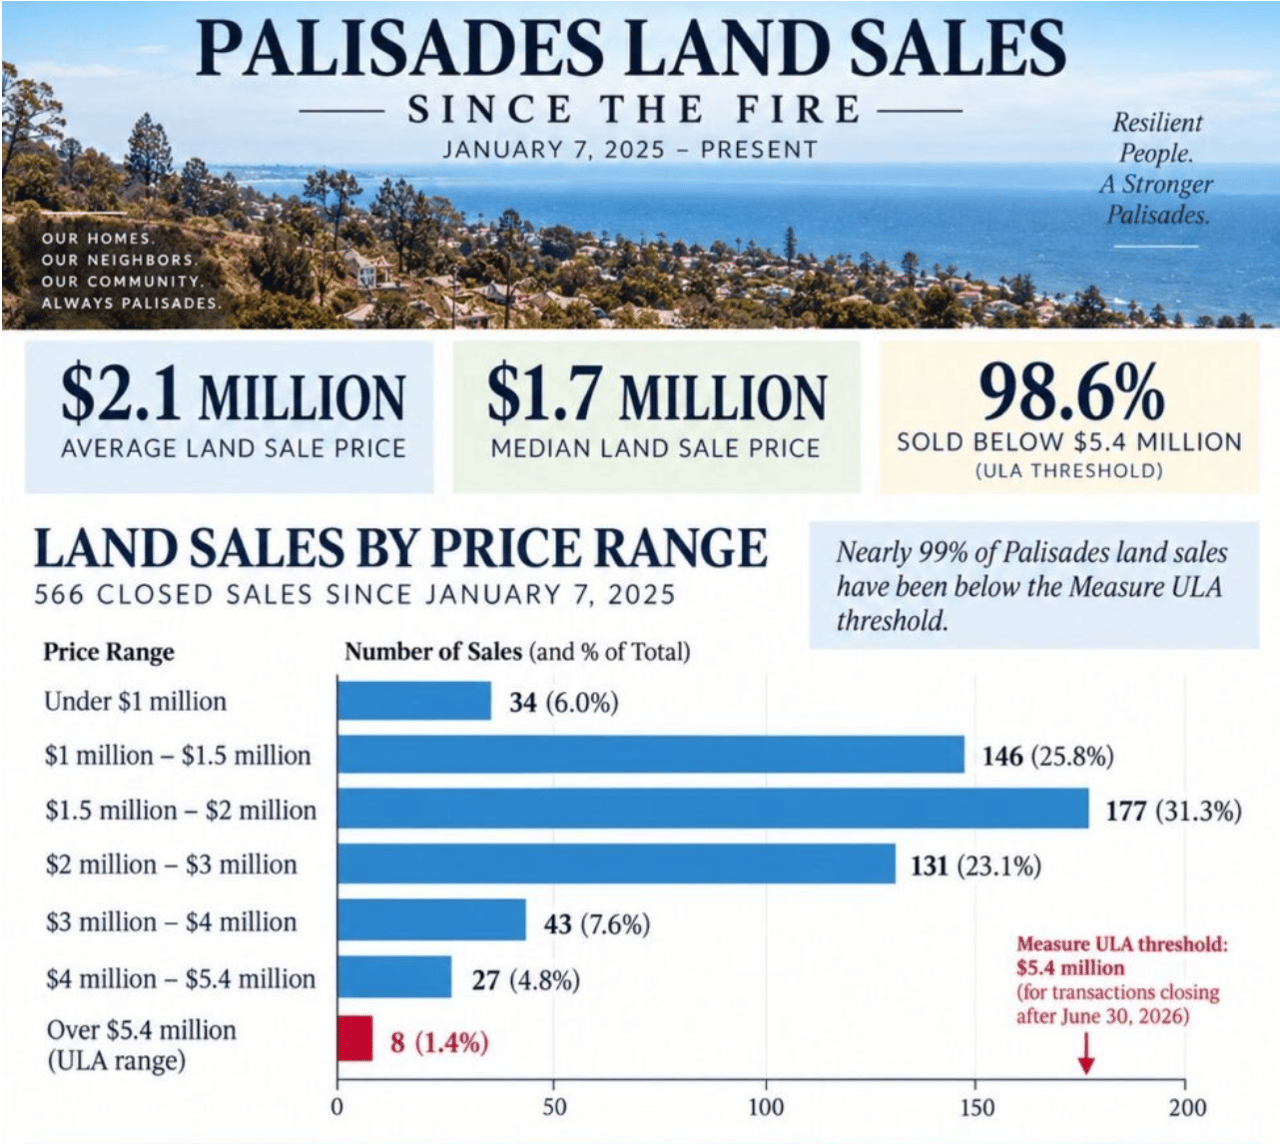
21 Months After the Fire: What’s Really Happening in Pacific Palisades Real Estate?
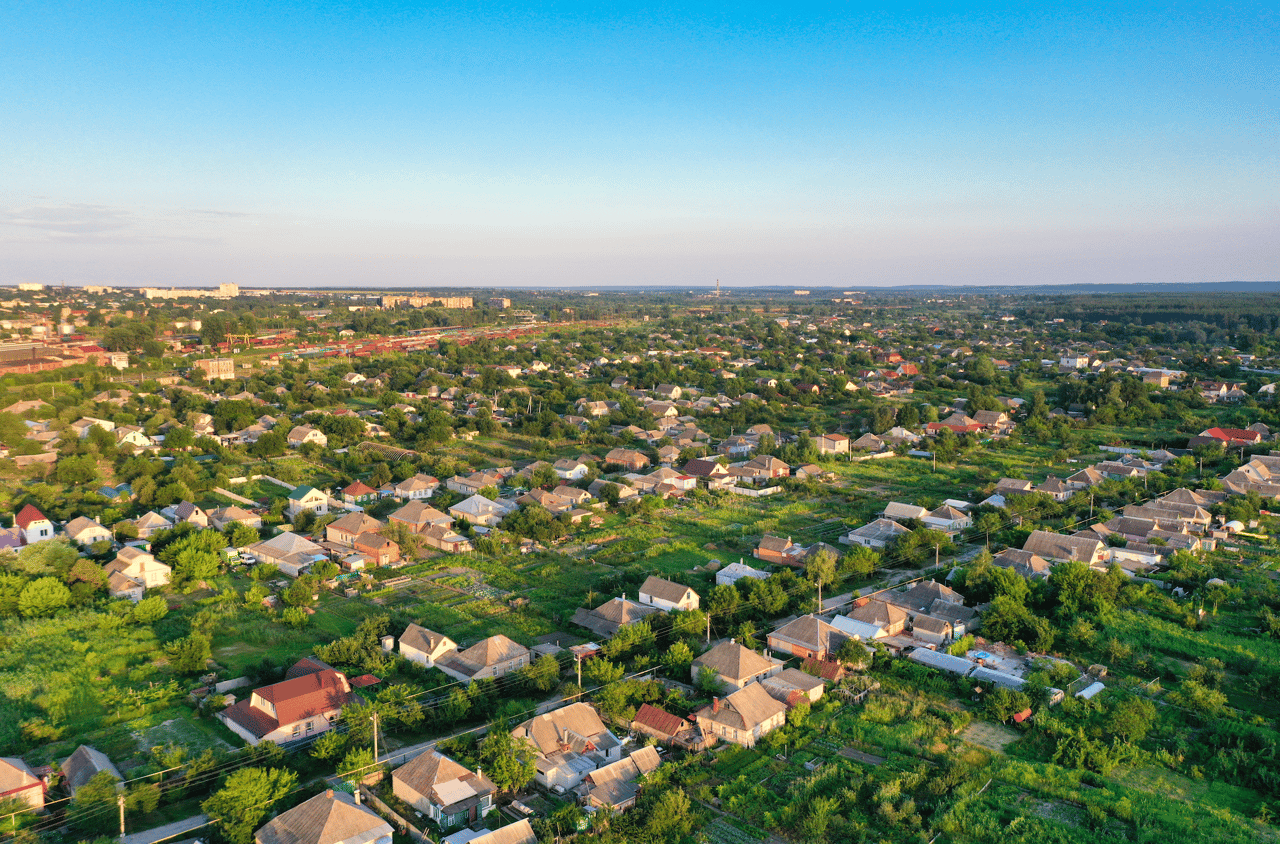
Beautiful homes and an active community in a central Dallas neighborhood

November 2026

21 Months After the Fire: What’s Really Happening in Pacific Palisades Real Estate?
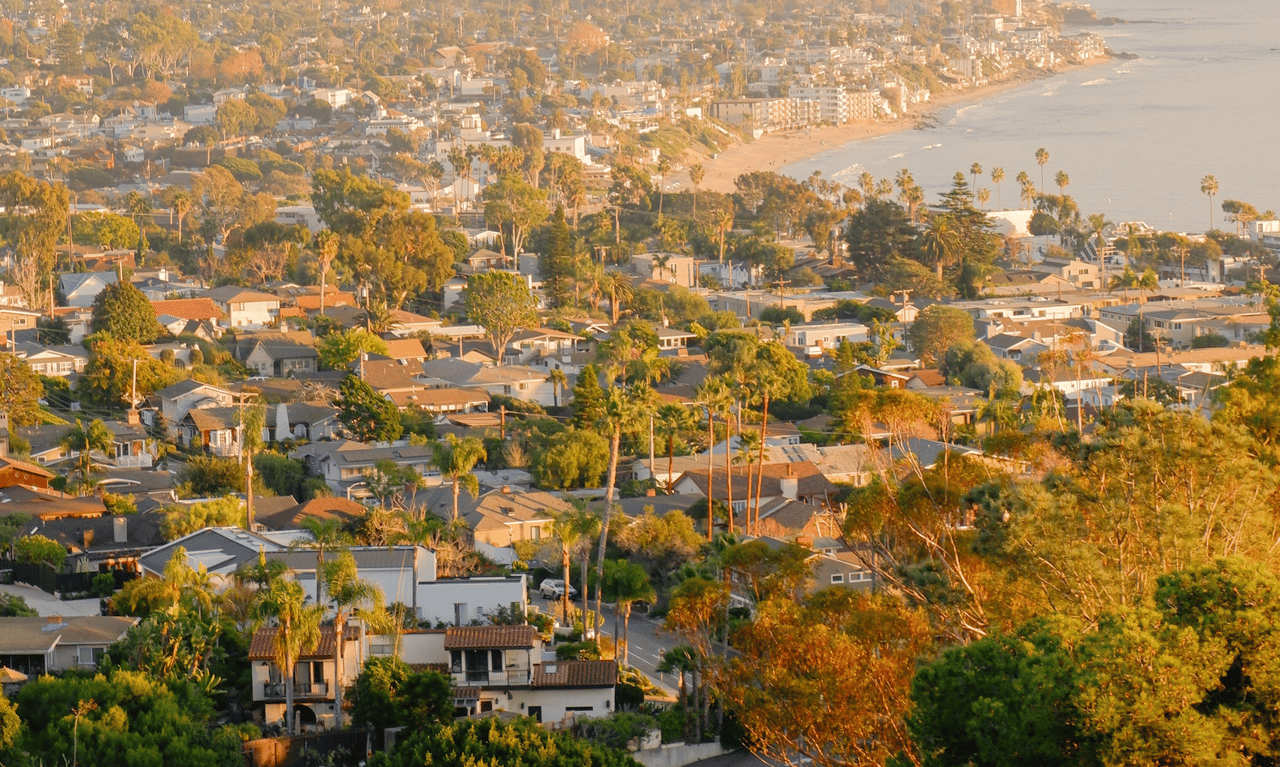
Foreclosure activity has risen since 2025, but the latest numbers remain a small fraction of the Palisades housing market.

October 2026


You’ve got questions and we can’t wait to answer them.